Elaboration on this Achievement Objective
This means students will recognise the features of tabular, graph and equation representations of linear and quadratic relationships. This includes connecting constant first or second order difference in tables with linear and quadratic relations respectively, with the graph (linear and parabolic) and standard equation forms (y = mx + c and y = a x 2 + bx + c) for such relations. For example, given the spatial pattern below students can use a table, graph or equation to represent the relation and solve problems.

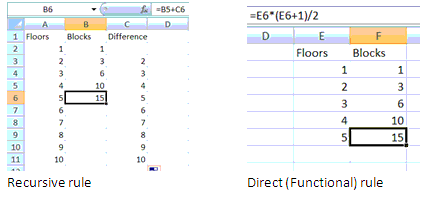
This includes finding both a recursive and direct (functional) rules and using them to find further terms using a spreadsheet or calculator, for example:

Students should also use these tabular and graphic representations for other relationships, such as simple exponential and step relations, but it is acceptable for them to use recursive rules for these more difficult relations.


