The purpose of this activity is to engage students in using their knowledge of linear relationships to solve a problem.
This activity assumes the students have experience in the following areas:
- Using gradients and intercepts to write linear equations.
- Modelling situations with linear equations.
- Using intersections on graphs to solve systems of linear equations.
- Finding the areas of parallelograms.
The problem is sufficiently open ended to allow the students freedom of choice in their approach. It may be scaffolded with guidance that leads to a solution, and/or the students might be given the opportunity to solve the problem independently.
The example responses at the end of the resource give an indication of the kind of response to expect from students who approach the problem in particular ways.
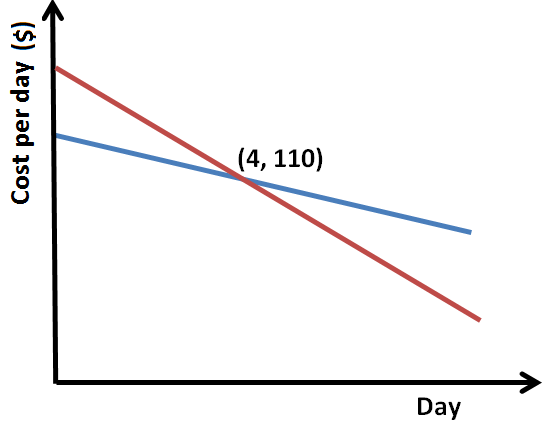
Task: A car rental business has two rental schemes, red and blue for rentals up to ten days. These schemes are advertised in their brochures with this graph.
Use the following information to work out how many days of rental would carry the same total cost on either the blue or the red scheme.
- The area under the graph gives the total cost of renting.
- The schemes each follow a linear pattern, cutting the vertical axis at 120 and 170.
- Both blue and red schemes cost $110 on the 4th day of rental.
The following prompts illustrate how this activity can be structured around the phases of the Mathematics Investigation Cycle.
Make sense
Introduce the problem. Allow students time to read it and discuss in pairs or small groups.
- Do I understand the situation and the graph?
- What information will I need on the graph to make sense of the two schemes?
- Where will I get this information?
- The graphs are linear. What does that tell you about the two schemes?
Plan approach
Discuss ideas about how to solve the problem. Emphasise that, in the planning phase, you want students to say how they would solve the problem, not to actually solve it.
- What representations might be useful to solve this problem? (Graph, table of values, algebraic equations.)
- How will I use these representations to organise the information I am given?
- What mathematics that I know is likely to be useful?
- What features of the graph, table or equations will I use? How will I use those features to answer the question?
- What tools (digital or physical) could help my investigation? (A graphing programme like Desmos or Geogebra will be useful).
Take action
Allow students time to work through their strategy and find a solution to the problem.
- Have I shown my workings in a clear way so someone else can follow them?
- What information have I added to my table or graph?
- How does the information relate to what is provide?
- What features of the graph are most useful? (Student should attend to slope and intercept and possible use those features to create linear equations.)
- What values will I include in my table? How will finding differences help me to recognise patterns and create equations?
- Does my answer seem correct? Does it match my graph or table?
- Is there another possible way to solve the problem, possibly using algebra?
Convince yourself and others
Allow students time to check their answers and then either have them pair share with other groups or ask for volunteers to share their solution with the class.
- What is the solution? Which scheme costs less, or are the costs equal?
- How can I convince someone else that my results are correct?
- Is my working clear for someone else to follow?
- How would I convince someone else I am correct?
- Which ideas or tools worked well in my investigation?
- What could I try differently next time?
- What could I find out next?
- Is there some mathematics that I would like to learn?
- How does this problem relate to other situations in real life?
Examples of work
Work sample 1
The student interprets the graphical information given and uses a tool such as a table, to solve the problem.
Click on the image to enlarge it. Click again to close. 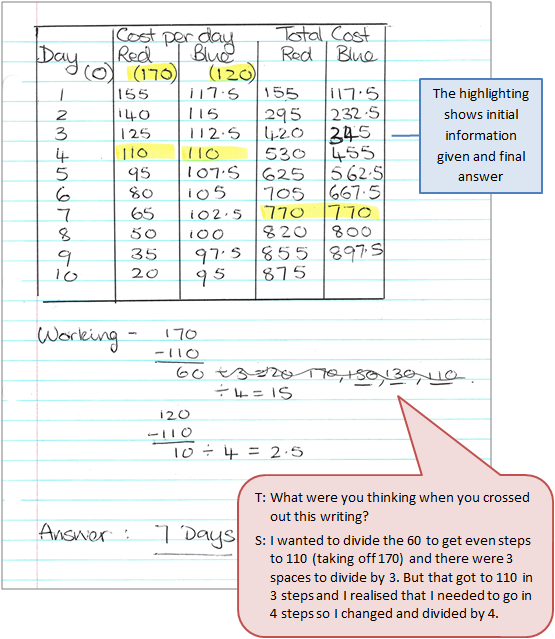
Work sample 2
The student uses algebraic techniques to solve the problem.
Click on the image to enlarge it. Click again to close. 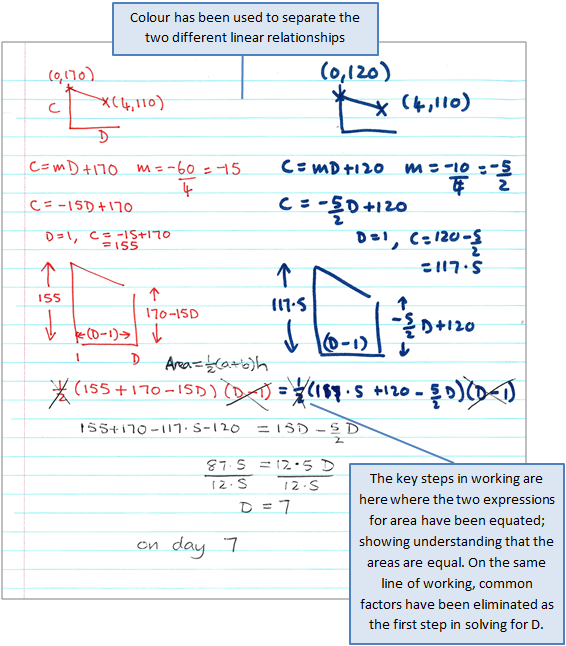
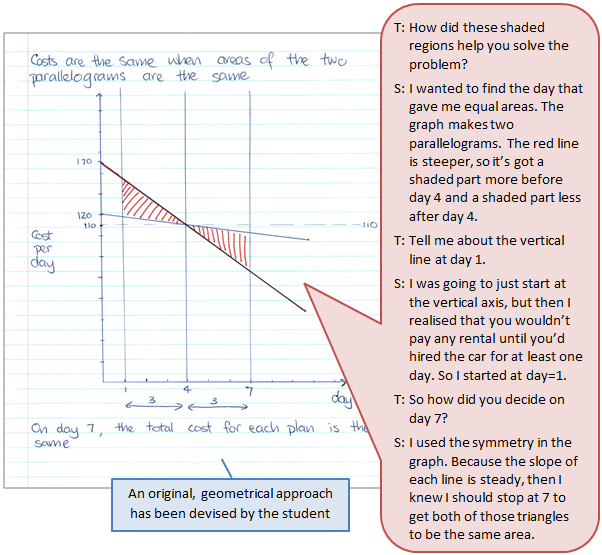
Work sample 3
The student devises an original approach, using mathematical techniques to solve the problem.
Click on the image to enlarge it. Click again to close.