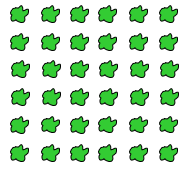
This series of lessons provides different contexts to explore multiplication concepts using arrays such as the one below. This array has 5 rows and 10 columns.

.gif)
Session One: Getting started
- We begin the week with the ‘Orchard Problem’. A picture book about gardens, such as Nana's Veggie Garden - Te Māra Kai a Kui by Marie Munro, could be used to ignite interest in this context.
Jack the apple tree grower has to prune his apple trees in the Autumn. He has 6 rows of apple trees and in every row there are 6 trees. How many apple trees does Jack have to prune altogether?
The start of PowerPoint 1 shows the whole array. Show the complete array. Ask your students to open their eyes and take a mind picture of what they see. Click once to remove all the trees and ask your students to draw what their mind picture looks like. One child could draw their picture on the whiteboard. This could then be referred back to throughout the rest of the lesson.
Look to see if they attend to the rows and columns layout even if the numbers of trees have errors. Discuss the layout.
- Have a pile of counters in the middle of the mat. Ask a volunteer to come and show what the first row of trees might look like. Or get 6 individuals to come forward and act like trees and organise themselves into what they think a row is.
Alternatively click again in the PowerPoint so it’s easy for all to see what the first row of apple trees will look like. Ask your students to improve their picture if they can.
What will the second row look like?
It’s important for students to understand what a row is so they can make sense of the problem. It is also important for them to notice that all rows have the same number of trees. - Arrange the class into small mixed ability groups with 3 or 4 students in each. Give each group a large sheet of paper. Ask them to fold their piece of paper so it makes 4 boxes (fold in half one way and then in half the other way).
- Allow some time for each group to see if they can come up with different ways to solve the Orchard Problem and record their methods in the four boxes. Tell them that you are looking for efficient strategies, those that take the least work.
Allow students to use equipment if they think it will help them solve the problem.
Rove around the class and challenge their thinking with questions like:- How could you count the trees in groups rather than one at a time?
- What facts do you know that might help you?
- What sets of numbers do you know that might help you?
- What is the most efficient way of working out the total number of trees?
- Ask the groups to cut up the 4 boxes on their large sheet of paper and then come to the mat. Gather the class in a circle and ask the groups to share what they think is their most interesting strategy. Place each group’s strategy in the middle of the circle as they are being shared. Once each group has contributed, ask the students to offer strategies that no one has shared yet.
| Likely strategies | Possible teacher responses |
| 1, 2, 3, 4, 5, 6, 7, 8, 9, 10, 11 …. Tahi, rua, toru, whā, rima, ono, whitu, waru, iwa, tekau, tekau mā tahi… | Can you think of a more efficient way to work out how many trees there are? How many trees are there in one row? |
| 6, 12, 18, 24, 30, 36 | Do you know what 6 + 6 =? Or 3 + 3 = ? Can that knowledge help you solve this problem more efficiently? |
| 6 x 6 = 36 | What if Jake had 6 rows of trees and there were 7 trees in each row? |
| 6 + 6 = 12; 12 + 12 = 24; 24 + 12 = 36 | You used addition to work that out. Do you know any multiplication facts that could help? |
2 x 6 = 12; 12 + 12 + 12 = 36 | If 2 x 6 = 12, what does 4 x 6 =? How could you work out 6 x 6 from this? |
| 3 x 6 = 18 and then doubled it | That is very efficient. Could you work out 9 rows of 6 for me using 6 x 6 = 36? |
| 5 x 6 = 30; and 6 more = 36 |
The shared strategies can be put into similar groups.
Who used a strategy like this one?
- Show students PowerPoint 2. The PowerPoint encourages students to disembed a given smaller array of trees from within a larger array. They are also asked to use their knowledge of the smaller array to work out the total number of trees in the larger array. This is a significant ability for finding the totals of arrays using the distributive property of multiplication.
- Provide your students with Copymaster 1. The challenge is to find the total number of trees in each orchard. Challenge your students to find efficient strategies that do not involve counting by ones.
- As a class, share the different ways that students used to solve the Orchard Problems. You might model on the Copymaster to show how various students partitioned the arrays.
Sessions Two and Three: Exploring through work stations
The picture book Hooray! Arrays! by Jason Powe could be used to ignite interest in this learning. In the next two sessions students work in pairs or threes to solve the problems on Copymaster 2. Consider choosing these pairs to encourage tuakana teina through the pairing of more knowledgeable and less knowledgeable students. Enlarge the problem cards and place them at each station. Provide students with access to copies of Copymaster 3 and Copymaster 4 (arrays students can draw on), and physical equipment such as counters, cubes, and the Slavonic Abacus.
Read the problems from Copymaster 2 to the class one at a time to clarify the wording. You may need to revisit the meaning of rows and columns by creating simple examples.
As students work on a station activity, ask them to create a record of their thinking and solutions. The record might be a recording sheet or in their workbook. Note that Part 2 of each problem is open and requires a longer period of investigation.
As the students work watch for the following:
- Can they interpret the problem wording either as a physical representation or as symbolic equations?
- Do they create arrays of equal rows and columns?
- Are they able to use skip counting, additive or multiplicative strategies to find the total number of trees?
- Do they begin to see properties of whole numbers under multiplication? (for example, Apple Orchard Part 2 deals with the commutative property)
At times during both sessions you might bring the class together to discuss confusions or misconceptions, clarify language and share efficient strategies and ways of representing the problems.
Below are specific details related to each problem set.
Orange Orchard
Orange Orchard (Part 1) involves 6 x 8 (or 8 x 6). Students might use their knowledge of 6 x 6 = 36 and add on 12 more (two columns of six). That would indicate a strong understanding of the multiplicative structure of arrays.
Most students will use strategies that involve visualising the array and partitioning the array into manageable chunks (dis-embedding). For example, they might split rows of eight into two fours (6 x 8 = 6 x 4 + 6 x 4), or into fives and threes (6 x 8 = 6 x 5 + 6 x 3). Other students will use less sophisticated strategies such as counting in twos and fives, or a combination of skip counting and counting by ones.
Part 2 is an open task which requires students to identify the factor pairs of 24.
Encourage capable students to be systematic in finding all the possibilities (1 x 24, 2 x 12, 3 x 8, 4 x 6).
Orange Orchard (Part 1) Tame has an orange orchard with 6 rows of trees. In each row there are 8 trees. How many trees does Tame have altogether? Your prediction: Your answer: | Orange Orchard (Part 2) Tame wants to plant another orchard with oranges. He gets 24 trees. Find different ways Tame can plant 24 trees in rows and columns. Show all the different ways. |
Kiwifruit Orchard
Part 1 requires students to coordinate three factors as the problem can be written as 3 x (4 x 5). Multiplication is a binary operation so only two factors can be multiplied at once. Do your student recognise the structure of a single orchard (4 x 5) and realise that the total is consists of three arrays of that size?
Similarly, in Part 2 students must restructure 36 plants into two sets. Do they partition 36 into two numbers, preferably that have many factors? The problem does not say that the two orchards must contain the same number of plants though 18 and 18 is a nice first solution. Once the two sets of plants are formed can your students find appropriate numbers of rows and columns that equal the parts of 36?
Kiwifruit Orchard (Part 1) Lana has three kiwifruit orchards that are the same. In each orchard she has 5 kiwi fruit plants in every row. There are 4 rows. How many kiwi fruit plants does Lana have altogether? Your prediction: Your answer: | Kiwifruit Orchard (Part 2) Lana’s son, Bruce, buys 36 plants to start two Kiwi fruit orchards. How can Bruce arrange the plants into rows and columns? Show different ways. Remember that he must share the 36 plants between two orchards. |
Strawberry Patch
Part 1 is a single array (5 x 12). Students might use the distributive property and solve the problem or 5 x 10 + 5 x 2 (partitioning 12) or 5 x 6 + 5 x 6. Some may re-unitise two fives as ten to create 6 x 10. These strategies are strongly multiplicative. Most students will use smaller units such as fives or two and apply a combination of repeated addition (5 + 5 = 10, 10 + 10 = 20, etc.) or skip counting (2, 4, 6, 8, …).
Part 2 is about factors that have the same product (24). This gives students a chance to recognise that some numbers have many factors and the expressions of those factors have patterns. For example, 6 x 4 and 3 x 8 are related by doubling and halving. The logic behind the relationship may be accessible for some students. If the rows are halved in length, then twice as many rows can be made with the same number of plants.
Strawberry Patch (Part 1) Hera has a strawberry patch. There are 5 rows with 12 strawberry plants in each row. How many strawberry plants does Hera have altogether? Your prediction: Your answer: | Strawberry Patch (Part 2) Sam, Kim and Toni also have strawberry patches. Sam has 6 rows with 4 plants in each row. Kim has 3 rows with 8 plants in each row. Toni has 2 rows with 12 plants in each row. Who has the most strawberry plants, Sam, Kim or Toni? |
Apple Orchard
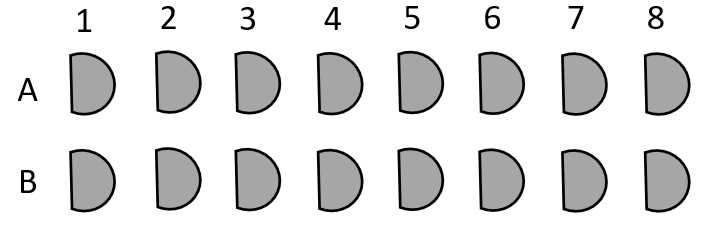
Part 1 gives students a chance to ‘discover’ the commutative property, the order of factors does not affect the product. In this case 5 x 10 = 10 x 5.
Part 2 applies the distributive property of multiplication though many students will physically solve the problem with objects. Look for students to notice that 12 extra trees shared among six rows results in two extra per row. So, the number of rows stays the same, but the rows increase in length to six trees. Similarly, if more rows are made the 12 trees are formed into three rows of four. The number of rows would then be 9. 6 x 6 and 9 x 4 are the possible options.
Apple Orchard (Part 1) Fatu’s apple orchard has ten trees in each row. There are five rows. Min’s apple orchard has 5 trees in each row. There are ten rows. Who has more apple trees, Fatu or Min? Your prediction: Your answer: | Apple Orchard (Part 2) Besma has six rows of apple trees. Each row has four trees. If she plants 12 more trees, how many rows might she have then. How many trees will Besma have in each row? There are two answers. Show both answers. |
Sessions Four and Five
Sessions Four and Five give students an opportunity to recognise the application of arrays in other contexts.
The chocolate block problem involves visualising the total number of pieces in a block even though the wrapping is only partially removed. PowerPoint 3 provides some examples of partially revealed chocolate blocks. For each block ask:
- How many pieces are in this block?
- How do you know?
Look for students to apply two types of strategies, both of which are important in measurement:
Iteration: That is when they take one column or row and see how many times it maps into the whole block.
Partitioning: That is when they imagine the lines that cut up the block, particularly halving lines. They look to find a partitioning that fits the row or column that is given.
Copymaster 5 provides students with further examples of visualising the masked array.
The Kapa Haka problem is designed around the array structure of seating arrangements for Kapa Haka performances at school.
Begin by role playing the Kapa Haka problem. Use chairs to make a simulated arrangement of seats. You might like to include grid references used to locate specific seats.
Try questions like:
- How many rows are there? How many columns are there?
- How many audience members could be seated altogether?
- If the performance needed 24 seats what could they do?
Use different arrangements of columns and rows.
Give the students counters, cubes or square grid paper to design possible seat layouts with 40 seats. Encourage them to be systematic and to look for patterns in the arrangements. Some students will find efficient ways to record the arrangements such as:
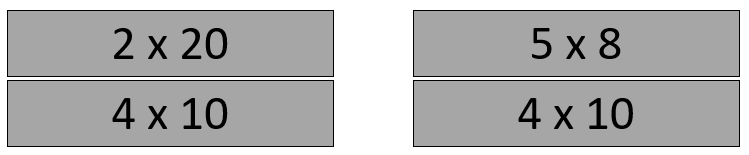
2 rows of 20 seats 4 rows of 10 seats 5 rows of 8 seats
Record these possibilities as multiplication expressions on rectangles of card. Put pairs of cards together to see if students notice patterns, like doubling and halving.
It is important to also note what length rows do not work.
- Could we make rows of 11 sets? 9 seats? Why not? (40 is not divisible by 11 or 9 as there would be remaining seats left over)
If students show competence with finding factors, you could challenge them to find seating arrangements with a prime number of seats such as 17 or 23. They should find that only one arrangement works; 1 x 17 and 1 x 23 respectively.
Reflecting
As a final task for the unit, ask the students to make up their own array-based multiplication problems for their partner to solve.
- Tell the students that they are to pretend to be kūmara growers. They decide how many rows of kūmara plants they want in each row and how many rows they will have altogether. As part of this learning, you could look into how early Maori people grew kūmara. This plant arrived in New Zealand with Polynesian settlers in the 13th Century. However, the climate here was much colder than the Polynesian islands. As a result, the kūmara had to be stored until the weather was warm enough for it to grow. The kūmara plant became even more important once settlers discovered that some of their other food plants would not grow at all in New Zealand’s climate. These kūmara were different to the ones we eat today - which came to us from North America. The books Haumia and his Kumara: A Story of Manukau by Ron Bacon, and Kumara Mash Forever by Calico McClintock could be used to engage students in this context.
- Then they challenge their partner to see if the partner can work out how many kūmara plants they will have altogether.
- Tell the students to create a record of their problem with the solution on the back. The problems could be made into a book and other students could write other solution strategies on the back of each problem page.
- Conclude the session by talking about the types of problems we have explored and solved over the week. Tell them that the problems were based on arrays. Let them know that there are many ways of solving these problems, tough multiplication is the most efficient method. Ask students where else in daily life they might find arrays.

Mathematical magic
This unit provides you with a range of opportunities to assess the entry level of achievement of your students.
This unit can be differentiated by altering the difficulty of the tasks to make the learning opportunities accessible to a range of learners. For example:
Some of the activities in this unit can be adapted to use contexts and materials that are familiar to students. For example:
Counting and colours in te reo Māori could be introduced in this unit and used throughout other mathematical learning.
Prior Experience
It is expected that students will have a range of prior experiences working with numbers, geometric shapes, measurement, and data. Students are expected to be able to use simple addition and subtraction in situations where sets are joined, separated, and compared.
Session One
Talk to your students about the purpose of the unit, which is to find out some information about them, so you can help them with their mathematics. In the first session students explore a ‘magic trick’ about dice and extend what they find to develop their own magic trick. Look for your students to generalise, that is, explain why the method works every time.
Dice Faces
Card Sums
In this example below only 5 is odd so the total is 20 + 1 = 21.
Note that students may find variations on a general rule:
The highest sum possible is 25, if all the odd numbers show up. Each time an odd card is turned over one is lost from the sum. The even number is always one less than the odd number. If you see how many even numbers there are you take that number from 25. For example, below there are three even cards, 0, 2, and 8, so the sum is 25 – 3 = 22.
Possible extension:
Suppose you wanted to make the trick look even more impressive by making 10 cards; 0-1, 2-3, 4-5, …,16-17, 18-19.
How could you work out the total without adding all the numbers then?
Session Two
In this session, the theme of mathematical magic is continued as students look for patterns in the place value structure of 100. Begin with a Slavonic Abacus and a Hundreds Board.
Slavonic abacus
Does the student use the tens and ones structure of the abacus or attempt to count in ones?
How many beads are on the whole abacus? How do you know?
If 45 beads are on the left side, how many beads are on the right side?
You might revisit the fact that five tens are fifty. Fifty mean five-ty or five tens.
(Student A), please move some of my kiwi to the left side and cover up the rest so I cannot see them (using an A4 sheet of paper).
Crosses Pattern
In this task students apply place value to explain why a pattern on the hundreds board works every time.
2 + 22 = 24 (top and bottom numbers) and 11 + 13 = 24 (left and right numbers).
Possible extension:
Any square on the hundreds board is magic. The numbers along each axis have the same sum. Why?
Below 12 + 23 + 34 = 69, 13 + 23 + 33 = 69, 14 + 23 + 32 = 69, 22 + 23 + 24 = 69.
Hopefully more able students can see that this works for the same reason that the cross pattern works. For each line, the sum is three times the centre number, with one of the end numbers the same amount more than that number as the other is less.
Other units that will support the development of Place Value at level 2 include:
Session Three
In this session students explore simple two-dimensional dissections in which a shape is cut up into smaller pieces and those pieces are put together to form a different shape. They will need square shaped pieces of paper or card.
Copymaster 1 contains the target shapes. Either provide students copies of the Copymaster or display it on screen. Ask the students to work out how to form each shape using all the pieces from the square. Look for your students to:
Copymaster 2 has some target shapes that can be made by connecting all four pieces. Challenge your students to make each target, record the solution, and make up their own target for someone else in the class. Be aware of the need to check for uniqueness. Is the target really the same as another? This brings in ideas about reflection and rotation.
Can you use these four pieces to create a hexagon?
Session Four
In this session students consider the likelihood of magic happening. Students will consider whether the trick is really magic or if something else is involved.
Am I magic or is something else going on?
Their beliefs might be deterministic: "You are a teacher, so you are clever."
Some beliefs might acknowledge chance: "There are only two cups. You have a good chance of being right each time."
A student might spot that the cups are marked. If not, reveal the trick to them.
Magicians like to disguise their tricks so the two cups might be a bit simple. Let’s try the same idea but have three cups and one treat. Can you figure out a way to get a treat each time?
S: I always choose the position where a treat didn’t go at first.
T: Did that always work? Did anyone else try that idea? What happened? Why do you think that happened?
Other students might always choose a position where a treat was first located, or randomly select a position.
Extend the activity:
You might extend the task by varying the number of cups and treats, e.g. four cups and one, two, or three treats.
Session Five
In this session, students look for repeating patterns and connect elements in the pattern with ordinal numbers.
Let students create their own patterns. Look for students to:
Extend the activity:
There are many ways to increase the difficulty of repeating pattern prediction:
Dear parents and whānau,
For the first week of school our mathematics unit is about mathematical magic. We will investigate number tricks, magically change a square into other shapes, predict the future of a pattern, explain and justify why things work.
Ask your child about their magical abilities and have them share some of the magic tricks they have done in class with you.
Pirate plays
In this unit we explore the size of a metre and develop our own ways to estimate a metre length.
When ākonga can measure lengths effectively using non-standard units, they are ready to move to the use of standard units. The motivation for moving to this stage often follows from experiences where ākonga have used different non-standard units for the same length. They can then appreciate that consistency in the units used would allow for the easier and more accurate communication of length measures.
Measurement experiences must enable ākonga to:
The usual sequence used in primary school is to introduce non standard measures followed by standard measures; the centimetre first, then the metre, followed later by the kilometre and then millimetre.
The centimetre is often introduced first because it is small enough to measure common objects. The size of the centimetre unit can be established by constructing it, for example by cutting 1-centimetre pieces of paper or straws. Most primary classrooms also have a supply of 1-cm cubes that can be used to measure objects. An appreciation of the size of the unit can be built up through lots of experience in measuring everyday objects. Ākonga should be encouraged to develop their own reference for a centimetre, for example, a fingertip.
As ākonga become familiar with the size of the centimetre they should be given many opportunities to estimate before measuring. After using centimetre units to measure objects, ākonga can be introduced to the standard ruler (30cm). It is a good idea to let ākonga develop their own ruler to begin with. For example, some classrooms have linked cubes which can be joined to form 10 cm rulers. Alternatively pieces of drinking straw could be threaded together.
The correct use of a ruler to measure objects requires specific instruction. The correct alignment of the zero on the ruler with one end of the object needs to be clarified.
Metres and millimetres are established using a similar sequence of experiences: first construct the unit and then use it to measure appropriate objects.
This unit can be differentiated by varying the scaffolding provided or altering the difficulty of the tasks to make the learning opportunities accessible to a range of learners. For example:
The context for this unit can be adapted to recognise diversity and student interests to encourage engagement. For example, the unit could be focused around the journeys of Pasifika and Māori peoples to Aotearoa, by including activities that make use of non-standard measures to standard measures. For example, how did Māori know how long or wide their wharenui had to be without any standard measures or the length of their new waka or how long their journey to another marae might be. Ask ākonga what they think are the advantages and disadvantages of non standard measures.
Te reo Māori vocabulary terms such as inea (to measure), mitarau (centimetre), and mita (metre) could be introduced in this unit and used throughout other mathematical learning.
Session One
Begin the session by acting out the following scene with your class (mahi tahi model).
Characters:
Captain Kaiwhakaako - teacher
Crew - ākonga
Props:
Treasure - a small box
Crooked palm tree - desk
Captain Kaiwhakaako, the pirate, decided to bury their treasure.
They started from the crooked palm tree and carefully counted 12 steps, (heel, toe) and then stopped and placed the treasure on the ground.
To make sure that they remembered where they left it, they wrote down on their map - 12 steps.
He wanted to make really sure that he had measured correctly before digging the hole so he asked a cabin boy or girl to check.
Captain Kaiwhakaako was puzzled. How could the crew member have a different number of steps?
Had they made a mistake?
Can you think of a measure that Captain Kaiwhakaako could use that is the same for everyone?
If ākonga come up with the suggestion of a metre, ask:
How long is it?
When and where is used as a measurement?
Session two
Tell ākonga that Captain Kaiwhakaako has decided that now they know what a metre is, they want to start drawing up plans for their new pirate ship and that they would like the crew to help.
Discuss with ākonga the type of boats that pirates sailed in. This could include discussion about waka and waka ama (outrigger canoe).
Provide them with chalk and a metre measure and take them outside to draw the boat to Captain Kaiwhakaako requirements.
A metre is as high as …………….(my ribs).
How wide is a metre? A metre is from my fingertips to ……………
Session three
Check how ākonga position the shapes when measuring.
Do they begin from the same baseline?
Do they use the measuring unit consistently without gaps or overlapping?
Ākonga can show their results by pasting their outlines on to paper and recording the number beside it.
Captain Kaiwhakaako has gone to a boat shop to buy some new canvas for sails. They want two metres. Can you show me using a body measurement how long two metres would be?
Session four
If 1cm cubes that connect are available join 100 using two different colours to distinguish the decades. Place the line of cubes on top of the metre ruler and count in tens to 100.
Provide ākonga with string, scissors and glue and let them investigate the different ways of creating patterns with 1 metre of string. Ākonga can first measure a metre, and then make a pattern.
Discuss that different patterns look as though they have different lengths.
Session five
Captain Kaiwhakaako has decided to have a sports day for the pirate crew. The events for the day are:
You could adapt this session to include games you have played as a class that involve throwing, kicking, jumping, and tossing. The key learning is estimating and measuring in metres. At each station, ākonga need to estimate how far they will kick/jump/throw/toss in metres, and then measure the actual distance covered.
Dear family and whānau,
We have been busy this week doing lots of measuring using metres. We have found out how many of our handspans equal a metre so that we can estimate lengths. We have also used our metre measuring strings to measure distances around the classroom.
Measuring Strings
Use your measuring strings to measure these distances in metres:
If you walked 10 metres from your letterbox where could you end up? Draw a map showing this.
Figure It Out Links
Some links from the Figure It Out series which you may find useful are:
Picasso
This unit uses the context of Picasso's art to explore two and three-dimensional shapes, to recognise their features, and to develop appropriate language to discuss Picasso's and their own artworks.
In level one, students have been learning to name some common shapes, becoming familiar with their features. As students are given opportunities, they find their own systems for sorting shapes, justifying their categories and developing the important geometric language of attributes.
Initially, students come to understand two-dimensional shapes as flat or plane shapes that have two dimensions. They have length and width but no depth, and therefore, technically, cannot be ‘held’. As they work with three-dimensional shapes, they come to understand the way in which two-dimensional plane shapes build three-dimensional shapes. Students need to have a clear understanding of the meaning and concept of ‘dimensions’ and should be able to explain in their own words what the abbreviations 2D and 3D mean. The change in language from ‘sides and corners’ for two-dimensional shapes, to ‘faces, edges and vertex/vertices’ is not an insignificant one. The language itself conveys the shape category and should be emphasised and subsequently well understood.
As students work with physical shapes they need to have opportunities to come to understand the defining characteristics of the shapes. Having them talk about and explain these characteristics within a particular learning context, consolidates conceptual understanding. The representation of three-dimensional shapes in the two-dimensional medium that a painted artwork is, creates its own challenge and interest. It should involve deconstructing 3D shapes and recognising that they are comprised of 2D plane shapes. This is a key understanding to be developed at this level.
In levels 3 and 4 students are challenged to explore and represent objects from different viewpoints and perspectives. The work in this unit of work is a useful precursor to developing these concepts.
Picasso's cubist art provides a useful context for the exploration of two and three dimensions as well as developing recognition in the students of the importance of shape as fundamental structure of art itself.
Associated Achievement Objectives
Art
Visual Arts
This unit can be differentiated by varying the scaffolding provided or altering the difficulty of the tasks to make the learning opportunities accessible to a range of learners. For example:
The contexts in this unit can be adapted to recognise cultural diversity and encourage engagement. For example, in addition to the works of Picasso, students could respond to cubist works from New Zealand artists. New Zealand artists that include elements of cubism in some of their work include:
Te reo Māori vocabulary terms such as mata (face), tapa (edge), akitu (vertex) and matahuhua (cubism) could be introduced in this unit and used throughout other mathematical learning.
Whilst this unit is presented as a sequence of five sessions, more sessions than this may be required. Any session may extend beyond one teaching period. This unit is written to focus on the work of Pablo Picasso, who co-founded the cubist movement. You may prefer to focus the activities on similar works by New Zealand artists.
Session 1
This session is about naming and describing plane (2D) shapes, and using these to create a picture. Note: By drawing around the shape ākonga are creating a two-dimensional shape. Limit the colour selection, as this is relevant to the work in a later lesson.
SLOs:
Activity 1
Make geometric blocks available to pairs of ākonga (tuakana/teina).
Begin by having individual ākonga sort a selection of the geometric blocks into groups, and explain to their partner the groupings they have made. Have them repeat the sorting task, this time categorising them differently.
Encourage and affirm appropriate geometric language, including the correct use of shape names and descriptions of their features.
Activity 2
As a class (mahi tahi), brainstorm and record on the class chart, all shape and attribute language associated with the task in Activity 1.
Activity 3
Make paper, pencils, and pastels or crayons available, but limit the colour selection.
Challenge ākonga to make a picture of a person, object or place that is important to them. Explain that they are to make their picture using the shape blocks to help them.
Demonstrate how to begin the picture by drawing around several shapes and then colouring in the outline. For example:
Explain why your picture is important to you. (For example: ‘My Dad used to drive an old blue car a bit like this one.’)
Activity 4
Have ākonga make and complete their own pictures. When pictures are complete, have each ākonga name their picture, write a short story about it, using words from the brainstorm list in Activity 3. Their story should explain why the subject of the picture is important to them and how they made their picture. This activity could be integrated with explicit writing instruction (e.g. explanation writing).
Activity 5
Refer to the example picture made in Activity 3 above and to the artworks they have just completed.
Ask: “Are the shapes two-dimensional shapes or three-dimensional shapes?” Discuss ideas.
Write the word ‘dimension’ and 2D below the picture.
Ask ākonga to discuss in pairs the meaning of what has been written.
Through discussion, develop understanding of the meaning of the word ‘dimension’, of two dimensions and of the abbreviation, 2D.
Highlight the shapes that they have drawn are like (foot) prints only. They are wide and long, but not deep. Explain that two-dimensional shapes have no depth or thickness.
Activity 6
Discuss, conclude and record that the geometric blocks are 3D shapes because they have width, length, and thickness (depth), and we can feel these. Recognise that the geometric block shapes have different thickness or depth.
Activity 7
Invite ākonga to share their art works and stories. Conclude by writing on the class chart, ‘We used two-dimensional shapes to make our artworks today.’
Session 2
This session is about choosing and responding to a piece of Picasso’s artwork.
SLOs:
Activity 1
Have several ākonga share with the class their art stories from Session 1, Activity 3.
Acknowledge ākonga as artists.
Activity 2
Explain that you have a true story to tell about another artist. Read Attachment 1: Picasso. (Omit the quote in the box).
Ask ākonga what they found most interesting in the story.
Record their ideas on the class chart, summarising their learning about Picasso.
Activity 3
Write on the class chart: “Art is a lie that makes us realise the truth.” Explain this is something Picasso said. Have ākonga discuss what he might mean by this.
Elicit ideas: for example, art does not always show us how things really are (“they lie”) but we recognise this by comparing art with how things are ("the truth").’
Activity 4
Explain what you have done. You do not need to elaborate on cubist art at this stage, it will be discussed in Session 3 and 4.
Have ākonga glue their chosen picture onto their paper, leaving sufficient space to write about it.
Remind the ākonga that in Session 1 they wrote about their own artworks.
Explain that each ākonga is to write about the Picasso picture they have chosen.
Their writing should:
Activity 5
Ākonga take turns to talk about the way Picasso uses shapes in his pictures, including identifying the features of those shapes. For example: In Picture 1, triangles with lots of corners (angles) have been used.
Activity 6
Conclude the session by encouraging ākonga to share their writing about Picasso’s artwork.
Session 3 and 4
This session is about exploring the features of a three-dimensional shape. Ākonga recognise that a 3D shape is comprised of plane shapes, and represent 3D shapes in an artwork.
SLOs:
Activity 1
Begin by having more ākonga read their Picasso artwork stories from session 2.
Activity 2
Have ākonga form pairs with their Picasso artworks. Partners should have different pictures.
Write on the class chart the headings: Colour Shape Other
Have ākonga write these headings on one shared piece of paper. Set a time limit.
Have ākonga look at both Picasso pictures and record on the chart under the three headings the things they notice about both art works.
Discuss as a class, highlighting (in most instances) the narrow range of colours, light/dark contrasts, different angles of geometric shapes.
Activity 3
On the class chart, write cube and list its features, including the number of faces, edges and vertices. Highlight that we can view a cube from different angles.
Write cubism on the class chart. Explain that it is a name for an art style that Picasso is famous for. Have ākonga suggest what this might be and record their ideas/definitions on the class chart.
If required, complement ideas with these points:
Cubism:
Talk about each of these, having ākonga find and discuss examples in their artworks in front of them.
Activity 4
Make available at least one copy of Attachment 3 per ākonga, scissors, glue, A4 paper, pencils, crayons/pastels.
Explain that their completed artwork should:
Cut out one cube shape from Attachment 3. Discuss this with reference to the wooden cube, highlighting that this is a way of capturing a 3D shape in art.
Cut the cube (or cuboid) picture into its component parts. It is important for ākonga to understand the differences and similarities between cuboids and cubes - a cube is a cuboid with all edges the same length.
Recognise and discuss the squares (and rectangles) that result. These are the 2D shapes that make up the 3D shape.
Look at the parallelogram shapes. Discuss that this is what happens to the square and rectangular faces when they are shown in 2 dimensions.
For example: a plant (leaf) may be something important to the artist.
This can be cut and arranged alongside some shapes to produce the artwork.
Activity 5
Ākonga can now begin their artworks. Ask them to stop and review progress throughout, reflecting on their own work and giving feedback to others.
Activity 6
Finish artworks with a title.
Session 5
This session is about reflecting upon and consolidating the key learning about 2D and 3D shapes and about one artist.
SLOs:
Activity 1
Ākonga can display their cubist art (including titles) on their desks. Explain that ākonga will undertake a slow and silent art-walk in which they are to notice works they particularly like. They should look closely at these and decide what it is that makes them appealing to them personally. The two stars and a wish feedback structure could be used here. That is, ākonga should give two positive comments and a suggestion for improvement to another ākonga.
Activity 2
Have several ākonga share their ideas and feedback on the artwork they have noticed, explaining what they like about it and why. Have them refer to the artwork criteria when making their comments.
Activity 3
Make available poster paper large enough to accommodate ākonga artworks from Session 1 and Session 4, Activity 5.
Have each ākonga place (and glue) both artworks onto the poster paper, leaving sufficient space to attach a reflective comment.
Activity 4
On writing paper, have ākonga:
a. Write which of their own artworks they prefer, writing 2-3 reasons for their preference.
b. Explain what they have learned about geometric shapes through their exploration of Picasso’s art and of cubism.
c. Attach their reflections to their poster paper beneath their artworks.
Activity 5
Recognise that the artworks do not show things as they are, but they helped us to see some things that are true.
On the class chart list the ‘true’ things (truth) that ākonga have learned about art and about mathematics (geometry).
Activity 6
Conclude the session by sharing some of your own favourite Picasso artworks. Discuss the fact that shape is a feature of much of his work.
Dear family and whānau,
In maths we have been exploring two-dimensional and three-dimensional geometric shapes. We have also been learning about Picasso and cubism, and have made some artworks of our own.
We would really like you to visit our classroom art gallery, either in person or online. You are invited to write your comments and feedback in our art visitors’ book or as a comment on the post.
We look forward to hearing what you think.
Cuisenaire mats
In this unit ākonga use Cuisenaire rods to make 'number mats' that illustrate a variety of numerical patterns and can be visually appealing. Ākonga formally record the number relationships in the mat. This unit is based on the assumption that the small white cube is one. There are many ways Cuisenaire rods can be utilized without naming the white rod as one.
It is important for ākonga to know the meaning of the equality sign. Realising that '=' indicates that the two expressions on either side of it are equal, is a key step on the road to algebra. These two expressions have the same status - one does not have to be the 'answer' to the other.
This idea is fundamental to algebraic understanding at later levels. It is introduced here with a geometric technique that links numbers via Cuisenaire rods.
This unit could be repeated at a higher level by assigning a value other than 1 to the white rod.
Links to Numeracy
This unit provides an opportunity to develop the number knowledge of ākonga in the context of Grouping and Place Value. It also provides a way to develop early part-whole thinking in the addition and subtraction domain, as it allows ākonga to clearly see the different ways a number can be partitioned.
To develop ākonga knowledge of groupings within 5 and 10, focus the attention of ākonga on the 5-mat and the 10-mat. For example,
Can you find 2 numbers that join together to make 10 on the 10-mat?
Can you find two different numbers?
How many different combinations can you find?
List the combinations as they are identified. Encourage ākonga to see the relationships between the two addends: as one increases, the other decreases. This is illustrated using the Cuisenaire mats:
This unit can be differentiated by varying the scaffolding provided or altering the difficulty of the tasks to make the learning opportunities accessible to a range of learners. For example:
Refer to the list of ‘possible extensions for Levels 3 and 4’ at the end of the unit for further suggestions of ways in which this unit can be adapted to Levels 3 and 4.
This unit is focussed on making visual representations of number combinations, and as such is not set in a real world context. You may wish to explore real world applications of number combinations in the teaching sessions following the unit, for example ākonga could discuss waka ama with a defined number of seats, with coloured shirts to represent number patterns. For example in a 5-waka, there can be 3 red and 2 blue shirts (3 + 2), 4 red and 1 blue shirts (4 + 1), or 3 red, 1 blue and 1 green shirts (3 + 1 + 1).
Te reo Māori vocabulary terms such as rākau Ātaarangi (Cuisenaire rods) and tau (number), as well as te reo Māori for the colours of the rods and numbers tahi ki tekau (one to ten), could be introduced in this unit and used throughout other mathematical learning.
If they are available, magnetic cuisenaire rods which stick onto a whiteboard are very useful.
Search for “online fractions modelling with cuisenaire rods” to find websites that can be used to make number mats with Cuisenaire rods.
Getting Started
Here the concept of a 5-mat is introduced. It is constructed from combinations of Cuisenaire rods that all have the same length as the yellow rod (5). The 5-mat is a device to help ākonga explore equality of combinations of numbers. It also helps them to see that '=' means 'is equal to'.
When Cuisenaire rods are exactly made in units of 1 cm, some ākonga may also be able to check the length by measuring.
Draw a clearly labelled diagram on the whiteboard or as a poster, for reference.
Ākonga can then suggest the number combinations demonstrated by the 5-mat on the board. The 5-mat above has:
4 + 1
2 + 3
1 + 1 + 1 + 1 + 1
or 5 x 1
= 5
= 5
= 5
= 5
Exploring
Here the concept of 'equal' is explored further using mats of different sizes.
Note that 4 x 3 is interpreted as 4 groups of 3 here and not 3 groups of 4.
Did anyone else find something like this?
Is 4 + 8 = 8 + 4? Why?
Did anyone else find something like this that did NOT work?
Did anyone else find something like this?
Is 2 x 6 = 6 x 2? Why?
Did anyone else find something like this that did NOT work?
Rows that show a strong visual pattern may also show interesting number patterns.
Make me a mat that shows that 4 + 7 = 2 + 9.
What other equalities can a mat like this show?
Make me a mat that shows that 2 x 5 = 3 + 7.
What other equalities can a mat like this show?
Let ākonga pursue this aspect of the problem in pairs, independently or in small groups. Rove and support ākonga as necessary.
Reflecting
This section brings together what ākonga have discovered so far.
Is it true that 2 x any number = that same number x 2? Why? Why not?
Possible extensions for Levels 3 and 4
This unit can be extended for ākonga working at Level 3 or Level 4.
? + 1 + 5 = 12; and
? + 1 + 5 = 3 x 4.
Answering this could lead to a statement such as 5 x 3 + 1 = 16.
Use a mat to check whether 2 x 5 + 4 = 6 + 1 + 7 or 5 + 3 x 4 = 7 + 9.
Dear parents and whānau,
This week in maths we have been using coloured Cuisenaire rods to make 'number mats' which help to show that the equal sign '=' says that the numbers on either side of it are the same. Here is an example of a 12-mat. The white rod = 1, the red = 2, the green = 3, the pink = 4 and so on. Each line of colours = 12.
Looking at the green and pink rows, this shows 3 + 3 + 3 + 3 = 4 + 4 + 4. This can be read as 3 + 3 + 3 + 3 is the same as 4 + 4 + 4. Talk with your child about what other equations can be written using the 12-mat.
Figure it Out Links
A link from the Figure It Out series which you may find useful is:
Parties and favourites
In this unit we conduct a number of investigations using a party or favourites as a theme. Ākonga count, compare, organise, analyse, display and interpret data.
At Level 2 you can expect ākonga to be posing (with teacher support) a greater range of questions, including investigative questions and survey questions. They will also begin to understand some of the issues involved in conducting surveys and learn new methods for collecting data. While at Level 1 ākonga collected data and chose their own ways to display their findings, at Level 2 they will be introduced to pictographs, tally charts and bar graphs. More emphasis here will also be placed on describing the data and the making of sensible statements from both the ākonga own displays and the displays of others.
Investigative questions
At Level 2 ākonga should be generating broad ideas to investigate. The teacher supports ākonga to refine their ideas into an investigative question that can be answered with data. Investigative summary questions are about the class or other whole group. The variables are categorical or whole numbers. Investigative questions are the questions we ask of the data.
The development of investigative questions is led by the teacher. Questioning of ākonga, leads to the identification of the variable of interest, and the group the investigative question pertains to. Ultimately, the teacher forms the investigative question with ākonga input.
Survey questions
Survey questions are the questions we ask to collect the data to answer the investigative question. For example, if our investigative question was “What ice cream flavours do ākonga in our class like?” a corresponding survey question might be “What is your favourite ice cream flavour?”
As with the investigative question, the development of a survey question is led by the teacher. Purposeful questioning of ākonga leads to the collaborative development of suitable survey questions.
Analysis questions
Analysis questions are questions we ask of displays of data as we start to describe it. Questions such as: What is the most common? What is the least common? How many of a certain category? What is the highest value (for numerical data)? What is the lowest value (for numerical data)?
Pictograph
In a pictograph, the pictures are drawn on uniform pieces of paper. This means that the number of objects in each category now bears a direct relationship to the size of each category on the display. An example is shown in the diagram below.
In a further development the pictures can be displayed on a chart with axes and titles. The vertical axis can be numbered to match the pictures.
Bar Graph
In a bar graph equal-width rectangles (bars) represent each category or value for the variable. The height of these bars tells how many of that object there are. The bars can be vertical, as shown in the example, or horizontal.
The example above shows the types of shoes worn in the class on a particular day. There are three types of shoes: jandals, sneakers, and boots. The height of the corresponding bars shows that there are six lots of jandals, 15 lots of sneakers and three lots of boots. It should be noted that the numbers label the points on the vertical axis, not the spaces between them. Notice too, in a convention used for discrete data (category and whole number data), there are gaps between the bars.
Tally Chart
A tally chart provides a quick method of recording data as events happen. If ākonga are counting different coloured cars as they pass the school, a tally chart would be an appropriate means of recording the data. Note that it is usual to put down vertical strokes until there are four. The fifth stroke is drawn across the previous four. This process is continued until all the required data has been collected. Tallying enables the number of objects to be recorded and counted quickly and efficiently (i.e. by skip counting in fives)
In the example above, in the time that we were recording cars, there were 11 red cars, four yellow cars, 18 white cars and five black ones and 22 cars of other colours. Microsoft Excel and Google sheets can be used to enter data into spreadsheets, analyse data, and create graphs. CODAP – Common Online Data Analysis Platform, is an online statistical tool that is accessible from a young age.
The learning opportunities in this unit can be differentiated by providing or removing support to ākonga and by varying the task requirements. Ways to support ākonga include:
The context for this unit can be adapted to suit the favourites of your ākonga. Other possible contexts for this learning might be:
Te reo Māori vocabulary terms such as tuhuru (investigate) and pātai (question) could be introduced in this unit and used throughout other mathematical learning.
Session 1: Balloons investigation
Today we will make a pictograph of our favourite balloon shapes. We are going to answer the investigative question “What different balloon shapes do the ākonga in our class like?”
How many ākonga liked long wiggly balloons?
How many ākonga liked long straight balloons?
How many ākonga liked long balloons altogether?
How can you add the numbers together?
How many ākonga liked balloons that were not long?
How many more ākonga liked long wiggly balloons than long straight balloons? All ākonga counting methods should be valused in this activity. However, it may be appropriate for you to (model and reinforce the use of subtraction or addition, rather than counting on or back.)
Try to find analysis questions that will allow ākonga to use strategies such as near doubles and adding to make 10s.
Session 2: Birthday Party investigation
This birthday party investigation is described in full as a possible model for teaching and developing ideas for each of the stages of the statistical enquiry cycle at Level 2. In New Zealand we use the PPDAC cycle (problem, plan, data, analysis, conclusion) for the statistical enquiry cycle. You can find out more about the PPDAC cycle at Census At School New Zealand.
If the birthday party context is not suitable for your ākonga, choose another context (e.g. Diwali, matariki). The process described here will work for other contexts.
PROBLEM: Generating ideas for statistical investigation and developing investigative questions
Using the starter “I wonder…” Ask the ākonga what they wonder about birthday parties. Record their ideas. For example:
I wonder…
The amount of work needed to tidy up the investigative questions will depend on the responses of your ākonga in the brainstorming session. New Zealand based research has identified six criteria to support the development of and/or critiquing of investigative questions. These criteria are used in the example below. The teacher asks questions of ākonga to identify the information needed e.g. variable, group and with this information develops the investigative question.
For the favourite kai at a birthday party example some possible questions are:
For each of the ideas generated in part 1, possible investigative questions are:
Each group selects one of the investigative questions to explore.
PLAN: Planning to collect data to answer our investigative questions
Explain that these questions are called survey questions and they are the questions we ask to get the data. Work with groups to generate survey questions. For example:
Possible survey questions are:
DATA: Collecting and organising data
ANALYSIS: Making and describing displays
CONCLUSION: Answering the investigative question
At the end of the session get each group to share their chart. They should state their investigative question and then the answer to the investigative question. The answer should draw on the evidence from their graph and their “I notice…” statements.
For example: What are some favourite birthday cake flavours for children in Room 30?
Answer: The most popular birthday cake flavour for Room 30 is chocolate cake. 15 ākonga in our class had chocolate as their choice. The other flavours that were liked included carrot cake, banana cake and ice-cream cake. Carrot cake was the least popular cake flavour for Room 30.
Extending: If I (the teacher) was to make a cake for the class what flavour should I make?
Session 3: Popcorn
The previous session involved the full PPDAC cycle. In this session today we are going to look at using tally marks to record the number of pieces of popcorn in a small cup and a bar graph to display the data. We are focusing on the data collection and analysis phases.
What was the most common number of pieces of popcorn?
What was the least common number of pieces of popcorn?
How many more pieces of popcorn were there in the cup with the most, than the one with the least?
How many pieces of popcorn did each table group count?
Discuss strategies for adding the numbers together (for example: combine the numbers that add to 'tidy' numbers; use place value; use doubles or near doubles).
Session 4. Favourites
In this session we will undertake a statistical investigation using the idea of favourites as our starting point. The big ideas for the investigation are detailed in session 2. Ideas to support the specific context are given here.
PROBLEM
Brainstorm with ākonga different things that they have a favourite of. You might use the starter “I wonder what are favourite _________ for our class?”
Using the ideas developed previously, identify 10-15 favourites to be explored and develop investigative questions for pairs of ākonga to explore. A tuakana/teina model could be used here.
Investigative questions might be:
PLAN
As ākonga have had some practice with planning previously, allow them some freedom, as appropriate, to plan their data collection. Check in on the survey questions they are planning to ask. Encourage ākonga to use the tuakana/teina model to support their learning journey.
DATA
Ākonga collect the data that they need to answer their investigative question. Be prepared for some potentially inefficient methods. Use any resulting errors or problems to improve their data collection methods.
ANALYSIS
Ākonga can display the data to answer their investigative question. They may use a pictograph or a bar graph. Remind them to label using the investigative question and to write “I notice…” statements about what the data shows.
CONCLUSION
Allow time for pairs to present their findings by giving their investigative question and then answering it using evidence from their displays and noticings.
Dear parents and whānau,
In math this week we are doing a statistics study on favourites. Can you please help us by filling in the survey form your child has produced to get some data about favourite things? If there is more than one person filling out this survey, please support your child to make space for this data collection.
Thank you.
Name:
(You could adapt this list to meet with what your class is interested in)
Figure it Out Links
There are a wide range of activities in the Figure It Out series based around statistical investigations. Look in the front half of the Figure It Out! Statistics book from the relevant level to find one which is suitable.
There are also activities around the idea of statistical investigations in the Theme books.
Arrays hooray
In this unit students are given the opportunity to explore multiplication concepts using arrays. The use of multiple strategies and the sharing of strategies is encouraged, in group and whole class situations.
In this unit the students use arrays to solve multiplication problems. Arrays are an arrangement of objects in rows and columns. For example, chocolate blocks are made up of an array of smaller pieces. The block below has two rows and five columns.
Orchards’ layouts are also arrays where the fruit trees are grown in rows and columns to make them easier to look after and easier to pick fruit from.
Arrays are strongly advocated by researchers in mathematics education because they model the binary (two factors) nature of multiplication. Therefore, this unit can be used as an introduction to multiplication. The number of rows and columns gives the factors by which the total number can be found, e.g. 2 x 5 or 5 x 2 for the chocolate block above. Arrays are also used extensively in the measurement of area, in finding all outcomes of a probability situation (Cartesian product), in grid systems on maps, and in spreadsheets and other digital tools. Recognising the multiplicative structure of arrays can be challenging for students, especially those who have little experience with equal sets.
Estimation is also an important component of this unit. Students are encouraged to use their number knowledge to anticipate approximate products when given two factors.
This unit can be differentiated by varying the scaffolding provided or altering the difficulty of the tasks to make the learning opportunities accessible to a range of learners. For example:
The contexts in this unit can be adapted to recognise diversity and student interests to encourage engagement. For example:
Consider how these contexts could provide links to other areas of current learning (e.g. about community gardens, school trips, planting out the school garden).
This series of lessons provides different contexts to explore multiplication concepts using arrays such as the one below. This array has 5 rows and 10 columns.
Session One: Getting started
Jack the apple tree grower has to prune his apple trees in the Autumn. He has 6 rows of apple trees and in every row there are 6 trees. How many apple trees does Jack have to prune altogether?
The start of PowerPoint 1 shows the whole array. Show the complete array. Ask your students to open their eyes and take a mind picture of what they see. Click once to remove all the trees and ask your students to draw what their mind picture looks like. One child could draw their picture on the whiteboard. This could then be referred back to throughout the rest of the lesson.
Look to see if they attend to the rows and columns layout even if the numbers of trees have errors. Discuss the layout.
Alternatively click again in the PowerPoint so it’s easy for all to see what the first row of apple trees will look like. Ask your students to improve their picture if they can.
What will the second row look like?
It’s important for students to understand what a row is so they can make sense of the problem. It is also important for them to notice that all rows have the same number of trees.
Allow students to use equipment if they think it will help them solve the problem.
Rove around the class and challenge their thinking with questions like:
Can you think of a more efficient way to work out how many trees there are?
How many trees are there in one row?
Do you know what 6 + 6 =? Or 3 + 3 = ?
Can that knowledge help you solve this problem more efficiently?
You used addition to work that out.
Do you know any multiplication facts that could help?
2 x 6 = 12;
12 + 12 + 12 = 36
The shared strategies can be put into similar groups.
Who used a strategy like this one?
Sessions Two and Three: Exploring through work stations
The picture book Hooray! Arrays! by Jason Powe could be used to ignite interest in this learning. In the next two sessions students work in pairs or threes to solve the problems on Copymaster 2. Consider choosing these pairs to encourage tuakana teina through the pairing of more knowledgeable and less knowledgeable students. Enlarge the problem cards and place them at each station. Provide students with access to copies of Copymaster 3 and Copymaster 4 (arrays students can draw on), and physical equipment such as counters, cubes, and the Slavonic Abacus.
Read the problems from Copymaster 2 to the class one at a time to clarify the wording. You may need to revisit the meaning of rows and columns by creating simple examples.
As students work on a station activity, ask them to create a record of their thinking and solutions. The record might be a recording sheet or in their workbook. Note that Part 2 of each problem is open and requires a longer period of investigation.
As the students work watch for the following:
At times during both sessions you might bring the class together to discuss confusions or misconceptions, clarify language and share efficient strategies and ways of representing the problems.
Below are specific details related to each problem set.
Orange Orchard
Orange Orchard (Part 1) involves 6 x 8 (or 8 x 6). Students might use their knowledge of 6 x 6 = 36 and add on 12 more (two columns of six). That would indicate a strong understanding of the multiplicative structure of arrays.
Most students will use strategies that involve visualising the array and partitioning the array into manageable chunks (dis-embedding). For example, they might split rows of eight into two fours (6 x 8 = 6 x 4 + 6 x 4), or into fives and threes (6 x 8 = 6 x 5 + 6 x 3). Other students will use less sophisticated strategies such as counting in twos and fives, or a combination of skip counting and counting by ones.
Part 2 is an open task which requires students to identify the factor pairs of 24.
Encourage capable students to be systematic in finding all the possibilities (1 x 24, 2 x 12, 3 x 8, 4 x 6).
Orange Orchard (Part 1)
Tame has an orange orchard with 6 rows of trees.
In each row there are 8 trees.
How many trees does Tame have altogether?
Your prediction:
Your answer:
Orange Orchard (Part 2)
Tame wants to plant another orchard with oranges.
He gets 24 trees.
Find different ways Tame can plant 24 trees in rows and columns.
Show all the different ways.
Kiwifruit Orchard
Part 1 requires students to coordinate three factors as the problem can be written as 3 x (4 x 5). Multiplication is a binary operation so only two factors can be multiplied at once. Do your student recognise the structure of a single orchard (4 x 5) and realise that the total is consists of three arrays of that size?
Similarly, in Part 2 students must restructure 36 plants into two sets. Do they partition 36 into two numbers, preferably that have many factors? The problem does not say that the two orchards must contain the same number of plants though 18 and 18 is a nice first solution. Once the two sets of plants are formed can your students find appropriate numbers of rows and columns that equal the parts of 36?
Kiwifruit Orchard (Part 1)
Lana has three kiwifruit orchards that are the same.
In each orchard she has 5 kiwi fruit plants in every row.
There are 4 rows.
How many kiwi fruit plants does Lana have altogether?
Your prediction:
Your answer:
Kiwifruit Orchard (Part 2)
Lana’s son, Bruce, buys 36 plants to start two Kiwi fruit orchards.
How can Bruce arrange the plants into rows and columns?
Show different ways.
Remember that he must share the 36 plants between two orchards.
Strawberry Patch
Part 1 is a single array (5 x 12). Students might use the distributive property and solve the problem or 5 x 10 + 5 x 2 (partitioning 12) or 5 x 6 + 5 x 6. Some may re-unitise two fives as ten to create 6 x 10. These strategies are strongly multiplicative. Most students will use smaller units such as fives or two and apply a combination of repeated addition (5 + 5 = 10, 10 + 10 = 20, etc.) or skip counting (2, 4, 6, 8, …).
Part 2 is about factors that have the same product (24). This gives students a chance to recognise that some numbers have many factors and the expressions of those factors have patterns. For example, 6 x 4 and 3 x 8 are related by doubling and halving. The logic behind the relationship may be accessible for some students. If the rows are halved in length, then twice as many rows can be made with the same number of plants.
Strawberry Patch (Part 1)
Hera has a strawberry patch.
There are 5 rows with 12 strawberry plants in each row.
How many strawberry plants does Hera have altogether?
Your prediction:
Your answer:
Strawberry Patch (Part 2)
Sam, Kim and Toni also have strawberry patches.
Sam has 6 rows with 4 plants in each row.
Kim has 3 rows with 8 plants in each row.
Toni has 2 rows with 12 plants in each row.
Who has the most strawberry plants, Sam, Kim or Toni?
Apple Orchard
Part 1 gives students a chance to ‘discover’ the commutative property, the order of factors does not affect the product. In this case 5 x 10 = 10 x 5.
Part 2 applies the distributive property of multiplication though many students will physically solve the problem with objects. Look for students to notice that 12 extra trees shared among six rows results in two extra per row. So, the number of rows stays the same, but the rows increase in length to six trees. Similarly, if more rows are made the 12 trees are formed into three rows of four. The number of rows would then be 9. 6 x 6 and 9 x 4 are the possible options.
Apple Orchard (Part 1)
Fatu’s apple orchard has ten trees in each row. There are five rows.
Min’s apple orchard has 5 trees in each row. There are ten rows.
Who has more apple trees, Fatu or Min?
Your prediction:
Your answer:
Apple Orchard (Part 2)
Besma has six rows of apple trees.
Each row has four trees.
If she plants 12 more trees, how many rows might she have then.
How many trees will Besma have in each row?
There are two answers.
Show both answers.
Sessions Four and Five
Sessions Four and Five give students an opportunity to recognise the application of arrays in other contexts.
The chocolate block problem involves visualising the total number of pieces in a block even though the wrapping is only partially removed. PowerPoint 3 provides some examples of partially revealed chocolate blocks. For each block ask:
Look for students to apply two types of strategies, both of which are important in measurement:
Iteration: That is when they take one column or row and see how many times it maps into the whole block.
Partitioning: That is when they imagine the lines that cut up the block, particularly halving lines. They look to find a partitioning that fits the row or column that is given.
Copymaster 5 provides students with further examples of visualising the masked array.
The Kapa Haka problem is designed around the array structure of seating arrangements for Kapa Haka performances at school.
Begin by role playing the Kapa Haka problem. Use chairs to make a simulated arrangement of seats. You might like to include grid references used to locate specific seats.
Try questions like:
Use different arrangements of columns and rows.
Give the students counters, cubes or square grid paper to design possible seat layouts with 40 seats. Encourage them to be systematic and to look for patterns in the arrangements. Some students will find efficient ways to record the arrangements such as:
2 rows of 20 seats 4 rows of 10 seats 5 rows of 8 seats
Record these possibilities as multiplication expressions on rectangles of card. Put pairs of cards together to see if students notice patterns, like doubling and halving.
It is important to also note what length rows do not work.
If students show competence with finding factors, you could challenge them to find seating arrangements with a prime number of seats such as 17 or 23. They should find that only one arrangement works; 1 x 17 and 1 x 23 respectively.
Reflecting
As a final task for the unit, ask the students to make up their own array-based multiplication problems for their partner to solve.
Dear family and whānau,
This week we have been looking at arrays in class. Arrays have rows and columns like orchards. We have found it easy to figure out the number of things that are in arrays.
Ask your child to find some arrays in your home or neighbourhood. These could include a supermarket car park or an orchard, or an egg box, or the bus seats. Use these arrays to count the number of things in those arrays. You can also help your child to draw a sketch of the arrays showing the columns and rows.
Figure it Out Links
Some links from the Figure It Out series which you may find useful are:
Supermarket displays
In this unit students explore the number patterns created when tins are stacked in different arrangements and keep track of the numbers involved by drawing up a table of values.
Patterns are an important part of mathematics. It is valuable to be able to recognise the relationships between things. This enhances understanding of how things are interrelated and allows us to make predictions.
Patterns also provide an introduction to algebra. The rules for simple patterns can be discovered in words and then written using more concise algebraic notation. There are two useful rules that we concentrate on here.
It should be noted that there are many rules operating in these more complicated patterns. Encourage students to look for any relation between the numbers involved.
In this unit we ask students to construct tables so that they can keep track of the numbers in the patterns. The tables will also make it easier for the students to look for patterns.
In addition to the algebraic focus of the unit there are many opportunities to extend the students computational strategies. By encouraging the students to explain their calculating strategies we can see where the students are in terms of the Number Framework. As the numbers become larger expect the students to use a range of part-whole strategies in combination with their knowledge of the basic number facts.
This unit can be differentiated by varying the scaffolding provided or altering the difficulty of the tasks to make the learning opportunities accessible to a range of learners. For example:
The context in this unit can be adapted to recognise diversity and student interests to encourage engagement. For example:
Getting Started
Today we look at the number patterns in a tower of tins (tini).
Show the students the arrangement:
How many tins are in this arrangement?
How many tins will be in the next row (kapa)?
Then how many tins will there be altogether?
How did you work that out?
Encourage the students to share the strategy they used to work out the number of tins. “I can see 4 tins and know that you need 5 more on the bottom. 4 + 5 = 9”
“I know that 1 + 3 + 5 = 9 because 5+3= 8 and 1 more is 9.”
[These strategies illustrate the student’s knowledge of basic addition facts.]
Show the students the next arrangement of tins. They can check that their predictions were correct.
How many tins will be in the next row?
Then how many tins will there be altogether?
How did you work that out?
“I know that we need to add 7 to 9 which is 16.” [knowledge of basic facts]
“I know that 7+ 9 = 16 because 7 + 10 = 17 and this is one less." [early part-whole reasoning]
“I know that we are adding on odd numbers each time. 1+3+5+7 = 16 because 7+3 is 10 + 5 + 1 = 16."
Add seven tins to the arrangement and ask the same questions. As the numbers are becoming larger expect the range of strategies used to be more varied.
“16 + 9 = 25. I counted on from 16.” [advanced counting strategy]
“16 + 10 = 26 so it is one less which is 25.” [part-whole strategy]
How many tins will you need altogether?
How are you keeping track of the numbers?
Do you know how many tins will be on the bottom row? How do you know?
Can you spot any patterns?
Write down what you notice?
Can you predict how many tins would be needed when there are 15 in the bottom row?
Exploring
Over the next 2-3 sessions the students work with a partner to investigate the patterns in other stacking problems. Consider pairing together students with mixed mathematical abilities (tuakana/teina). We suggest the following introduction to each problem.
Write the following questions on the board for the students to consider as they solve the problem.
How many tins are in the first row?
How many are in the second row?
By how much is the number of tins changing as the rows increase?
What patterns do you notice?
Can you predict how many tins would be needed for the bottom row if the stack was 15 rows high?
Explain the strategy you are using to count the tins to your partner?
Did you use the same strategy?
Which strategy do you find the easiest?
Problem 1:
Copymaster 1
A supermarket assistant was asked to make a display of sauce tins. The display has to be 10 rows high.
How many tins are needed altogether?
What patterns do you notice?
Problem 2:
Copymaster 2
A supermarket assistant was asked to make a display of sauce tins. The display has to be 10 rows high.
How many tins are needed altogether?
What patterns do you notice?
Problem 3:
Copymaster 3
A food demonstrator likes her products displayed using a cross pattern. The display has to be 10 products wide.
How many products are needed altogether?
What patterns do you notice?
Reflecting
In this session the students create their own “growth” pattern for others to solve.
Dear parents and whānau,
In maths this week we have been looking at patterns. Patterns are an important part of mathematics. It is always valuable to be able to recognise the relationships between things to help us see how things are interrelated and allow us to make predictions.
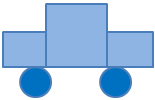
The patterns below are to do with buildings. We have been learning about how patterns like these can be continued. An important part of this has been learning to use tables to keep track of the pattern and the relationships between terms.
Ask your child if they can continue the pattern below and say what patterns they notice in the numbers. Can they draw or fill out a table to show how the pattern would progress? Can you work out how many crosses would be in the triangle with 15 crosses along the bottom?
Number of crosses high
Outlining area
This unit of work explores the measurement of area. Ākonga estimate and measure area using square centimetres.
When ākonga can measure areas effectively using non-standard units, they are ready to move to the use of standard units. The motivation for moving to this stage often follows from experiences where the ākonga have used different non-standard units for the same area and have realised that consistency in the units used would allow for the easier and more accurate communication of area measures.
The measurement experiences of ākonga must enable them to:
The usual sequence used in primary school is to introduce the square centimetre and then the square metre.
The square centimetre is introduced first, because it is small enough to measure common objects. The size of the square centimetre can be established by constructing it, for example by cutting 1-centimetre pieces of paper. centimetre cubes can be used to measure the area of objects. An appreciation of the size of the unit can be built up through lots of experience in measuring everyday objects. Ākonga should be encouraged to develop their own reference for a centimetre, for example, a fingernail or a pebble.
As ākonga become familiar with the size of the square centimetre they should be given many opportunities to estimate before using precise measurement. This could include using centimetre-squared paper to create different shapes of the same area.
Consider integrating real-world and cross-curricular examples, such as the area of grass seed or bark needed for a school garden, or the area of space available on a tapa cloth, or the area of new rakau sticks. You might also draw on the books you have been reading as a class to frame the learning in a new context (e.g. estimating and measuring the height of different characters or items from the story).
Te reo Māori vocabulary terms such as mehua (measure), horahunga (area) and mitarau pūrua (square centimetre) could be introduced in this unit and used throughout other mathematical learning.
This unit can be differentiated by varying the scaffolding provided or altering the difficulty of the tasks to make the learning opportunities accessible to a range of learners. For example:
The context in this unit can be adapted to recognise diversity and student interests to encourage engagement. For example, the activities could focus on measuring familiar objects such as leaves in autumn, shells following a trip to the beach, or pebbles found at your local awa. For the activities to work there needs to be a collection of objects, all with a range of areas around 120cm.
Session 1
We start this unit with a guessing game which introduces the idea of estimation. Consider how the mystery object you choose might reflect the learning interests and cultural make-up of your class.
What do you think that this could be the outline of?
How many cubes do you think I would need to cover this shape?
Give each student a 1cm cube and ask them to write their guess on a piece of paper. Introduce the idea that an estimate is a thoughtful guess.
I think the area of the mystery object is ........... cubes
Lillie-Moana
Show the class a shape made with 5cm cubes, for example a rākau stick
Ask ākonga to record the shape on cm squared paper.
What is the area of this shape?
Why do you think it is called a square centimetre?
What is the area of this shape? (5 square centimetres or 5 square cm)
(These shapes are called pentominoes and there are 12 distinct shapes that can be made. Some ākonga may wish to explore this concept further).
Session 2
Session 3
Session 4
Session 5
Today we use the measurement skills we've been working on to find out who has the smallest and largest footprint in our class.
How could we find out?
About how many square centimetres do you think it would be? Why do you think that?
Dear family and whānau,
This week at school we have been measuring the area of objects using square centimetres.
At home this week your child is asked to figure out the area of largest and smallest footprints in your family using the attached square centimetre paper. They can draw and outline and then figure out the area. Encourage your child to estimate the area in square centimetres before working it out. We will use these to make a classroom display of big and little footprints.
Figure It Out Links
Some links from the Figure It Out series which you may find useful are:
Matariki - Level 2
This unit consists of mathematical learning, at Level 2 of the New Zealand Curriculum, focused around celebrations of Matariki, the Māori New Year. The sessions provide meaningful contexts that highlight Māori culture and provide powerful learning opportunities that connect different strands of mathematics.
Session One
Session Two
Session Three
Session Four
Session Five
Specific Teaching Points
Session one involves subtracting single digit and two digit numbers starting at 200. As students take handfuls or counters from their "waka" they should anticipate how many counters remain. Students should use place value to calculate, as opposed to counting back. The use of a linear model for representing the calculations is recommended. A bead string is ideal and can be mounted along the edge of a whiteboard. Jumps can then be recorded on the whiteboard.
The session notes recommend linking two strings end on end to form a line of 200 beads. An important strategy in this activity is ‘back through ten’. For example, a student has 93 counters left and removes a handful of 17 counters. How many do they have left?
On the bead string, this calculation can be modelled like this:
In this diagram, 93 – 7 is calculated in two steps. First, the seven in 17 is imaged as 10 and 7. Three is subtracted from 93 to get to 90 and then four is taken away to get 86. Thus, the seven from 17 has been subtracted, leaving only the 10 to be taken away next. This is a ‘back through ten’ strategy, meaning it uses a decade number (i.e. 90) as a benchmark. Alternatively, a student might take away the ten in 17 first, and then the 7.
Session three involves dealing with "like" measures, e.g. dividing or multiplying weights. Measuring objects with devices like kitchen scales is important to the development of students’ understanding of the measurement system. For example, students will need to find out how many kilograms of kūmara need to be ordered for the hāngī. If possible, bring a few kūmara along so students can experiment and find out how many kūmara make up one kilogram in weight. They will then need to use division or multiplication to calculate how many kūmara they need in total for the hāngi. If 24 kūmara are needed and four kūmara weigh one kilogram then 26 (24 ÷ 4) kilograms of kūmara will need to be purchased.
Session four develops important geometry ideas out of whai (string figures). A common issue with the learning of geometry is that students form prototypical views of shapes. For example, they might consider an equilateral triangle to be the only shape that is a triangle. All of the shapes below are triangles:
The issue of prototypical ideas will also apply to other polygons such as hexagons and octagons.
These three shapes are all hexagons. Note that the bottom hexagon is concave as it has two internal angles greater than 180°. It is important to discuss the defining characteristics of a class of shapes like hexagons. The only required property is that the shape is closed by six sides.
Session five also involves an important mathematical idea, distinctness. Rotating or reflecting a shape does not change its properties, except orientation (direction it is facing). The idea is fundamental to determining if given shapes are similar or different. For example, all of the shapes below are similar even though they look different. They can all be mapped onto each other using translation (shifting), reflection (flipping), and rotation (turning).
Similarity is applied in Session Five by looking for different winning positions. If the positions are reflections or rotations of one another then they are not considered to be distinct.
The learning opportunities in this unit can be differentiated by providing or removing support to students, or by varying the task requirements. Ways to support students include:
Tasks can be varied in many ways including:
Although the context of Matariki should be engaging, and relevant, for the majority of your learners, it may be appropriate to frame the learning in these sessions around another significant time of year (e.g. Chinese New Year, Samoan language week). This context offers opportunities to make links between home and school. Consider asking family and community members to help with the different lessons. For example, members of your local marae may be able to share local stories and traditions of matariki with your class.
Te reo Māori language is embedded throughout this unit. Relevant mathematical vocabulary that could be introduced in this unit and used throughout other learning include āhua (shape), shape names (e.g. whetū - star), tātai (calculate, calculation), tāpiri (add, addition), ine (measure), taumaha (weight), huri (rotate, rotation), whakaata (reflect, reflection), and neke (translate, translation, move)
Prior Experience
The activities are mostly open ended so they cater for a range of achievement levels. It is expected that students have some experience with naming and classifying basic geometric shapes, with measuring weight in kilograms, and with translating, reflecting and rotating shapes. They should also have place value knowledge to at least 200.
Session One
What the legend does not tell you is that Tamarereti collected 200 bright shiny stones and put them at the bottom of the waka.
Have a ‘waka’ with 200 counters ready for the student to act out the story. Any narrow container will make a good waka.
Look for students to suggest ways to group the counters. Combinations that add to ten are especially useful.
Session Two
How do we find out the date of the full moon from this calendar?
So when will the last quarter start?
When are the good days for fishing?
When will the new moon appear?
So when does the New Year start?
Session Three
Matariki is a time of cultural pursuits and feasting to celebrate the New Year ahead. The hāngī or earth oven has particular significance at the time of the new moon after the rise of Matariki in the eastern pre-dawn sky. Matariki is the star at the bow of Te Waka o Rangi and her travels around the sky for eleven months of the year are exhausting. It is said the steam of the first hāngī in the New Year rises into the sky and replenishes the strength of Matariki. From the offerings she gathers strength to lead the giant canoe for another year. Without Matariki at the bow the canoe cannot travel and Taramainuku cannot cast his net to gather the souls of the departed. At the New Year the names of the dead are called out so the souls of the departed may be cast into the heavens as stars.
There are many resources already available about hāngī.
“Preparing for the hāngī” is a Level 3 activity from the Figure It Out series.
“Hanging out for hāngī” is a unit at Level 3 that develops a statistical investigation around deciding which foods to cook.
The notes below are an adaptation more suitable for Level 2 students.
Students might mention that people should not eat every meat and every vegetable. Agree on some restrictions like one or two meats and up to three vegetables. Point out that stuffing is a yes or no choice.
Session Four
Matariki was a time when food was already stored, and it was cold outside. So whānau (families) spent time together engaging in cultural pursuits such as storytelling, arts and games. Whai (string games) were popular with tamariki (children) and adults alike, especially when they involved co-operation. Whai has a long history and is common to many indigenous cultures around the world, including the indigenous tribes of North America. Traditionally whai was played with twine made from flax. The best man-made fibre to use for whai is nylon since it slides and flexes, and is soft on your hands. It is commonly used to form lines for brickwork so is available at most hardware stores in a variety of colours. Nylon string is usually available in craft shops.
At 1:08 it is easier to think of going over two strings and ‘picking up the third string’ in that move. Note that the move where you use your mouth to shift the bottom of two strings over your thumbs (2:00 - ) is called ‘Navajoing your thumbs’ and is another algorithm common in whai.
Session Five
In this session students learn to play the traditional Māori game Mū Tōrere which is like a form of draughts. The original game is sometimes referred to as the wheke (octopus) game or the whetū (star) game due to the shape of the board. It is appropriate that students learn to play the game at the time of Matariki, since the Māori New Year is a time of engaging in cultural pastimes. The board (see Copymaster 5) has been altered to include the nine or seven stars of Matariki, depending on the version of the game that is played. A digital version of this game is available online - search for “Mū Tōrere - HEIHEI Games”.
The winner must occupy the centre circle, the opponent’s stones must be clustered together around the hexagon and the winner must have the ends of the cluster blocked off. You might try to find a winning arrangement by separating the loser’s stones into a group of two and one but there is no way for the other player to stop them moving.
Dear parents and whānau,
This week we are exploring some mathematical ideas with activities to celebrate Matariki, the Māori New Year. We will be learning the legend of Tamarereti and using that story to learn about numbers of bright stones. We will look at the phases of marama (the moon) to find the best days to go fishing in the New Year period, plan and cost a hāngī, and discover geometry in whai (string patterns). Lastly we will learn to play Mū Tōrere, a traditional Māori game that takes a lot of strategy to win.
These activities involve number, algebra, geometry, measurement and statistics so we will be very busy and doing a lot of mathematical thinking.
Making benchmarks: Mass
In this unit we will explore the idea of having benchmarks of 1 kilogram and 1/2 kilogram, or 500 grams, to aid in estimating the mass of given objects.
It is difficult to estimate the mass of individual items. Try picking up a school bag and estimating its mass. It is something most people aren’t that good at because we haven’t had much practice or we don’t have the same ‘onboard’, meaning a benchmark which can be used to compare and describe the measurement attributes of different objects e.g fingertip to shoulder – 1 metre. Students need to develop personal benchmarks with which to measure various objects in their daily lives. Their personal benchmarks need to gradually relate more to standard measures such as 1 kilogram or 500 grams.
Students also need to be provided with opportunities and experiences to explore the connections between kilograms and grams. To support the understanding of these connections students will explore the language of measurement including prefixes such as kilo. The ultimate aim is for students to be able to choose appropriately from a range of strategies including estimation, knowledge of benchmarks, and knowledge of standard measures in order to approach various measuring tasks with confidence and accuracy.
It is of note that mass and weight are not the same thing. The mass of an object is a measure of the amount of matter in it, and is measured in kilograms (kg), grams (g), and milligrams (mg). Weight is the force that gravity exerts on an object and so can vary from place to place. For example, objects weigh less on the moon than they do on Earth, because the moon has less gravity than Earth. In a science context, weight is measured in Newtons (N). However, the terms mass and weight are used loosely, and inaccurately, in everyday speech to mean the same thing.
This unit can be differentiated by varying the scaffolding of the tasks to make the learning opportunities accessible to a range of students. Ways to support students include:
The context in this unit can be adapted to recognise diversity and student interests to encourage engagement. Support students to measure the mass of familiar items, items of interest or items from their culture, and encourage students to develop benchmarks for mass using items of importance to them. For example, how many marbles or LEGO bricks are in 1kg? How heavy is your favourite book? Can you find a book that weighs 1kg? How many rugby balls in 1 kg? (two, the weight of a regulation rugby ball is 460g). You could go on a nature walk around the community to locate items from nature to compare the weights of, for example rocks and shells. When providing items for students to weigh, consider how these could reflect the learning interests or cultural diversity of your class.
Te reo Māori vocabulary terms such as maihea (mass), karamu (gram), manokaramu (kilogram), and ine-taumaha (scale for measuring weight) could be introduced in this unit and used throughout other mathematical learning.
Session 1
Begin by asking students to bring in their school bag. Pose the question Who has the heaviest bag to carry to school and who carries the lightest bag to school? Several kete filled with rocks or books could be used for the same purpose.
Session 2
The following activities are to provide students with experiences to compare weights of different objects and to create a benchmark of what a kilogram feels like.
In preparation for Session 3 ask students to locate items from around their home that they believe would make good benchmarks for 1kg. Ask them to bring along an object that they think has a mass of one kilogram.
Session 3
What does kilo stand for?
How many kilograms is 2000g?
How many grams in 1.5 kg?
Session 4
The blindfolded individual verbally announces their estimate and a non-blindfolded recorder records the estimation. The non-blindfolded individuals can also estimate the mass of the mystery object.
The process can be repeated for each group member.
Session 5
Dear family and whānau,
This week we are exploring mass and having fun measuring things on the scales and starting to develop a "feel" for a kilogram. Children are asked to bring items to school that they think would be a useful benchmark for 1kg.
Ask your child how much they estimate some items around the house and environment to weigh. Ask them to share their own built in benchmarks for estimating the mass of different items around the home and environment. For example, ask them how much would a big book or a tree branch weigh or ask them to lift a bag of potatoes and explain that it's what 10kg feels like.
We have also learnt a little about how early Māori people measured length using a special person whose job was to be a “standard measure”. Do you know of any different measurement methods or tools that people from different cultures used before the introduction of units like grams, kilograms, centimetres etc.? If you do, we would love to find out more about these different measurement methods.
Figure it out
Some links from the Figure It Out series which you may find useful are:
Place value with two-digit numbers
This unit supports students learning to understand the structure of two-digit numbers and how to operate with them.
Session One
Session Two
Session Three
Session Four
Session Five
Our number system is sophisticated though it may not look like it. While numbers are all around us in the environment, the meaning of digits in those numbers and the quantities they represent are challenging to understand. Our number system is based on groupings of ten. This means ten is our preferred grouping for collecting single objects into groups. Using ten is so common around the world because humans have ten fingers. The part of our brain that controls our fingers is also associated with counting.
To represent all the numbers we could ever want we use ten digits, 0, 1, 2, 3, 4, 5, 6, 7, 8, and 9. The word for digits comes from the Latin word for fingers or toes - digitus - and related to the age-old practice of counting on fingers and toes. We don’t need a new number to represent ten because we think of it as one group of ten. When we use the numerals 10 to represent "ten" we are using place value for the first time. The place of the digit 1 tells us the size of the quantity it represents -one ten. Zero has two uses in the number system, as the number for ‘none of something’ and as a placeholder. That means it occupies a place, or places, in order to identify the values represented by the other digits. In the number 10, zero acts as a placeholder in the ones place.
Place value means that both the position of a digit as well as the value of that digit indicate what quantity it represents. In the number 73 the position of the 7 is in the tens column which means that it represents 7 units of ten (70). Renaming a number flexibly is important. In particular, it is vital that students understand that when ten ones are created they form a unit of ten. For example, the answer to 25 + 35 is 6 tens (60) because 5 ones and 5 ones combine to form another ten. Similarly, when a unit of ten is ‘decomposed’ into ones the number looks different, but still represents the same quantity. For example, 42 can be viewed as 4 tens and 2 ones, or 3 tens and 12 ones, or 2 tens and 22 ones. Decomposing is used in subtraction problems such as 72 – 48 = □ where it is helpful to view 72 as 6 tens and 12 ones.
This unit can be differentiated by varying the scaffolding of the tasks or altering the difficulty of the tasks to make the learning opportunities accessible to a range of learners. For example:
Some of the activities in this unit can be adapted to use contexts and materials that are familiar and engaging for students. For example:
Te reo Maori vocabulary terms such as uara tu (place value), poro-tekau (tens place value block), poro-tahi (ones place value block) and rautaki tatau (counting strategy) could be introduced in this unit and used throughout other mathematical learning.
Before you start this unit you may like to watch the video ‘Counting Collections’ in nzmaths.co.nz which focuses on developing number sense. As an introduction you could try ‘Count it’ for Yrs 1-3.
Prior Experience
This unit is targeted at Level 2 so students should have experience of the following skills from Level 1:
If your students have not yet developed proficiency in these skills, consider revising them prior to, or alongside, this unit.
Session One
In this session the students explore how groupings of ten can be used to aid counting and to perform calculations. They create the sets of countable objects that will be used in later lessons. Consider framing the creation of these countable objects in relation to other relevant learning (e.g. creating painted stones for the school garden, collecting cans for a school-wide food drive).
Acknowledgment: The game 60 second challenge was created by Ann Downton from Monash University, Melbourne.
What is the middle score? How can you tell?
What is the difference between the highest and the lowest score?
Session Two
In this session students learn to match quantities with two-digit numbers and vice versa.
Part One
There are four tens and seven ones.
It is not quite eight tens. There are three beans missing.
I have 26 (put the collection under the shield). I am putting 60 more beans in. What does sixty look like (6 bags of ten). How many beans are there now? How do you know?
Is there an easy way to know it will be 86 without going 26, 36, 46, ... 86?
Part Two
Close to 100 is played in pairs with a dice (1-6). Players take turns to roll the dice and decide if the digit that comes up represents tens or ones. For example, if 5 is rolled it may be used as 5 or 50.
The player adds whatever they chose to their running total. That total is recorded each roll. Players have a total of seven rolls and must use all of these rolls. The player with the total closest to 100 after seven rolls wins. Players’ totals may go over 100. Here is an example:
If appropriate, organise students into pairs or small groups to play this game. It can be adapted to the different knowledge in your class by changing the “close to” number (i.e. close to 10, close to 1000).
Session Three
In this session students investigate how 100 can be partitioned to form ‘number buddies’ like 20 + 80 and 1 + 99.
Part One
How many beads are in each row? How do you know?
How many beads are on the whole abacus (100)? How do you know?
Eight tens and six ones, No tens and nine ones, five tens and two ones.
I’ve got seven tens and four ones. Move over 100 to see how the students react. Look for them imaging where the counter might go below the hundreds board.
I have 12 tens and five ones (125)
Number story:
On day 1 the community planted 48 trees that had been delivered by the council. On day 2 the local marae offered 52 native trees for planting. Altogether 100 trees were planted.
Or: 36 + 17 + 26 + 21 = 100 (36 + 64)
At the local beach, when the tide was down, Aniwa and her cousin collected 36 cockles. The next time they went collecting cockles Aniwa found 17, Rei found 26 and Kori managed to get 21. Over two days they had collected 100 cockles.
Part Two
I have seven tens and two ones. How many beads is that? (72)
How many are left over here? How do you know? (28 - There are two tens and eight ones)
The other player must add on the correct number to that number to make the total 100. Highlight that this involves thinking about what is left from 100 using the abacus. So if correct the other player would key in + 54 = and the calculator would display 100.
The game can be played competitively in pairs with a point awarded for each correct answer (best of ten tries). Get the students to record their work with equations, e.g. 46 + 54 = 100.
Session Four
In this session the students explore different names for the same two-digit number.
Part One
In the last lesson the class explored how 100 can be renamed in lots of ways. In this lesson, we explore the same concept with other numbers.
What would happen to the beans to get the next name for 75? (A bag of ten would be shifted into the ones place)
If we kept the pattern going, when would it end? (75 ones)
What is this number? ‘fifty– twenty-eight’ or 78
What other names for that number can you find? ‘sixty-eighteen’, ‘seventy-eight’ but don’t forget ‘forty-thirty eight’, ‘thirty-forty-eight’.
Part Two
In the game students choose cards to cover the crocodile numbers of their board. The cards provide many options for covering numbers but most options involve renaming. For example, if a student wants to cover 72 they could do so by nominating:
When might renaming two-digit numbers be useful? Examples might include having ten dollar notes and one dollar coins and trying to find out how much money you have in total.
Suppose I have 63 toys. I give 26 of them to my brother or sister. How many do I have left?
How many toys do we still need to take away? Can we rename 43 so it is easy to take away the other six toys?
Session Five
In this session students apply the place value structure of two-digit numbers to change a given number into a different number either mentally or with support of materials.
Part One
Suppose I am set the challenge of changing from 30 to 80. What could I do? Is there a single operation I could key in?
Suppose I am set the challenge of changing 80 to 10 in a single operation. What might I do?
This time I have to change 15 into 46 with one operation. What can I do?
If I write 15 + □ = 47 does that help you work out what to do?
Part Two
Players take turns to enter a starting number, say 34, and pass over the calculator with a change instruction, say “Change 34 into 88 with one operation.” Restrict the numbers to two places though moving to 3 digits is a significant extension for more competent students. A player gets a point for every correct change they give. The asker gets a point if the suggested change is incorrect. Look for the following:
What did you do to make the problems harder for your partner?
Dear parents and whānau,
Our next mathematics unit is based on Place Value. So we will be working a lot with two-digit numbers like 26 and 79. We will be using materials grouped in tens so we can make sense of the quantities that the numbers represent. For example, 62 means 6 tens and 2 ones and is said as “Sixty-two.”
We will also rename the two-digit numbers in flexible ways so that we can apply renaming to the operations, particularly addition and subtraction. Ask your child to discuss the strategies we are learning and explain their thinking.
That's not fair!
In this unit we play probability games and learn about sample space and a sense of fairness.
Three important ideas underpin this unit:
Students should be given lots of experience with spinners, coins, dice and other equipment that generates outcomes at random (e.g. drawing a name from a hat). The equipment can be used to play games, which should lead to a discussion of fairness (or otherwise) of the equipment and to finding the possible outcomes of using it. As they play games, record results and use the results to make predictions, they develop an important understanding - that with probability they can never know exactly what will happen next, but they get an idea about what to expect.
Students at this Level will begin to explore the concept of equally likely events, such as getting a head or tail from the toss of a coin, or the spin of a spinner with two equal sized regions. Students can handle simple fractions at Level 2, and assigning simple probabilities provides them with an interesting and useful application of these numbers. Students can understand that the probability of getting a head when tossing a coin is 1/2. Given a spinner that is marked off equally in three colours, students can also understand that the probability of getting any one of the colours is 1/3 because there are three equally likely events and one of them has to happen.
This unit can be differentiated by varying the scaffolding of the tasks or altering expectations to make the learning opportunities accessible to a range of learners. For example:
Some of the activities in this unit can be adapted to use contexts and materials that are familiar and engaging for students. For example:
Te reo Māori vocabulary terms such as tūponotanga (probability), matapae (prediction) and tōkeke (fair) could be introduced in this unit and used throughout other mathematical learning. Another term that may be useful in this unit is Putakitaki (Paradise duck).
We introduce the unit by rolling dice and investigating the numbers that come up.
What number do you think I will roll?
Why do you think that?
Roll the die and see whether students' predictions were correct. Repeat a couple of times.
List these on the board and tell the students that this list of all the possible outcomes is called the sample space.
List these predictions on the board or on chart paper.
With the class, roll the die twenty times keeping track with a tally chart. Summarise onto a class chart.
lllllGive pairs of students a die and ask them to work together to roll it 20 times. As they finish, ask them to record their results on the class chart.
Why are all our results different?
If you rolled the die another twenty times what do you think would happen? Why?
Now let's add our results together.
What do you think that we will find?
Use a calculator to sum down each of the columns
Number rolled
240 rolls
At this level it is likely that the students may attribute uneven results to "special luck". It is through continued experience that students come to appreciate the mathematics of probability.
Exploring
Over the next 3 days the students play a number of probability games. Copymasters for each game are attached to this unit. They are encouraged to think about the sample space and to make predictions as they play the games. They will also begin to think about whether the games are fair.
Tell the students that they are going to play a number of games in pairs over the next 3 days and there are some general things they need to do with each game:
Note: At this level do not expect the students to make mathematically sound predictions or systematically identify all possible outcomes. It is likely that they will make incomplete lists of possible outcomes. In future work, as they have similar experiences, their thinking will become more systematic and mathematically sound. The main aim of this unit is to start the students thinking about possible outcomes and notions of fairness.
Probability games to select from:
Bunny hop (Copymaster 1)
Sample space = {Heads, Tails}
As there is an equal chance of getting a head or a tail you would expect the bunny to be close to 0 after a number of turns.
Doubles (Copymaster 2)
Sample space
There are 6 ways of getting a double or 6 out of 36.
It is unlikely that the students will be this systematic about identifying the sample space. However they should identify that you are more likely to get non-doubles.
Pūkeko racing (Copymaster 3)
Sample space = {2, 3, 4, 5, 6, 7, 8, 9, 10, 11, 12}
The table shows the ways of getting each sum. 7 (6 ways) is the most likely followed by 6 and 8 (5 ways).
Odds or evens (Copymaster 4)
Sample space = {1 3, 5 (odd) and 2, 4, 6 (even)}
For this game the probability of each player winning is equal.
Sums (Copymaster 5)
From the table for Pūkeko racing you can see that there are 24 ways of rolling a 5, 6, 7, 8 or 9 which is a probability of 24 out of 36 or 2/3. The probability of rolling a 2, 3, 4, 10, 11, or 12 out of 35 or 1/3.
Up or down (Copymaster 6)
Sample space = {heads, tails}
This is very similar to the bunny hop game. You expect the climber to be close to 0 after a number of turns.
At the end of each session have a class sharing time to discuss a couple of the games.
Reflecting
On the final day of the unit ask the students to invent their own games using either coins or dice. Share the games with others in the class.
Which number came up the most? Why do you think it did?
If we rolled the die again do you think we would get the same results? Why?
Dear parents and whānau,
This week in maths we have been playing probability games, discussing if they are fair and what likely outcomes might be. We played the Bunny Hop game in class and we would like to share this with you.
Bunny Hop Game
The winner is the player who is on the highest number after 10 tosses each. Before you play, talk together about where you think the counters are most likely to be after 10 tosses each.
Fold and cut
In this unit ākonga explore line or reflective symmetry and the names and attributes of two-dimensional mathematical shapes. They fold and cut out shapes to make shapes that have line symmetry.
A shape that can be folded down a line to produce two matching halves is said to have line symmetry or reflective symmetry. The fold-line is called a line of symmetry. A line of symmetry can also be described as a mirror line or line of reflection because the part of the object that is on one side of the line is reflected onto the other side of the line.
The goal at this level is to support ākonga to independently describe reflective symmetry in their own language, and demonstrate understanding of this concept. This creates a foundation on which to build a more complex understanding of symmetry at higher levels of the curriculum, e.g. the order of reflective symmetry and rotational symmetry.
Learning the names and attributes of common two-dimensional mathematical shapes is important and necessary as ākonga develop a geometry vocabulary. The following are common two-dimensional mathematical shapes and their attributes that could be introduced in this unit. Not all these shapes need to be presented to all ākonga. Teachers need to select the ones appropriate, based on the readiness of ākonga.
Note that pentagons, hexagons and octagons are any shapes with 5, 6 or 8 straight sides. The length of sides do not need to be the same nor do the angles need to be the same.
Pentagons, hexagons and octagons with sides the same length and angles the same are called regular pentagons, regular hexagons and regular octagons. A square is a regular quadrilateral and an equilateral triangle is a regular triangle.
This unit can be differentiated by varying the scaffolding of the tasks or altering the difficulty of the tasks to make the learning opportunities accessible to a range of learners. For example:
The context in this unit can be adapted to recognise diversity and student interests to encourage engagement. Ākonga can identify familiar and natural objects with line symmetry, such as; skateboards, swimming goggles, running shoes, pipi or other shells, flowers, maunga reflection on an awa, leaves, butterflies, logos, kōwhaiwhai patterns or other cultural motifs.
Te reo Māori vocabulary terms such as āhua (shape), whakaata (reflect/reflection), and hangarite (symmetry/symmetrical) could be introduced in this unit and used throughout other mathematical learning.
As ākonga work through these activities the teacher may need to bring the class or small groups of ākonga together from time to time to discuss and model. Make sure an understanding of what line symmetry is and the names and attributes of common two-dimensional mathematical shapes is developing, alongside appropriate vocabulary.
Teachers may also like to generate a class display of the names and attributes of the shapes to be used over the course of the unit.
Session 1
Will the other half be exactly the same?
How do you know the other half will be exactly the same?
When I open this piece of paper, what shape will the hole in the middle be?
Why did it work like that?
How many sides and how many angles?
What do you notice about the length of the sides?
Are any angles the same?
Does anyone know the name of this shape?
Session 2 - Straight Line Shapes
How many different straight line shapes can be made by folding a square piece of paper in half and cutting?
For most of this unit the focus is on straight line shapes. Using a ruler to draw the straight lines onto the folded paper before cutting is encouraged. Working in small groups, the ākonga are to make as many of the following as they can. A tuakana/teina model could work well here.
Make . . .
Place these shapes into three piles.
Once as many different shapes as possible have been made, assign a category of shapes to pairs of ākonga, e.g. shapes with 3 straight sides. The pairs sort their shapes according to the way they look. A tuakana/teina model could work well here. The ākonga then share with the rest of the class why they sorted their shapes as they did. Ākonga could use known shapes or reference posters to help with this.
Session 3 – Make the Shapes
How many of the following shapes can you make by folding and cutting?
Ask ākonga to fold a square piece of paper in half and cut out a shape so that when they unfold it the hole will be one of the shapes below.
Model doing one shape in front of everyone. Emphasise that you are looking for a line in the shape that you could fold on, so both halves would be the same (this is called a line of symmetry or reflective symmetry).
Get the ākonga to predict which shapes will be the easiest to make, the hardest to make and whether any will be impossible. Ask why they think they will be easy, hard or impossible.
Make some more challenges like the ones above for others in your class. You could provide photographs of things in nature that have lines of symmetry that ākonga could replicate. Search 'reflective symmetry' in a google image search for some ideas.
Session 4 - Alphabet Shapes
Make as many letters of the alphabet as you can by folding and cutting. This activity could also be adapted to use two-dimensional shapes that are relevant to your current context of learning (e.g. the shape of a marae, a koru, and the shape of a wave; sports gear). Some ākonga may benefit from working in pairs, and/or with the teacher in this session - at least initially.
As a reference point, here are the alphabet letters that do and do not have lines of symmetry.
Session 5 - Reflecting
Ask ākonga (mahi tahi model) to think about the things they have learnt this week, the names of shapes and about their reflective or line symmetry.
Give pairs of ākonga 3-4 of the shapes from the list below that ākonga have become familiar with while completing this unit. Ask them to describe them using their own words and the words they have been learning this week. Also ask them to identify which shapes have line or reflective symmetry. A tuakana/teina model could work well here.
Equilateral triangle, Right angle triangle, Isosceles triangle, Scalene triangle, Square, Rectangle, Trapezium, Rhombus, Parallelogram, regular and non regular Pentagon, Hexagon and Octagon.
Dear family and whānau,
We have been exploring different shapes in class this week, focusing on ones that have reflective symmetry, that is shapes that can be folded in half so both halves are the same. It would be appreciated if you could support your child to look for objects and shapes around your home that have reflective or line symmetry. They could make a list of the objects and draw a picture showing how the object could be 'folded'. Furniture, art, cutlery, plates, electronic items, things in the garden and other items around the home could have reflective symmetry.
Figure it Out Links
A link from the Figure It Out series which you may find useful is:
Maps
In this unit ākonga are introduced to using maps. They use maps to locate landmarks, identify views from different locations, and give directions using left and right turns, and distances.
Maps provide a two dimensional representation of the real world. By looking at a map ākonga can anticipate the landmarks they will see from a given location and in which direction (N, S, E, W) those landmarks will be seen. By using maps of their kura or local area, ākonga will be able to check their thinking by matching the map with the real world.
Ākonga will begin to use maps to help them follow and give directions. They will start to use directions involving left and right turns and use landmarks to clarify pathways. Ākonga will begin to use distances in whole numbers of metres.
This unit can be differentiated by varying the scaffolding of the tasks or altering expectations to make the learning opportunities accessible to a range of learners. For example:
Some activities in this unit can be adapted to use contexts and materials that are familiar and engaging for ākonga. In particular, the choice of maps to use will depend on the interests of your class. Some ākonga may respond best to maps of familiar areas, (for example, marae, beach access or playground) while others may be more engaged by an imaginative context. You could work as a class (mahi tahi model) to create maps of a favourite story, or the location of a movie.
Te reo Māori vocabulary terms such as map (mahere), North (raki), South (tonga), East (rāwhiti), West (uru), left (mauī) and right (matau) could be introduced in this unit and used throughout other mathematical learning.
Session 1
In this session ākonga are introduced to using a map to locate landmarks and identify views from different locations.
Which classroom has the best view of the marae?
What building can you see from the field?
What building can you see out the library windows?
Session 2
In this session ākonga use the kura map to describe pathways from locations.
Session 3
In this session ākonga use a local or imaginative map to describe different views they can see from different locations. They use compass directions to give the direction of landmarks from given locations. The map below is available as Copymaster 1.
How many whare have a direct view of the marae?
What can the children see from the playcentre?
What can the doctor see out the window?
If you sat in the doctor’s carpark what could you see?
Colour in a whare that has a view of the playcentre, the dairy, and the hall?
What building is east of the café?
What building is north of the hall?
What building is south of the chemist?
What direction is the playcentre from the church?
What direction is the marae from the doctors?
How many whare are south of the hall?
From which building can you look west to see the church?
Session 4
In this session ākonga give a set of directions between two locations using distances and quarter turns to the left and right.
Session 5
In this session ākonga learn about pathways and apply this to creating a fire escape plan for their whare.
Dear family and whānau,
This week your child has been using maps to describe views and pathways from locations. Your child has started to draw a plan of your whare and is finishing it by marking the escape routes out of each room in case of a fire. Please help them to complete the activity. You may wish to complete the Fire Escape Plan on the NZ Fire Service website - https://www.escapemyhouse.co.nz
Figure it out
Some links from the Figure It Out series which you may find useful are:
Staircases
In this unit ākonga look for and describe patterns they see in different types of staircases and other patterns.
In much of early pattern work, the numbers involved can be compiled in tables like the one below:
Two relationships can be seen:
In practice, recurrence relationships are easier to identify than functional ones.
This unit can be differentiated by varying the scaffolding of the tasks or altering the difficulty of the tasks to make the learning opportunities accessible to a range of learners. For example:
The materials used in this unit can be adapted to recognise diversity and ākonga interests to encourage engagement. Instead of creating patterns with classroom blocks or cubes, ākonga could be encouraged to make the patterns using environmental materials such as pebbles, shells, or daisies from the school lawn. Be sure to discuss patterns that your ākonga know about from their personal experience, for example, staircases at home or at the local library, ladders in the kura playground and patterns they have seen at marae or in the community garden.
Te reo Māori vocabulary terms such as tauira (pattern) and the phrase, e hia? (how many) could be introduced in this unit and used throughout other mathematical learning.
Getting Started
Today we explore up-and-down staircases to find the pattern in the number of blocks they are made from.
Begin the session by telling ākonga about up-and-down staircases. This type of staircase can be likened to traditional lattice poutama which can be found on tukutuku panels in many marae.
How many blocks are in the staircase?
How many blocks do you think would be in a 3-step up-and-down staircase?
How could you work it out?
Get ākonga to build more staircases. As they do, ask them about any patterns they see.
Some may recognise the horizontal layers as being the sequence of odd numbers. Some may see the vertical stacks.
Some may see that square numbers of blocks are always involved. This can be checked by rearranging the blocks to make square numbers (see the diagram below). This is an important discovery. Let them make it. This may require some careful scaffolding on your part. Ask ākonga to make several squares and look for patterns. The first square is 1 block, then the next square is 1 + 3 followed by 4 + 5. The square term is a number raised to the second power (n2 e.g., 2 x 2 = 4). Using blocks to build some squares and then asking ākonga to draw three more builds a good understanding of square numbers.
Exploring
Over the next 2-3 days, ākonga work in pairs or individually to solve the following problems (Copymaster of problems). A tuakana/teina model could work well here. Show ākonga how to use grid paper to draw the patterns and continue them. They could also use materials. As ākonga complete the problems, ask them about any patterns they see and encourage ākonga to record these observations with the patterns on the graph paper or by building the patterns with materials. Ākonga can also record their patterns using a table. The teacher will need to demonstrate how to do this and potentially provide blank tables for ākonga to use. For example:
Problem 1: Straight up the stairs
How many blocks are in this 4-step-up staircase?
How many blocks would there be in a 5-step-up staircase?
How many blocks would there be in a 6-step-up staircase?
How many blocks in a 10-step-up staircase?
How many more blocks will an 11-step-up staircase need?
What is the largest up staircase that you can tell us about?
Note: the numbers of blocks in this pattern are the triangular numbers, see Algebra Information.
Problem 2: Climbing ladders
How many pieces of wood have we used in this 1-rung ladder?
How many pieces of wood have we used in this 2-rung ladder?
How many pieces of wood would there be in a 4-rung ladder?
How many pieces of wood would there be in a 6-rung ladder?
What is the largest ladder that you can tell us about?
How many pieces of wood will you need to add to a 7-rung ladder to get an 8-rung ladder?
Note: the number of pieces of wood is three times the number of rungs.
Ice-block sticks could be used to create ladders.
Problem 3: Small steps
Watch out! You need to take small steps to walk up and down these little stairs.
How many blocks are in the 4-step staircase?
How many blocks are in the 6-step staircase?
What is the largest staircase that you could tell us about?
Does this remind you of something you have done before?
Note: the count here is the same as that in Problem 1.
Problem 4: Star patterns
How many blocks are in a 4-star?
How many blocks are in a 5-star?
What do you notice about the stars?
How many blocks do you need to add to a 7-star to make an 8-star?
What is the largest star that you could tell us about?
Note: the pattern here is 1, 5, 9, 13, … At each stage you add on 4 blocks. To make a 100-star you need to have 99 lots of 4 plus one block for the centre.
Problem 5: L-shapes
How many blocks are in a 4-L?
How many blocks are in a 5-L?
What do you notice about the pattern in the L’s?
What is the largest L that you could tell us about?
Note: to make a 100-L you need 100 + 100 – 1 = 199 blocks.
Reflecting
In this session we share our findings and solutions to the problems of the previous days. We listen and look carefully as the patterns are explained. We then make some block patterns of our own which we give to our classmates to continue.
Dear parents and whānau,
In maths this week we have explored different block patterns.
Discuss the pattern with your child and see if they can continue the pattern. You may want to find some objects your child could make this pattern out of, for example, pebbles or coins.
Figure it Out Links
A link from the Figure It Out series which you may find useful is:
Data cards: Level 2
This unit introduces the students to a way of looking at information from a group of individuals, i.e. a data set.
A "data card" is simply a square piece of paper containing information about an individual person or thing. At this level, the data card is divided into three areas with the same category information in the same location on each card. In this unit, the terms data and information are used to mean the same thing and are interchanged throughout. Because several pieces of information about individuals are on each data card, different categories can be looked at simply by rearranging the cards.
This unit focuses on sorting and organising data sets, i.e. collections of information from a group of individuals. As the data set is looked at, questions or interesting things arise. This is different from starting with an investigative question then collecting data to answer the investigative question.
Understanding the difference between individual data and group data is central to the unit. The goal is to move students from “that is Jo’s data and that is me” to making statements about the group in general. Increasing students' ability to accurately describe aspects of a data set, including developing statistical vocabulary, is part of the unit. As students become comfortable with making statements and describing data, more precise vocabulary is to be encouraged. The meaning and usage of words like; same, similar, exactly and almost need to be explored during the unit along with the importance of using numerical descriptions, e.g. 2 more than, when describing or comparing data.
Investigative questions
At Level 2 students should be generating broad ideas to investigate and the teacher works with the students to refine their ideas into an investigative question that can be answered with data. Investigative summary questions are about the class or other whole group. The variables are categorical or whole numbers. Investigative questions are the questions we ask of the data.
The investigative question development is led by the teacher, and through questioning of the students, identifies the variable of interest and the group the investigative question is about. The teacher still forms the investigative question but with student input.
Data collection or survey questions
Data collection or survey questions are the questions we ask to collect the data to answer the investigative question. For example, if our investigative question was; “What native birds do the students in our class like?” a corresponding data collection or survey question might be “What is your favourite native bird?”
As with the investigative question, data collection or survey question development is led by the teacher, and through questioning of the students, suitable data collection or survey questions are developed.
The learning opportunities in this unit can be differentiated by providing or removing support to students and by varying the task requirements. Ways to support students include:
The context for this unit can be adapted to suit the interests and experiences of your students. This can happen easily in Session 4 and 5.
The te reo Māori vocabulary term pātai (question) could be introduced in this unit and used throughout other mathematical learning.
pīwakawaka, tūī or kererū?
Session One
What could “tūī” mean? What could “reading” mean? What could “Even date” mean?
Does anyone in the class fit this data card?
Do you know someone that fits this data card that is not in this class?
How many different people could this data card be correct for?
What would a data card about you look like?
Session Two
Initially encourage the students to look at one category at a time then, encourage students to look for categories within other categories, e.g. What favourite subject (reading, writing or maths) is most popular with students who like tūī?
Session Three
What do you think we will find out about our class?
Will it be mainly different or similar to the group looked at in Session Two?
Session Four
Today the students, in pairs (tuakana/teina model could work well here), will design and collect their own data using data cards. Each pair of students needs to design three data collection questions to ask other students in the class.
Sample data collection questions:
Session Five
In pairs the students are to sort and organise their data cards to look for other interesting things about the class and to see if the statements they made about the class were correct.
After a set time each pair reports what they found out about the class. This could be in the form of a written report with some sentences about what they found out, a conference with their teacher or an oral presentation to the class.
Dear whānau,
At school we have been learning about data collection. You could support your child to write 3-4 questions to survey your whānau on. These questions should have a ‘yes’ or ‘no’ answer or 2-3 options for an answer. For example, What is your favourite native bird - kererū, tūī or pīwakawaka? Ask your child to say or write some concluding statements about the data s/he collects. For example, All the people in my whānau like tūī.
Getting partial
In this unit we explore fractions of regions as well as fractions of sets. We look for, and develop understanding of, the connection between fractions and division.
Fractions are one of the first departures from whole numbers that students will see. This unit introduces a number of important concepts relating to fractions. The first of these is that fractions represent parts of one whole, and can be represented in a variety of ways including regions and sets. This makes them useful in a large variety of situations where whole numbers by themselves are inadequate.
The second useful concept is that a given number can be represented as a fraction in many ways. Knowing that fractions such as ½ can be disguised as 2/4 or 3/6, etc is important both for recognition purposes and for use in calculations.
Finally, students should know that fractions can be represented both as one whole number divided by another whole number and as points on the number line. Having a knowledge of the different representations of fractions provides connections across mathematics for students and so increases their level of understanding.
In this unit we also introduce the idea of a fraction of 100. This lays the groundwork for the decimal representation of fractions at Level 3, and percentages at Level 4. These ideas are developed further in the units Getting the Point, Level 3 and Getting Percentible, Level 4. Facility with fractions is also an important precursor for algebra. Algebraic fractions have a wide range of uses. Without a good understanding of how fractions work, students will be restricted in their work at higher levels when fractions occur in algebraic settings.
This unit can be differentiated by varying the scaffolding provided or altering the difficulty of the tasks to make the learning opportunities accessible to a range of learners. For example:
The context for this unit can be adapted to recognise diversity and student interests to encourage engagement. Consider making links between the learning in these sessions and relevant learning from other curriculum areas (e.g. number of children competing in different events at the School Athletics championship, numbers of different native birds observed in a week). For example:
Te reo Māori vocabulary terms such as hautau (fraction), haurua (half), hauwhā (quarter), haurima (fifth), hauwaru (eighth) and hautekau (tenth) as well as numbers in Māori could be introduced in this unit and used throughout other mathematical learning.
Session 1
Here we look at different representations of 1/2.
Session 2
Here we look at fractions other than 1/2 and consider ways to represent these fractions that involve 100.
Session 3
This session involves fractions in problem situations.
Session 4
Another way to represent numbers is the number line. Here we use the number line to show the relative positions and sizes of fractions.
These problems will highlight students’ knowledge of the relative size of fractions. For example, a student might find half of the distance between 0 and 1/5 to see where 1/10 should be or half the distance between 1/2 and 1 to see the location of 3/4 . The problems will also highlight their understanding of the role of the numerator (top number) as the selector of the number of parts and the role of the denominator (bottom number) as nominating how many equal parts the whole is separated into.
Session 5
Here we try to link the concepts of fractions in length and sets by dividing up a big worm.
The worm was 18 cubes long. Each bird got three cubes of worm. How many birds were there?
Dear family and whānau,
This week we have been thinking about fractions. Ask your child to explore some fractions with you. For example: take a newspaper or magazine and ask them to find the longest word that they can. How many letters does it have? Now find some words that are half that length or a third of the length or a quarter of that length. Ask your child to record the words they find and the fractions you talk about.
How many pages does the paper or magazine have? What is half that number and a quarter of that number?
We would be glad if the answers could be brought back to class so that we can discuss them.
Figure it Out Links
Some links from the Figure It Out series which you may find useful are:
Scavenger hunt
In this unit students participate in a series of scavenger hunts to develop their own personal benchmarks for measures of 1cm, 10cm, 50cm and one metre. An understanding of the relationship between centimetres and metres is also developed.
Children need to recognise the need to move from using non standard to standard measures of length. The motivation for this arises out of students comparing differences in the lengths of different objects (e.g. in the length of their hand spans). From this the need for standard measurement becomes evident.
Students also need to develop personal benchmarks with which they can measure various objects in their daily lives. Their personal benchmarks need to gradually relate more to standard measures such as metres and 1/2 metres.
Ultimately, students should able to choose appropriately from a range of strategies including estimation, knowledge of benchmarks, and knowledge of standard measures to approach various measuring tasks with confidence and accuracy.
This unit can be differentiated by varying the scaffolding of the tasks or altering the difficulty of the tasks to make the learning opportunities accessible to a range of learners. For example:
This unit can be adapted to acknowledge student interests and contexts encouraging engagement. For example:
Te reo Māori vocabulary terms such as ine (measure), mita (metre), mitarau (centimetre), whakatau tata (estimate), and paerewa (benchmark) could be introduced in this unit and used throughout other mathematical learning.
This unit is run as a series of stations over four days with students rotating around the stations in groups. The final session is run as a class activity with all students working on the same task in groups. Consider grouping together students with mixed mathematical abilities in order to encourage collaboration (mahi tahi) and tuakana-teina (peer supported learning).
The four stations involve the students looking for objects that they estimate to be a certain length. You will need to set appropriate boundaries for their search, e.g. the classroom or the playground.
As students work, the teacher can circulate amongst the groups. Points to reinforce in your discussions with students include:
How many 1 cm lengths in a metre?
How many 10 cm lengths in a metre?
Why is 50 cm sometimes called half a metre?
What is another name for a metre?
Introduce the concept of a scavenger hunt, and model how to complete the tasks at each station. Depending on the needs of your students, it may also be appropriate to model how to accurately measure items with a ruler. This modelling could be used to create a class chart or set of guidelines for measuring. In turn, this could be used to support students in practising accurate modelling skills throughout the session.
Station One
Students work in pairs or small groups to find items that they estimate to be 1cm long. They check their estimates by measuring.
Student Instructions (Copymaster 1)
Go on a Scavenger Hunt!
How accurate were your estimates?
Were your estimates too long or too short?
What would be a good way to try and remember how long 1cm is?
Station Two
Students work in pairs or small groups to find items that they estimate to be 10cm long. They check their estimates by measuring.
Student Instructions (Copymaster 2)
Go on a Scavenger Hunt!
How accurate were your estimates?
Were your estimates too long or too short?
What would be a good way to try and remember how long 10cm is?
Station Three
Students work in pairs or small groups to find items that they estimate to be 50cm long. They check their estimates by measuring.
Student Instructions (Copymaster 3)
Go on a Scavenger Hunt!
How accurate were your estimates?
Were your estimates too long or too short?
What would be a good way to try and remember how long 50cm is?
Station Four
Students work in pairs or small groups to find items that they estimate to be 1metre long. They check their estimates by measuring.
Student Instructions (Copymaster 4)
Go on a Scavenger Hunt!
How accurate were your estimates?
Were your estimates too long or too short?
What would be a good way to try and remember how long 1 metre is?
Reflecting – Class activity
At the conclusion of the session reveal the correct letters for the 1cm, 10cm, 50 cm and 1 metre lengths. Students check their answers and have a chance to measure the strips they chose as required.
Extension
Students who finish the activity early could estimate and measure the lengths of the other paper strips at the stations.
Dear parents and whānau,
This week in maths we are working on estimating lengths of up to a metre. Please help your child find any objects at home that they estimate to be 1cm, 10 cm, half a metre, and 1 m long. They can record the names of the objects and the estimations in their book. Ask them to choose one object to bring to school so we can measure it carefully to check their estimation.