This unit requires students to find relationships between variables and calculate probabilities. It is set in the context of exploring ideas related to whakataukī (proverbs).
- Find simple exponential number patterns.
- Use exponential patterns to make predictions about further members of the pattern.
- Use tables and graphs to identify relationships between two variables.
- Create rules for relationships between two variables.
- Use fractions to measure probabilities.
This unit spans number, algebra, measurement and statistics. Several important mathematical concepts are encountered:
- Relationships between variables.
Variables are measures of some feature or attribute. A variable might come from simply counting, such as finding the number of strands of spaghetti. Most variables come from measurements, such as the mass of an object or the time in seconds. Relationships are rules (functions) that connect two or more variables. For example, the number of handshakes possible in a group of five people is 4 + 3 + 2 + 1 = 2 x 5. Finding more data from different numbers of people might lead to a function rule for finding the number of handshakes, such as h = n(n-1)/2, where h is the number of handshakes and n is the number of people.
- Types of relationships
There are a multitude of different relationship types, but a few are privileged in primary and lower secondary school for two reasons; they are relatively simple and common in the real world.
- Linear relationships are called so because graphs of the relationship form straight lines.
- Quadratic relationships occur in situations where the value of one variable is related to the square of the other. Many situations in physics, such as the stopping distance of a car as a function of speed, are quadratic. The graphs of quadratics also model the paths of projectiles.
- Exponential relationships occur in situations where the value of one variable is constantly changing by a fixed ratio. Situations like population growth and bush fires can be modelled with exponential functions.
- Probability
Probability is a measure of the chance of an event occurring. Probabilities are a fraction, They are comprised of the number of favoured outcomes out of the number of possible outcomes. For example, the chance of getting an even number with one dice roll is one half since there are three favoured outcomes (2, 4, 6) out of six possible outcomes (1, 2, 3 ,4, 5, 6) and 3/6=1/2.
The learning opportunities in this unit can be differentiated by providing or removing support to students and by varying the task requirements. Ways to support students include:
- acting out many of the situations using students in the class before using more abstract representations, such as diagrams, tables, and equations. Doing favours (Session One) and relationships (Session Four) are ideal for acting out. Other sessions such as Descendants (Session Two) and Kourā (Session Five) can be modelled with physical objects
- using digital technology to support students when they are investigating the concepts in these sessions. Calculators should be used to empower students who find the calculation demands difficult. Graphing applications such as spreadsheets, and online tools, should be used, wherever possible, to afford greater attention to the concepts in play, and less attention to the technical demands of graphing. This is not to diminish the need for students to learn calculation and graphing skills at other times
- explicitly modelling the performance of important skills as they are needed. Students need exposure to models of how to use measurement tools, to choose correct units, to create tables, and use patterns to seek generalisations.
The sessions in this unit draw on a limited set of whakataukī. Several online sites provide a large range of proverbs based around themes. Whatataukī typically employ metaphors to represent a moral purpose. A useful way to adapt the contents of this unit is to encourage students to choose a whakataukī that has significance to them. They can design an experience for their peers that captures the moral purpose of the whakataukī. Investigating the proverb, and its meaning, may serve many other areas of the curriculum, particularly literature, social and pure sciences, and wellbeing.
- Copymaster 1
- Copymaster 2
- Copymaster 3
- PowerPoint 1
- PowerPoint 2
- PowerPoint 3
- PowerPoint 4
- Spreadsheet video
- Dry strands of spaghetti, paper cups, pieces of string, duct tape, scissors, paper clips, weights (e.g. coins, sinkers, washers), scales (as sensitive as possible).
Session One
In this session we consider the mathematics of relationships among people (whanaungatanga) using whakataukī (proverbs). Such relationships are important for all creatures and physical objects in the real world.
He aroha whakatō, he aroha puta mai.
If kindness is sown, then kindness you shall receive.
- Show the students PowerPoint 1. Each day Tīpene must "give a kindness" to twice as many people as he did the day before. This context could be further explored through the concept of Random Acts of Kindness, or bucket-filling.
How hard will it be for Tīpene to complete the wero (challenge)? - Let the students investigate these questions:
How many people will Tīpene "give a kindness" to on each day of the week? Remember that he starts on Monday and sees Kuia again on Sunday.
How many people will Tīpene do a kindness to in total from Monday to Sunday? Let students investigate the problem. You might allow calculator use for some students, but most calculations can be done mentally. Look for students to organise their data. It may be necessary for you to provide graphic organisers to help students organise their data. A table, like the one shown below, could be used.
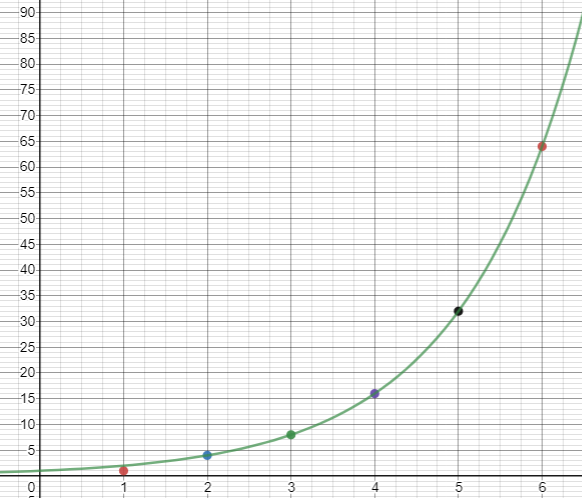
Day Monday Tuesday Wednesday Thursday Friday Saturday Sunday Kindnesses 1 2 4 8 16 32 64 Total 1 3 7 15 31 63 127 - Ask: What patterns do you see in the table that make predicting the numbers for the next day easy?
Obviously, the number of kindnesses doubles from the previous day. You might discuss students’ strategies for doubling, e.g. adding to itself or multiplying by two.
Consider: Do students notice that the total is one less than the number of kindnesses on the next day? For example, a total of 63 on Saturday is one less than the number of new kindnesses, 64, on Sunday. - Ask: What will happen if Tīpene keeps going in this way?
You might ask students to write the last few slides for Kuia and Tīpene (PowerPoint 1). Is Tīpene able to complete his mahi? Does he get to play video games?
The answer is dependent on how long Tipene takes to complete a favour. 64 favours at a rate of 30 minutes each will take 32 hours. That is longer than the number of hours available on Sunday. - Ask students to complete a graph of the number of new kindnesses related to the day number, using Copymaster 1. The graph is exponential as there is a constant ratio of two between consecutive terms, e.g. 32 is twice 16 and 32÷16=2.
- Ask questions that relate to specific points on the graph, such as:
On what day did Tīpene give 16 kindnesses?
How many kindnesses did Tīpene give on Saturday (Day 6)? - Discuss other phenomena in the real world that grow exponentially. The number of people in Aotearoa has grown exponentially since 1858, allowing for the impact of wars and influenza. Graphs are easily accessed online. Spread of diseases like Covid-19, growth of funds in a bank account, and uptake of mobile phone technology are other good examples of exponential growth. The ratios in these examples are seldom as tidy as two.
There are about 5 million people in Aotearoa/New Zealand.
How many days would Tīpene need to do kindnesses for, so everyone received a gift from him?
Of course, he could never physically do that many kindnesses! - Allow access to calculators and computers. A spreadsheet is an effective tool for continuing the above table until a total number of 5 000 000 people is reached. The problem can be solved algebraically but that is beyond students at this level. It would take Tīpene between 22 and 23 days to reach a total of over 5 million kindnesses.
- Depending on the interest of your students you might explore questions like:
- What would happen if Kuia asked Tīpene to treble the number of kindnesses each day?
- How many days would it take him then to "give a kindness" to every New Zealander?
- How could Tīpene use other people to pay kindnesses to each other so he does not end up with an impossible task? (Search for the trailer to Pay It Forward online)
- What is the major problem with the population of the world growing exponentially?
Session Two
The next investigation is an extension for capable mathematicians. This session could be adapted to look at a different native bird which may be more relevant to your local context. Another whakataukī that can be used to illustrate exponential growth is:
Mēnā ka tiakina te kiwi he maha ngā uri
If protected, the kiwi has many descendants
- Use PowerPoint 2 to introduce the problem. We have about 68 000 kiwi left but lose 2% of the unprotected birds each year, mainly due to other introduced animals like pigs, dogs, cats, stoats and rats. Female kiwi generally only lay only one egg in a clutch (litter) though the brown kiwi can lay 2-3 eggs. Being slow breeders puts the kiwi in danger of extinction. Preserving our native animals is an important aspect of kaitiakianga (guardianship). Care for the environment is also an important component of te ao Māori as it is for cultures throughout the world.
Let’s assume there are only 50 fertile female kiwi left in New Zealand and they are all protected. There are also 50 fertile male kiwi as well. Half of the chicks that hatch are male and half are female. Let’s say a female begins laying in her third year of life and she lays two eggs per year for 15 years. Find a way to predict the number of kiwi alive after 15 years, if we protect them all. Start the students off by considering the first three years. Draw a table like this and discuss as you fill it in:
What will the table look like at the end of Year 1? Look for students to interpret the conditions and suggest the appropriate numbers to go in the table.
Discuss why the table doesn't have columns for males (half the chicks are female and half are male, so you can just double the female population to find the total population).Year Breeding females Females born this year Young females Total females Total population 1 50 50 50 100 200 Ask students to create their own table and extend it.
What will the table look like at the end of Year 2?Year Breeding females Females born this year Young females Total females Total population 1 50 50 50 100 200 2 50 50 100 150 300 Ask them to extend their table for the third year.
Why will the table get more complicated in Year three? The 50 young females from Year 1 will start to breed.
Students should apply the condition that new females lay eggs in their third year of life.Year Breeding females Females born this year Young females Total females Total population 1 50 50 50 50 200 2 50 50 100 150 300 3 100 100 150 250 500 - If 100 more females were born this year, why are there only 150 young females? (The first 50 chicks are now old enough to breed.)
- Ask your students to create a spreadsheet to model the growth in the kiwi population for 15 years. Encourage them to use formulas and then fill down the columns. Click to download an example spreadsheet.
- Breeding females = the number of breeding females from the previous year plus the number of females born two years previously
- Females born this year = the number of breeding females
- Young females = the females born this year and the previous one
- Total females = the number of breeding females plus the number of young females
- Total population = double the number of females
- Discuss what the spreadsheet shows.
How many kiwi would there be after 15 years?
The spreadsheet shows that if totally protected, 100 kiwi would become over 150 000 in 15 years. It is an impressive result but shows that conservation efforts can have dramatic effects. - Discuss any false, or unrealistic assumptions that have been made for this exercise:
- It assumes that no kiwi die
- It assumes that all of the 50 breeding females at the start continue to breed for the full 15 years
- It assumes that all females of breeding age breed successfully every year.
- Students might also be interested in the famous survival story of the Chatham Island black robin.
https://www.nzonscreen.com/title/seven-black-robins-1981
https://youtu.be/MUgpl5X6_xo - Students might also be interested in the effect of changes to the conditions. For example:
What happens to the population prediction if 10% of kiwi die of natural causes each year?
What happens to the population prediction if the fertility rate changes from two eggs per year to three?
Session Three
Whiria te tangata
Weave the people together.
- Discuss the whakataukī. What do your students think it means? It is usually interpreted to mean “Unity is strength.”
Do you know of situations where unity works? - Students might suggest situations like friends sticking together to achieve a task or confront a threat, or when many people worked together to change views on an issue. Cyclists and runners work together in a pack to make the task easier (less drag). Animals also work together, e.g. birds fly in a formation. A search for “meerkats strength in numbers” will return videos where the meerkats collectively ‘see off’ a cobra.
A related whakataukī is:
Mā tini mā mano ka rapa te whai.
By many, by thousands, the work will be accomplished (Many hands make light work). - Show students a single strand of spaghetti.
Imagine this strand of spaghetti represents the strength of a single person. A single strand may not be strong, but many strands working together may hold a lot of weight. - Use Slides One to Nine of PowerPoint 3 to introduce the experiment. Discuss what is meant by tensile strength (the ability of an object to withstand stretching force).
For this experiment, each group of students will need:
Dry strands of spaghetti, paper cup, piece of string, duct tape, scissors, paper clip, weights (e.g. coins, sinkers, washers), scales (as sensitive as possible). - Let students carry out the investigation in pairs or threes. Encourage them to record their data systematically and use it to make predictions.
- Do students test the tensile strength consistently or are there variations to the conduct of the experiment? (Concept of fair testing)
- Do students measure the mass required to break the spaghetti correctly and interpret the measures? (e.g. 183 grams)
- Do students create tables of data and use patterns to make interpolations and extrapolations from the known data?
- After a suitable period, bring the class together to share results. You might use Slides ten and eleven of PowerPoint 3 to show some data presented as a scatterplot.
What is represented on each axis? (x axis shows the number of strands of spaghetti (independent or explanatory variable) and the y axis shows the mass in grams upon breaking (dependent or response variable))
Is there a linear relationship between the two variables? (The first graph suggests linear but the second does not) - Discuss the line of best fit (regression line) as going through the centre of the data. Students might enter their own data into a spreadsheet, or online graphing tool, and get the software to calculate the line of best fit.
- Return to the whakataukī.
Whiria te tangata
Weave the people together
What does the experiment suggest about the importance of unity?
Session Four
Another whakataukī about relationships is:
Ehara taku toa i te toa takitahi, engari he toa takitini
My strength is not from myself alone, but from the strength of the group.
This whakataukī is about the fact that part of the strength of a group is the number of interpersonal connections that can be made. The relationship between the size of the group and the number of connections is not linear.
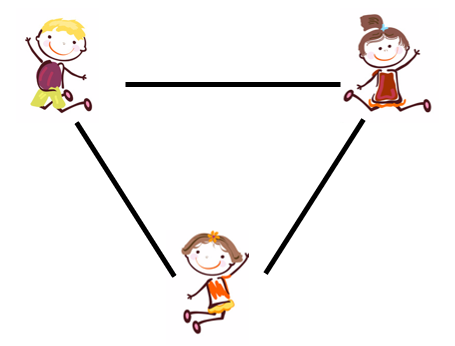
- Go outside to a concrete area where you can draw with a piece of chalk. Ask three students to stand as the corners of an equilateral triangle. Ask another student to draw all the possible two person relationships among the three students. Three relationships are possible.
How many two person relationships are possible with five people? - Let students talk in pairs to create a prediction. Some students may think that five relationships will be possible since three were possible with three people. Form a regular pentagon with five students and get another student to draw all the two person connections.
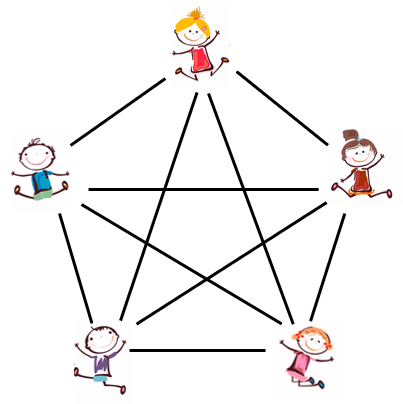
What shape is formed by the connection lines? (a pentagram inside a pentagon)
What is the total number of two person connections? (10)
How many connections does each person make? (Four)
If 5 x 4 = 20, why are there only ten connections? (Each connection can be in two directions, A to B and B to A) Go inside and provide the students with Copymaster 2. The investigation aims at finding a general rule for the number of two person connections with n people. After a suitable time, gather the class to share their ideas.
The completed table should look like this:Number of people 1 2 3 4 5 6 7 8 Number of connections 0 1 3 6 10 15 21 28 - Discuss patterns in the table. Ideas might include:
- The differences between terms in the bottom row increase by one each time, i.e. 0 + 1 = 1, 1 + 2 = 3, 3 + 3 = 6, 6 + 4 = 10, …
- Each number of connections is the sum of connections for the previous number of people and the previous number of people, e.g. 10 = 6 + 4, 28 = 21 + 7. This rule can be written recursively as Tn=T(n-1)+(n-1).
- Each number of connections is half of the number of people multiplied by the number of people less one, e.g. 15 equals 1/2 × (6 × 5), and 21 equals 1/2 × (7 × 6).
- The last pattern can be expressed as a general rule: “Take the number of people, multiply it by one less than the number of people, then halve the result.”
- Algebraically this rule can be written as c=p(p-1)/2, where p represents the number of people and c represents the number of connections.
Why does the rule involve multiplying the number of people by one less than the number of people? (Each person can connect with each of the other people in the group)
Why is the number of connections halved? (Each connection is counted twice) - To extend the ideas further you could:
- Work on the unit called The truth about triangles and squares.
- Investigate a different pattern in the connections within a group of people between ‘distant’ friends. Suppose five people stand as corners of a pentagon. Each person connects only to those people not immediately next to them. The connections would be:
This is like finding all the diagonals of a polygon.
Imagine six people. The distant friend connections are: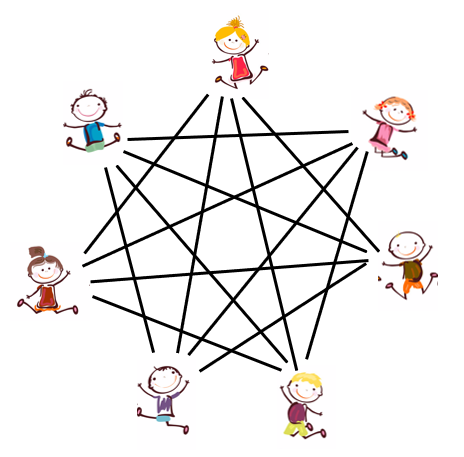
Each person has p - 3 = 4 connections to distant friends. That makes 7 x 4 = 28 one-way connections. Half of 28 equals 14, the number of two-way connections.
In general, if p represents the number of people, then the number of connections, c, is given by c=p(p+3)/2. Note that recording the relationship algebraically is usually attempted at higher levels.
Session Five
In this session students confront their bias towards subjective judgement in situations involving chance. A good example of subjectivity is that students often believe that six is harder to get on a standard dice roll, than the other numbers one to five. Researchers believe that this bias is linked to games where it is crucial to roll a six, e.g. to escape jail in Monopoly. The urgency of getting a particular outcome affects people’s perceptions of how easy it is to get that outcome.
- Begin with this traditional whakataukī:
He manako te kōura i kore ai.
There are no crayfish as you set your heart on them. - Ask: What do you think this whakataukī means?
- Let students share their interpretations. The proverb means that trying too hard to get something you want can be counter-productive.
I have a normal dice here. My Kuia (Grandmother) says if I do all my mahi I can roll this dice. If it lands on ono (six) I get crayfish for tea. Is that likely to happen? - Discuss the likelihood of getting ono (six). Take a poll. Let students choose which number they think will come up. Discuss the poll results. For example:
| Tau | Tahi (1) | Rua (2) | Toru (3) | Whā (4) | Rima (5) | Ono (6) |
| Frequency | 5 | 3 | 6 | 4 | 7 | 2 |
- Look for patterns in the table. Is ono the least popular choice? Why? Why not?
Example:
Why do so many of you think tahi, toru or rima are most likely, and I won’t get crayfish? - Roll the dice once to see what happens.
Is it just luck, or can I say what my chance of getting crayfish is?
In the case of a single dice six outcomes are possible; 1, 2, 3, 4, 5 or 6. My desired outcome, ono, has a ‘one out of six’ chance of occurring. You might go to one of the many dice simulators online and look at what occurs with a sample of 120 dice rolls. If students have digital devices each member of the class might carry out 120 virtual rolls. - Are the distributions (shape of the data) the same for everyone? Why? Why not?
- Show the students how to play ‘Kōura Deal or No Deal.’ This is a gameshow from overseas simplified with a kiwi flavour. The object of the game is to get as many kōura (crayfish) as possible to feed your whānau.
Will you find a way to get what you desire? – lots of crayfish!
Or will the whakataukī prove correct?
Using Copymaster 3 students cut out many paper kōura. Students also need opaque plastic cups, labels A, B, C, D, E for the tops of the cups, and cards labelled 0, 1, 2, 4, 8, also made from Copymaster 3. You might use Slide One of PowerPoint 4 to illustrate the game. Without the PowerPoint on show you can edit the slides which includes moving them around.
There are two people in the game, the guest and the host. A turn goes like this:- Host offers the guest a number of kōura to quit the game, e.g. “I offer two kōura.”
- The guest either accepts the offer or plays on by choosing a cup, e.g. “I choose C.”
- The cup is turned over to reveal how many kōura (counters) are under it (Scallop number card). That cup and the matching number card are removed. The game finishes either when the guest accepts an offer and gets the offered number of kōura (paper), or there is one cup remaining. In that case, the number of kōura under the remaining cup is the prize.
- Let students play the game. Ask them to swap roles between guest and host consecutively. Remind them that when they are the guest their objective is to get as many kōura as possible. As the host, their role is to minimise the number of kōura they give away. Students should keep track of how many kōura they win.
- Look for these features:
- Do students use subjective judgement to make their decisions? ,e.g. “I am always unlucky so I will take the offer.”
- Do they consider the probability of losing or winning when making their decisions, when either choosing or offering.
- Do they make offers that are close to the average of the numbers of kōura left?
- After a suitable time gather the students to discuss the strategies they used to maximise the number of kōura. In a sense, there are no right or wrong decisions since this is a game of chance. Expect students to note that their decision depends a lot on what happens previously. This is called conditional probability, when a previous event impacts on the probability of a future event.
What are your chances of picking four cups in a row that leave only the eight kōura? (one fifth)
What are your chances of getting at least two kōura? (three of the five cups cover two or more kōura, so the chances are three fifths. - Use Slides Two to Four of PowerPoint 4 to discuss what decisions should be made in different scenarios. In each case ask:
Would you take the offer, or play on? Why? - With each slide you can simulate the game continuing, assuming the offer is declined. Exiting the show on the PowerPoint allows you to move cups to reveal how many kōura are underneath. Scallop number cards can also be removed.
- With each scenario discuss:
What are your chances of getting more than what is offered, if you play on?- On Slide Two there is a one third chance of getting four kōura, but a two thirds chance of getting two or more kōura.
- On Slide Two there is a one half chance of getting more than the offered number of kōura. Is it worth the risk?
- On Slide Three there is a one quarter chance of getting more than the offered number of kōura. However, there is a three quarters chance of eliminating one of the low numbered rocks in your next turn. Do you take the risk?
Is the offer reasonable? Explain why.
- Try to determine a way to decide if the offer is reasonable. Should the offer be the average of the numbers left? Should it be less than the average? (In the actual game show offers are much less than the average in the early rounds.)
- Return to the original whakataukī. Do you think this whakataukī is true? Does wanting something badly make it less likely to happen?
Dear family and whānau,
This week we have been exploring whakataukī, Māori proverbs. Whakataukī have symbolic meaning and offer wisdom about how to behave appropriately towards others and to care for our environment. The week we explored the importance of connecting to other people, of conserving wildlife, of finding strength in numbers, and not wishing too hard for things that are hard to get. Do you have proverbs that are special to your family? If you would like to, you could send these to school for us to share in the classroom.