All lessons in this unit follow the same sequence of phases as given in the diagram above. A poster of the phases is provided as Copymaster 1 for students to refer to. The notes suggest possible student ideas and teacher reactions to those responses. It is not feasible to anticipate all ideas students might give so you are encouraged to be flexible in how you respond to students rather than ‘teach’ the sample ideas and representations provided.
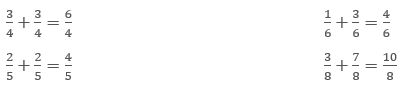
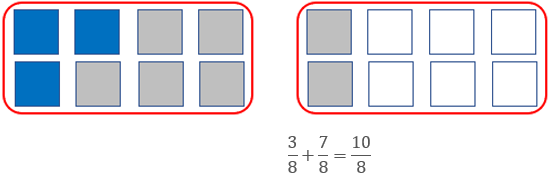
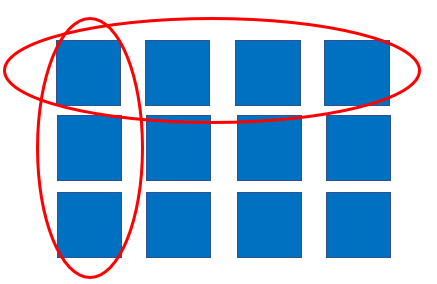
PowerPoint 1 gives the equation sets that drive the unit. The sets are labelled in the top left corner of each slide for reference. Slide One has the first pattern to look at. The pattern involves the addition of fractions with the same denominator i.e., 1/b + (b-1)/b = 1, 1/3 + 2/3 = 1. These patterns will be, relatively easy for students to represent. Slide One can be used as an example to familiarise students with the approach. Be aware that students’ existing schemes for addition of fractions may be incorrect, e.g., they may simply add across the numerators and denominators:1/4 + 3/4 = 4/8.
Equation Pairs Set One
Noticing Consistency
Use ‘think, pair, share’ by inviting students to look independently at the four examples, work out the missing values, then share their ideas with a partner. In the class discussion expect students to express their observations in ways that are clear to others. Students should re-express their ideas if others do not understand what they are saying. You may need to remind students that the ‘something going on’ relates to all four examples, not just one. Expect responses like:
S: The first fraction always has one on the top line.
T: Can you tell us more? What is the denominator, the bottom number?
S: The bottom numbers, denominators are different in each equation.
Discussion opens the possibility of using correct mathematical terms, like numerator (number above the vinculum), and denominator (number below the vinculum).
S: The sum (answer) is always one.
T: All four equations have a sum of one? What about the top right equation?
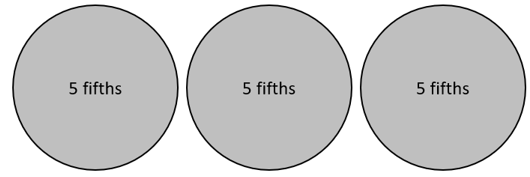
S: The sum is five fifths. Five fifths make one whole.
Making a claim
Encourage students to state a claim about what is going on with all four examples in Pattern One. They might do so individually at first then work in a small team to refine their ideas and the way they express those ideas.
Expect ideas like:
- If the denominators of the fractions are the same, and the numerators add to the denominator, the sum is one.
- If the two numerators add to the denominator, then the sum is one.
Your aim is for students to express their claims in clear, minimal terms, using correct mathematical language. For example, ‘the top numbers’ is not as clear as ‘the numerators’, and ‘add to’ is not as precise as ‘the sum of’.
Representation
In this phase, students choose representations to show why the pattern holds consistently. Students might choose physical manipulatives, such as fraction strips or circles, draw diagrams such as strips and circles, and use contexts from everyday life, such as sharing cakes or pizza. Encourage students to begin with the first two examples of equations then consider how the same relationships might generalise to the last, and other similar, equation pairs.
Examples might be:
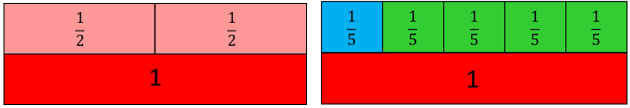
- I made 1/2 + 1/2 = 1 using fraction strips then I made 1/5 + 4/5 = 5/5 . Five fifths make one, so I put a one strip below.
- S: I used fraction circles to show that 1/8 + 7/8 = 1 and 1/3 + 2/3 = 1.
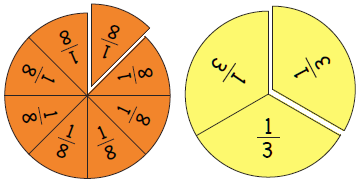
Some representations are less helpful than others in terms of understanding the structure of the fractions that add to one. Circles are useful for showing that one is complete. Strips may make the iteration of unit fractions more obvious. Strips are also easier for students to draw, and divide up equally. Ensure your students have experience with a mix of circle and strip fraction models. It is important for students to recognise that the denominator in each example defines the size of the equal parts that one is cut into. For example, eighths are created by the equi-partitioning of one into eight parts, so eight of those parts make one. Your questioning is important to support students to connect the symbols and other representations.
- Explain where the eighths are in your representation.
- How many eighths are needed to make one?
- Where is the seven, in 7/8 represented in your diagram/model?
- How does your representation show that the sum is always one?
Argumentation
In this phase students are asked to formalise their noticing by creating a statement that generalises to all cases. The discussion may start with a specific equation pair but must be amended so that it accurately represents the general pattern.
S: With 1/8 + 7/8 = 1 the numerators add to eight. Eight eighths equal one.
T: So how does that work in the same way with the other equations?
This might lead to expressing the relationship in general terms.
S: The first numerator plus the second numerator add up to the denominator.
T: If we gave names to the numerator and denominator of the first fraction, like a and b, could we express the property more simply?
Some students might experiment with algebraic notation such as a/b + c/b = 1. Note that this statement is incomplete since it misses the necessary condition for a + c = b.
T: Do we need to say something about a and c?
S: We could just write a + c = b.
T: Give us an example of that.
S: If b = 3, the numerators 1 and 2 add to 3.
Though it is difficult for this level, increased sophistication is evident in a + c = b, and writing the generalisation with only two variables, a/b+ (b-1)/b = 1. It is also important to note that b/b = 1, for any whole number value of b, except zero. b can also be any integer, since rational numbers are of the form a/b, a and b∈ I, that is a and b must be integers. High achievers should be challenged to express their generalisations using algebra. You may need to support them to develop the coding strategies to do that.
Equation Pairs Set Two
If time permits in the first lesson, ask the students to approach the second equation set more independently. From this point each equation set is discussed succinctly using the phases of the approach.
Noticing consistency
The four equations apply the addition of fractions with the same denominator. Students need to recognise that the denominators in both addends and the in sum are the same. Watch for students incorrectly applying whole number addition, that is, adding both numerators together and adding both denominators together. The completed equations should be:
Note that ten eighths equals 1 2/8 = 1 1/4
Making a claim
In natural language expect the students to use phrases like “you just add the top numbers”. Introduce important vocabulary such as numerator, denominator, addend, and sum to clarify which numbers are being referred to in the claims. If the claim is restricted to one example, encourage students to see what changes and what stays constant across the other three equations. The aim is to broaden the claim to the equivalent of “If the denominator of both addends is the same, then the numerator of the sum is the sum of the numerators of the addends.”
Representation
Expect both physical and diagrammatic representations to be used. A fraction strip representation might look like this:
Diagrams of a ‘sets’ representation can be used but it is unwise to use sets at this point (See the diagram below). The changing whole can be confusing, since the aim is to generalise a relationship for all examples.
Whatever representation is chosen by students they need to be clear about the referent one, be it a length, area, or set. The sum must be defined in terms of that original one whole.
Argumentation
Look for students to justify that if the denominators of two addends are the same then the sum is the sum of the numerators, over that denominator. Algebraically that is represented as:
a/b + c/b = (a+c)/b
Note that a, b, and c are variables, and the generalised argument becomes clearer, and is confirmed, by translating values from the equations back into the general form.
For example, with 3/8 + 7/8 = 10/8, a = 3, b = 8, and c = 7.
An interesting discussion point is whether this is any different to addition of whole numbers. For example, 3 + 7 = 10 is the combining of 3 ones and 7 ones, making 10 ones. The ‘ones’ are regarded as the same unit. With 3/8 + 7/8 = 10/8, eighths are the units being combined.
Developing the process further
PowerPoint One contains seven equation sets. The sets might form the basis of a week-long unit. The phases for each equation set are described succinctly below.
Equations Set Three
Noticing consistency
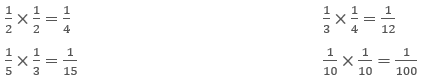
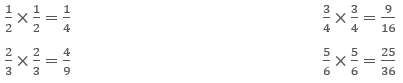
The four equations both demonstrate the multiplication of unit fractions, that is fractions with one as the numerator. Understanding in general that 1/b × 1/d = 1/bd, e.g. 1/3 × 1/4 = 1/12, is fundamental for understanding equivalent fractions.
Making a claim
In natural language, expect the students to use phrases like “multiply the two denominators and you get the denominator of the answer”. Expect the use of mathematical vocabulary such as factor and product to clarify which numbers are being referred to in the claims. Encourage clarity by asking questions like:
- Do the denominators of the factors need to be the same?
- What can you say about the numerators?
The aim is to state the claim as something like “The product of two unit-fractions is a unit fraction, with a denominator that is the product of the denominators.”
Representation
Expect both physical and diagrammatic representations to be used. Fraction strips are static representations:
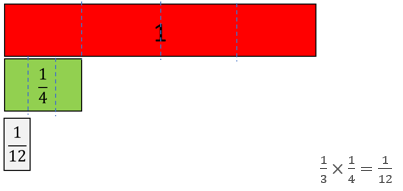
Folding a paper strip or a rectangle is a dynamic representation:
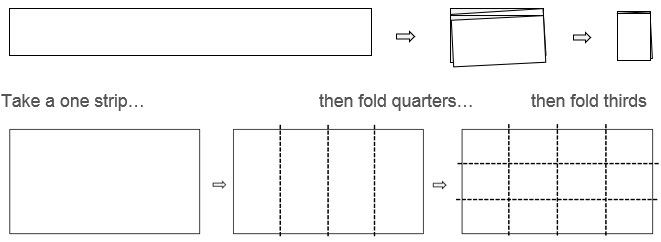
A sets model may be used but the product needs to be known to establish the possible numbers of objects in the set. Therefore, identifying the referent one is more complex.
Argumentation
Look for students to state the condition that both addends are unit fractions. The starting product might be expressed as 1/b × 1/d. The product is 1/bd. Students should explain why the relationship occurs. Their explanation needs not be in formal algebraic terms, with letters as variables.
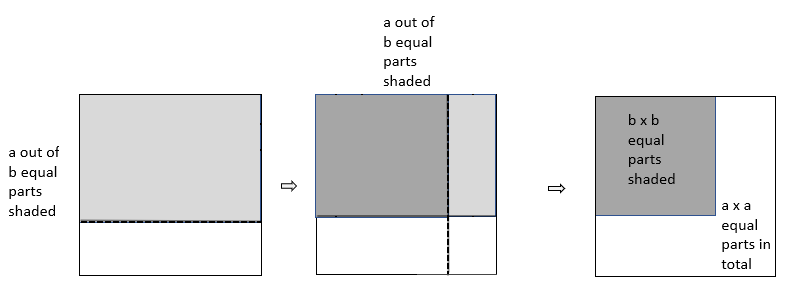
The second factor gives the first equal partitioning and creates some parts. The denominator gives the number of equal parts. Then each part is split into equal parts. That number of parts is given by the denominator of the first factor. Therefore, each of the d parts, is equally partitioned into b parts, so the total number of parts equals b x d.
Equation Pairs Set Four
Noticing consistency
The four equations apply equivalence of improper fractions. The equivalent number is kept at three to limit variation.
Making a claim
In natural language expect the students to use phrases like “the answer is always three.” Some students might indicate what they see in a diagram.
Expect the use of mathematical vocabulary such as denominator, numerator, fraction, equivalent, and whole number to clarify which numbers are being referred to in the claims. Encourage clarity by asking questions like:
- What does the equals sign indicate? (both numbers represent the same amount)
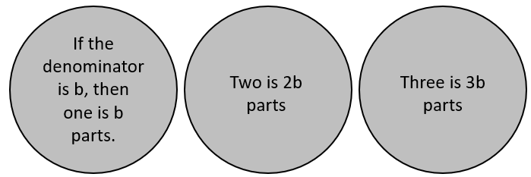
- How is the numerator related to the denominator? (the numerator is the denominator multiplied by three)
- Why is the number on the right side always three? (For example, with 24 eighths you can make three ones because you need eight eighths to make each one.)
The aim is to state the claim as something like “A fraction that has a denominator that divides into the numerator three times, is equal to three,” or “A fraction that has a numerator that is three times the denominator, is equal to three,”
Representation
Fraction circles are useful in demonstrating the completeness of a one.
Eight eighths make one. With 24 eighths you can make 24 ÷ 8 = 3 ones.
Students may develop more schematic ways to represent the connection between numerator and denominator.
Five fifths make one so 15 fifths must make three, since 3 x 5 =15
Argumentation
Look for students to justify, using words of diagrams, that the denominator of a fraction specifies the number of equal parts that make one. For example, in 12/4 the parts are quarters, four of them are needed to make one. Dividing the numerator by the denominator finds how many ones can be made. With 12/4, 12 ÷ 4 = 3, so three ones can be made. The equation 12/4=3 represents that equivalence.
For all four equations define the denominator of the first fraction as the variable, say b. The observation that the numerator is always the denominator multiplied by three can be represented as 3b/b. The equivalence can be written as 3b/b=3.
Arguments may be supported by graphics or other representations.
Students might also generalise that dividing the numerator by the denominator tells how many ones can be made, and the remainder becomes the fraction part of the mixed number, e.g. 13/5 = 2 3/5.
Equation Pairs Set Five
Noticing consistency
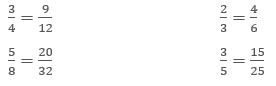
The equation set applies equivalence, that is when two fractions represent the same value. Understanding equivalence is essential to ordering fractions by size and to the addition and subtraction of fractions. The completed sets should be:
Making a claim
In natural language expect the students to use phrases like “If the numerator is three times the other numerator, then the denominator must be three times as well.” Students tend to notice patterns across the equation like this:
Expect the use of mathematical vocabulary associated with fractions, particularly numerator and denominator. Draw students’ attention to the equals sign as representing the same value on both sides. Students are most likely to see equals as a signal to work out the answer. Encourage clarity by asking questions like:
- What is the same about all four equations?
- What is different?
- How are the numerators related?
- How are the denominators related?
The aim is to state the claim as something like “Two fractions are equivalent, if the one numerator is a multiple of the other, and the denominator is the same multiple of the other.”
Representation
Static representations might involve length, area (circles or rectangles), or sets.
A more dynamic representation is to fold a paper strip or rectangle into thirds, shade two thirds, then fold the thirds in half. How many sixths are shaded?
Argumentation
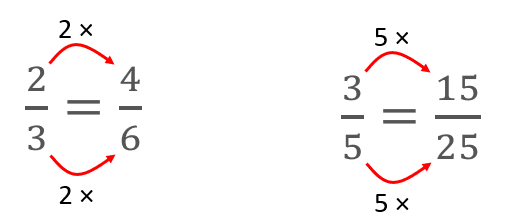
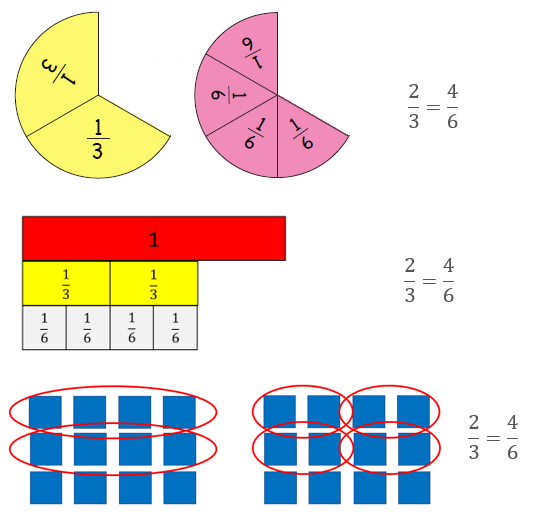
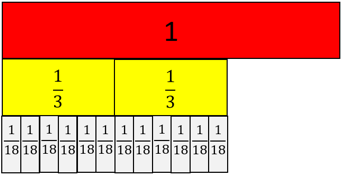
Look for students to justify, using words of diagrams, that the same multiplication is performed on both the numerator and denominator of a fraction to create an equivalent (same value) fraction. For example, if the numerator and denominator of 2/3 are multiplied by six this gives 12/18, and 2/3 = 12/18. Of interest is that the multiplier 6/6 is another name for one, the identity element for multiplication. 2/3 x 6/6 = 12/18 is the same operation as 2/3 x 1 = 12/18.
However, the multiplication means different things for the numerator and denominator. Multiplying the numerator by a number increases the number of parts by that factor. For example, 12/18 has six times as many parts as 2/3. For the denominator the effect is the inverse. Each part in the new fraction is one sixth that of the first fraction, since six times as many of those parts make one. For example, 12/18 has parts that are one sixth the size of the parts in 2/3.
In general, the transformation a/b × n/n = an/bn, gives n times as many parts but each part is one nth the size. a/b and an/bn represent the same quantity. Note that n/n is always equal to one.
Equation Pairs Set Six
Noticing consistency
The equation set highlights the difference of unit fractions. Note that the denominator of the first fraction is one less than that of the second. This equation set provides an opportunity to apply equivalence. The completed sets should be:
Making a claim
In natural language expect the students to use phrases like “the difference has a denominator that is the product of the two other denominators.” Ask students to be more specific in their description.
- What can you say about the two fractions on the left of each equation? (They are both unit fractions and there is a difference of one in their denominators)
- What does subtraction mean in these equations? (It means "What is the difference between the two fractions? ")
- Can you make up another equation that would go in this set?
The aim is to state the claim as something like “If two unit-fractions have denominators that are one different, the difference of the fractions is the unit fraction with the product of the denominators as its denominator.”
Representation
Students are likely to use specific examples to convince others about how the relationships work. Fraction strips are probably the most useful representation.
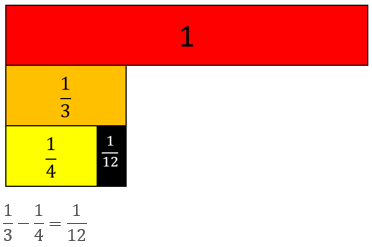
It is important for students to consider why the fraction one twelfth fits exactly.
Argumentation
Students need to apply equivalence to argue why a given unit fraction is the difference. Their argument might begin for a specific example.
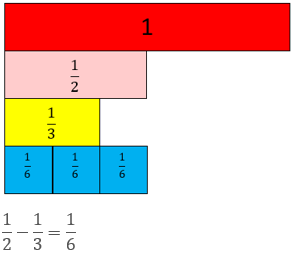
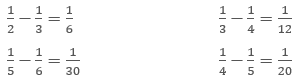
Since one half and one third are involved, the difference must involve sixths, as both one half and one third can be renamed as ‘so many’ sixths. 1/2 = 3/6 and 1/3 = 2/6 so there is a difference of one sixth.
Encourage the students to generalise by naming the denominator of the first fraction as a variable again.
- Can you find a relationship that applies to all four equations?
If the first fraction is 1/b, the second is 1/(b+1), and the product is 1/(b(b+1)). Algebraic notation, like this, is not expected at Level Four, but students may invent their own ways to express what they notice. Whatever notation students create, it can be checked by substituting numbers in place of symbols, and seeing if the equations created belong in the set. This could be done as a paired activity, and could be used to encourage tuakana-teina.
Equation Pairs Set Seven
Use set seven as an opportunity to see how well students engage in the generalisation process independently. Ask them to record their claims, representations, and arguments in ways that work for them. Some students may prefer writing their work while others may prefer to capture their ideas using a digital recording.
Noticing consistency
The equation set highlights the multiplication of fractions, that is a fraction of a fraction. The numerators of the factors are the same, as are the denominators. That is done to reduce variation. The completed sets should be:
Making a claim
In natural language expect the students to use phrases like “It is a fraction multiplied by itself. The product is the two numerators multiplied over the two denominators multiplied.” Ask students to be more specific in their description, through questions like:
- What do you notice about the two factors (fractions being multiplied)? (they are the same)
- Do you know a mathematical term for a number multiplied by itself? (square of the number)
- Can you use the term square to describe the product fraction in a simpler way?
The claim, using mathematical language, might be something like, “If a fraction is squared, the product is the numerator squared over the denominator squared.”
Representation
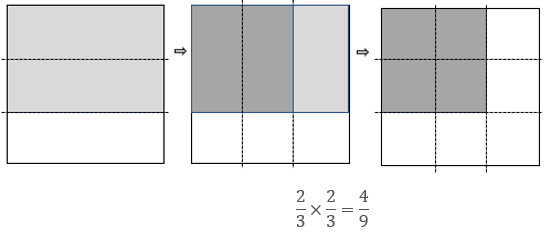
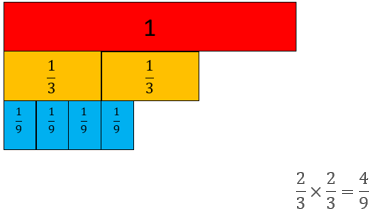
An area model is useful since it illustrates the relationship between a number multiplied by itself and a square. Folding and shading squares of paper works well.
Students might also use strip models, but the squaring of numerators and denominators is not obvious.
Argumentation
The equations include two variables, that is the value of numerator and denominator in the fraction being squared. Students need to recognise that the denominator names the number of partitions of one. The numerator names the count of those parts.
Students may be able to show how they are thinking with variables (lack of closure), by treating the numerator and denominator as variables in an area diagram.
Algebraically this might be written as a/b × a/b = (a×a)/(b×b) or more succinctly as (a/b)2 = a2/b2.
Time zones
This unit introduces and explores 24-hour time and time zones.
In this unit students learn that clock time varies around the world. For example, the same moment in time is read as 7:35pm in New Zealand, 5:35pm in Melbourne, Australia, and 6:35am in England, since in summer NZ is on daylight saving time. In fact, what to call a moment in time is arbitrary so nations adopt calibrations (setting of clock times) to suit the lifestyles of citizens. The Earth rotates 360⁰ every 24 hours (roughly) meaning that while it is daylight on one side of the Earth, it is night on the other side, excluding locations close to the North and South poles.
It is generally accepted that 12 noon is midday, halfway between dawn and dusk, the rising and setting of the sun. Therefore, midday occurs at different time points around the globe, based on the longitude of the location. The clocks of time zones are calibrated so that 12 noon is at the midpoint of dawn and dusk in that country. Large countries have multiple time zones, that is points at which the clock reads midday, e.g. Australia has three time zones, Russia has 11 time zones.
With the advance of communication technology and air travel, students’ lives are likely to be affected by time zones. Suppose you book a flight from Auckland to Perth. It leaves at 11:10am and arrives at 1:35pm on the same day. That seems like a flight time of only 2 hours and 25 minutes. It is hardly worth buying the entertainment and meal package. It turns out that the flight takes 7 hours and 25 minutes. That is because Auckland time is five hours ahead of Perth time. When you leave Auckland at 11:10am, the time in Perth is 6:10am.
Communicating by email, video call or phone with someone in another part of the world requires you to know the time zones. England is 13 hours behind New Zealand time. If you video call a friend at 7:00pm New Zealand time you will wake them up at 6:00am England time.
The International Date line is another complication. The line lies longitudinally between New Zealand and Samoa. It is the line created to separate one calendar day from the next. When it is Wednesday in New Zealand it is Tuesday in Samoa. It is possible to fly three hours from Auckland to Apia and arrive 20 hours before you left.
The learning opportunities in this unit can be differentiated by providing or removing support to students and by varying the task requirements. Ways to support students differentiate include:
Differentiation is about altering activities to meet the interests of your students to enhance engagement. Since most activities are focused around international and domestic travel it is easy to choose contexts relevant to your students. For example, students might be engaged by the idea of planning a holiday to Samoa, India, or Korea, Los Angeles or the United Kingdom. It is important that you use this unit to further students’ world view as well, and explore locations they may be less familiar with. This learning can also be linked to the science contexts of learning about latitude and longitude, and the solar system.
Early navigators who travelled to New Zealand used the stars to navigate across the Pacific Ocean. Later, Lieutenant James Cook sailed to New Zealand and used the stars to calculate latitude and longitude. As a result, he was able to map New Zealand. You might choose to frame the learning in these sessions around the context of understanding how early Maori people used traditional knowledge to navigate, keep time and create maps. You could also investigate early methods used to travel between New Zealand and different islands.
Session 1
In the first session we introduce the idea of time zones using a globe and by making a phone or internet call. If possible, before teaching Session 1 find an international audience to connect with (e.g. a classroom of students or whānau living in Australia. If possible, arrange to call them during this session.
Imagine that the globe is the Earth and the torch is the sun. How do the sun and Earth move in relation to one another?
Students should suggest that the Earth orbits the sun.
How long does that take? (a year or 365¼ days)
Ensure that students know that the Earth rotates on its axis.
How long does a full turn take? (24 hours or one day)
Discuss what you can see with a classmate. What does this mean for people and animals living on the Earth?
Out of the discussion students should express the idea that when we are in daylight there are some places in the dark. All places, except the polar regions in summer and winter, undergo day and night in a 24-hour period. You may need to fix a blob of Blu Tack on the globe at the location of your school, and another blob at a location in another country.
What time is it in each place?
Stop the rotation in a position when the sun is shining directly at New Zealand.
What time will this be in Aotearoa? (12 noon unless it is Daylight Savings, the time will be 1:00pm)
Think about the time in these locations:
Sydney (two hours earlier)
Samoa (one hour ahead which becomes 23 hours behind due to the International Date Line)
Shanghai (5 hours behind)
London (12 hours behind)
New York (6 hours ahead which becomes 18 hours behind due to the International Date Line)
Ask the students if they have whānau living overseas, or if they or someone from their whānau have visited other countries. Think about the time in those locations. What is the time difference between those places and Aotearoa?
Talk to a classmate about what you notice on this map of the world. Be ready to explain what you see to everyone else.
Let students use the map.
Why does Australia have three time zones? (It is a big country from West to East).
How many time zones does Russia have? (11 zones)
Session 2
In this session students learn to express am and pm times in 24-hour time. They use 24-hour time to make calculations about time difference between two different locations.
What does a time of 18:45 mean?
Some students may know that the time is given in 24-hour time, sometimes referred to as military time.
Why is 6:45pm expressed as 18:45? (It is 18 hours and 45 minutes from the start of the day at Midnight.)
Session 3
In this session the class practise working with 24-hour time in the context of the commuter train that runs from Waikanae to Wellington. Use of 24-hour time for public transport is quite rare in New Zealand but is common in Asia and Europe.
What does it mean to commute to work?
Why might people use public transport to commute rather than drive their car? (Cost, time, and minimising carbon footprint are important reasons)
If you were Henare and Leisha what would be the best time to start work? Explain why you would start then.
How much time does it take Henare and Leisha to train from Waikanae to Wellington? (Note that there are two services; normal and express)
How much longer does it take the normal train than the express train? (3 minutes)
Which trains are likely to be the most packed? Why? (Trains arriving in Wellington between 7:45am and 9:00am are likely to be popular)
Which train would you advise Henare and Lisa to take? Why?
Look to see that your students:
Session 4
In this session students investigate departure and arrival times of international flights. Students are given two of three conditions and asked to find the third. Departure time, flight time or arrival time might be omitted. In solving the problems students need to compare time zones using 24-hour time and make calculations with time in hours and minutes.
What is the time difference between Brisbane and Singapore?
What do you notice about the clocks at each location as the flight proceeds?
From the departure times in each location how could you calculate the flight time?
If you are told the flight time how can you calculate the arrival time in the country that you land in?
Session 5
In this session, the class practise using timetables and their knowledge of time zones to plan a trip to London from where they live. You could complete this task as a class, or in small groups, and then give pairs of students the opportunity to plan a trip to a destination of their choosing. This could be linked with social sciences learning.
You are going to have a three-week holiday in the United Kingdom (UK). I want you to plan the trip. Both your parents work, so you cannot leave before December 6th and you cannot return later than December 26th. Plan the transport that will give you the longest possible time in the UK. Allow for travel time, stop overs, and minimalising the overall cost. Use the internet to help you but please don’t book any flights by mistake?
Dear family and whānau,
This week we have been working with 24-hour (military) time, discovering how time zones work and why the zones are needed. We have calculated times in other parts of the world when given New Zealand time, and found out how to work out arrival times for long international flights.
Some links from the Figure It Out series which you may find useful are:
X Marks the Spot
This unit uses games and puzzles to explore coordinate systems and their uses. The students are given the opportunity to invent their own systems by locating counters on a sheet of paper and by finding the dead centre of a set of objects. The Cartesian and polar coordinate systems are used to locate position on maps. Polar coordinates are also used to describe certain loci (sets of points with a common property).
This unit emphasises the value of coordinates to locate the position of objects in the plane. Two coordinate systems are presented. One is the Cartesian system that uses horizontal and vertical distances from a fixed point (the origin). The other is the polar coordinate system that uses angles about a fixed line and distances from a fixed point on that line.
Students may well have seen the Cartesian system before as it is the one commonly used on road maps, and maps generally. It was invented by a French mathematician called René Descartes. You’ll read his story throughout the course of the unit. The origin of the polar coordinate system is less clear. Both systems describe some complicated curves simply though the unit does not go into functions at higher levels of the Curriculum. Students are likely to see polar coordinates as an interesting curiosity at this point. However, Cartesian coordinates provide the basis of a great deal of work that is undertaken in the senior secondary school. Here algebra and geometry are brought together to form a powerful combination that enables some interesting problems to be solved. Most of the calculus in school is built around the application of algebra to geometry via the Cartesian coordinate system.
The learning opportunities in this unit can be differentiated by providing or removing support to students and by varying the task requirements. Ways to differentiate include:
Differentiation involves changing the context of activities to suit the interests of your students. The unit uses quite traditional contexts such as battleships and pirates. Students will find using locations in their local area engaging, but also be prepared to use locations they are less familiar with, such as other towns/cities or landmarks in Aotearoa. Students might become more engaged in sports they prefer such as basketball, hockey and netball, than golf. Professional sports coaches gather a lot of detail about the locations of their players during games. Data is recorded using coordinates that are stored in tracking devices. Traditional settings also provide contexts for study. Māori call the North Island “Te Ika-a-Māui” (the fish of Māui). There were no aeroplanes then. How did they know the island was shaped like a fish? What reference system did pre-European Māori use to navigate?
Te reo Māori vocabulary terms such as taunga tukutuku (Cartesian coordinates), ine-koki (protractor), putu (degree), taunga (location), huapae (horizontal), and poutū (vertical) could be introduced in this unit and used throughout other mathematical learning.
Session 1: Four Counters
This lesson introduces the Cartesian coordinate system using a game with four counters and "Battleships".
Session 2: Buried Treasure
X can represent the position of a counter. More traditionally it represents the spot where pirate treasure is buried. We now follow that theme.
5. Each group goes outside and "buries their treasure" marking its location on their map of the school. They return to the classroom and provide another group the five coordinates, which describe where the pieces of treasure are located. The other group attempts to find the treasure of the first group using the coordinates provided.
Session 3: Dead Centre
Use the Copymaster 2: Dead Centre in this session.
The dead centre of a town is in the middle of all the houses, shops and workplaces. Here we get the class to think about the location of the real "dead" centre of a set of objects. In this situation we mean the point that is in some sense in the middle of these objects.
Session 4: Polar Coordinates
In this lesson we introduce polar coordinates.
In mathematics, positions in polar coordinates are defined in a similar way.
The location of a point Q can be described in relation to point O, the origin. Q is described by the angle between the line OQ and the horizontal (x) axis and by the distance OQ (see diagram).
So polar coordinates (45°, 5cm) describe the location of the point Q.
Session 5: Coordinate Puzzles
This lesson provides an application of polar coordinates to revise and strengthen the work of the previous session.
Puzzle One: (5,10), (3,7),(0,5), (3,3), (5,0), (7,3), (10,5), (7,7).
Puzzle Two: (0°, 0cm), (45°, 1cm), (90°, 2cm), (135°, 3cm), (180°, 4cm), (225°, 5cm), (270°, 6cm), (315°, 7cm), (360°, 8cm), (0°, 9cm), (45°, 10cm), (90°, 11cm), (135°, 12cm), (180°, 13cm), (225°, 14cm), (270°, 15cm), (315°, 16cm), (360°, 17cm).
Puzzle Three: (5, 6), (6, 5.9), (7, 5.7), (8, 5.4), (9, 4.8), (10, 3), (9, 1.2), (8, 0.6), (7, 0.3), (6, 0.1), (5, 0), (4, 0.1), (3, 0.3), (2, 0.6), (1, 1.2), (0, 3), (1, 4.8), (2, 5.4), (3, 5.7), (4, 5.9), (5, 6).
Dear family and whānau,
This week we have been looking at coordinate systems that are used on maps to give the exact location of landmarks. Usually, we use rectangular coordinates on maps but your child has also been learning about polar coordinates.
Ask your child to show you how to play golf on paper using polar coordinates. Who is the best shot in your whānau?
Figure it Out Links
Some links from the Figure It Out series which you may find useful are:
Flip and roll
The unit looks at, analyses, and extends, a game of chance in which three coins are tossed. A player wins if two heads and a tail come up.
This unit is based on the following five ideas about probability.
The learning opportunities in this unit can be differentiated by providing or removing support to students and by varying the task requirements. Ways to support students include:
Tasks can be varied in many ways including:
The context for this unit can be adapted to suit the interests and cultural backgrounds of your students. Most students are captivated by games of chance and are intrigued when their expectations about fairness do not match what occurs. Many different cultures have games of chance which can be found by a quick internet search. Traditionally, Māori people tended to have games of skill, such as poi and rākau, rather than games of chance. However, games such as darts and draughts were enjoyed following early colonisation. Your students might be able to suggest games from their cultural backgrounds and experiences that could be used to make the questions more relevant and engaging. Research might open discussion about gambling, and how people can easily be tricked into a false hope about winning. For example, Lotto is an interesting game where the chances of winning are low, but the lure of the prize is high. This could be linked to persuasive writing learning.
Te reo Māori vocabulary terms such as matapae (prediction), putanga (outcome), whakamātau (trial), tūponotanga tātai (theoretical probability), putanga whakamātau (experimental outcome), tōkeke-kore (unfair), and tōkeke (fair) could be introduced in this unit and used throughout other mathematical learning.
Session 1
In this session we look at the probabilities around flipping coins.
Why is a coin tossed? (A whistle might be hidden in one hand and one captain asked to guess as an alternative).
Is tossing a coin a fair way to decide who kicks off, or the way the team face? Why?
Students should conclude that there are two possible outcomes, so a coin toss is fair, unless the coin is biased in some way.
What events might happen that cause you to lose? (HHH, TTT, TTH)
Does the game seem fair? What does fair mean? (equal chance of winning)
Play the game a few times, say ten trials of three consecutive tosses. Insist that they record the trial data in a table. You might want to demonstrate data collection:
What did the experimental results show?
Why is the game unfair? (Look for attention to the events that might happen – a theoretical idea)
Do you agree with Brian and Jo? Discuss their ideas with a partner and come up with a justification for your view.
Act out simulations of three tosses of the same coin and locate the outcome at the appropriate branch of the tree.
Which outcomes are wins?
How can we write the probability of winning using numbers? (Use calculators if needed to convert: 3/8, 0.375, 37.5%)
Distinguish between an event (e.g. Three tails or Two heads and one tail) from an outcome, a way that the event might happen (e.g. HTT, THT, HTT).
What are the chances of getting… three heads? Three tails? Two tails and one head?
Create rules that make the game fair. That means you have an equal chance to winning and losing.
Test your game to see that it is fair.
How is the situation similar to the four-coin toss problem?
What happens if you add a row?
What happens if you change the probability of left and right from 50%?
Why does that happen?
Session 2
In this session, we explore the use of theoretical probabilities to make predictions for different numbers of trials.
What information do you need to make a prediction?
Expect students to talk about the number of each gender in the school influencing the probability of boys and girls leaving (e.g. which gender tends to leave first, who gets kept after school, etc.) Be sensitive to the gender identities of students in the class.
If the chances of males and females are 50:50, how many females do you predict?
Are ten females and ten males a likely outcome?
How might we act out this problem? (Simulate the situation)
Students might suggest tossing a coin twenty times using heads for girls and tails for boys. You might return to a Dalton Board simulation with a single row and 20 marbles to see what happens. Most times a sample of 20 students will not yield a 10:10 result (The probability is only about 18%, which is less than one fifth).
How many tosses will come up heads? Why do you predict that number?
How often did you get an outcome of 10 heads and 10 tails? (About 1 trial in every six)
How much did your results vary? What was your most unpredictable result?
What do you notice about the graph?
Students should observe that the outcomes vary considerably but the distribution centres on the predicted value of 10 heads.
To save time we will use this tool to simulate a lot of coin tossing. Each trial will be 100 individual coin tosses.
What is your best prediction for the number of heads and tails?
Do you expect that the data to look different to the 20 individual coin toss trials?
How are the graphs similar? How are they different?
Students might notice that the graphs both have a ‘bell’ shape and the distributions centre on the predicted values of ten heads and 50 heads, respectively. They might notice that the shape is smoother for the 100 toss data and more evenly spread among the outcomes. It is unlikely they will notice that the variation is proportionally less for the 100 toss data. The spread for the 20 toss data is from 1 to 19. The spread for the 100 toss data is from 35 to 62.
The key point is that experimental data varies a lot from the theoretical predictions.
Get a couple of students to try the game, noting the result.
Does the game look fair? How do you know?
How could we work out the chances of winning the game?
If you trusted this trial, what is the chance that a single coin toss gives you a win?
Look for students to express the experimental probability as a fraction using calculators, 5/16, 0.3125 or 31.25%...
Would you make money playing this game? Explain.
What fraction of the trials did you win?
Are these fractions close to the same or completely different?
Our experimental data show that the chance of winning with a single coin drop is about 25%.
With your partner, find a way to work out the chance in a theoretical way.
Analyse the game.
Then change the game in some way so the chance of winning is one half, 50%.
Session 3
In this session, we work on finding probabilities for two other situations, using theoretical and experimental methods. Two Figure It Out activities are used.
What are the chances that you win the game?
Does it matter which option you choose, paper, scissors, or rock?
How might we create a model of all the outcomes?
In how many outcomes does Player One win? In how many outcomes does Player Two win?
Both players win for 3 out of 9 outcomes with the other 3 outcomes being draws. Therefore, the game is fair, with both players having a 1/3 chance of winning each time.
Let students work on the problems in pairs. Roam the room and look for students to:
What ways did you find to make the game fair?
Giving different numbers of points is one method. Encourage students to look at the probabilities associated with different options. Possible options might be:
For a touch of humour about modifying the game search “Big Bang Theory Paper Scissors Rock” for a video to see an adaptation of the game. Lizard and Spock are added options. High achievers might investigate how the added options make the game fair and less likely to result in a draw.
Which option is best? Why?
Is there a way to estimate the amount that usually occurs with 52 rolls of the dice?
The data should indicate that most times 52 rolls gives a result of about $260, or a bit less. Possibly display the trial amounts using a dot plot.
How might we change the numbers on the dice so the expected amount from 52 rolls equals 52 lots of $5?
The easiest solution is to label all the faces $5.
Challenge yourself. Make the number on each face different.
Any combination of numbers that average five will work, e.g. 1, 2, 3, 7, 8, 9.
Session 4
In this session students investigate the "Top Drop" game.
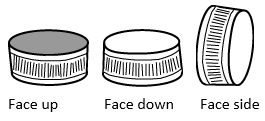
This is a game for pairs of students. To play the game the players take turns predicting the outcome then dropping a plastic drink bottle top with a smiley face drawn on inside. The first player predicts which way the top will land ‘face up’, ‘face down’ or ‘face side’.
The top must be held on its ‘side’ when it is dropped from a height of approximately 30 cm onto a flat surface.
If the player’s prediction is correct, they are awarded points, as below. If the player is incorrect, they are awarded no points.
Each player must keep track of the outcome of each drop, plus the points awarded.
The first player to be awarded 20 points wins the game.
What is the best strategy to win the game?
What did you notice?
Expect students to say that Up occurs more frequently than Down, with Side being unlikely.
Ask: How could we find the probability of each event, Up, Down and Side?
Since the situation cannot be modelled theoretically the only way to estimate the respective probabilities is by experiment.
Collate the results so you have a sample size of between 200 and 300 tosses. You might use a spreadsheet to sum the frequencies.
The data might look like this (variation will occur from these results):
What do you notice about the samples of ten tosses? (A lot of variation and Face Up most common)
Can we estimate the probabilities of Up, Down, and Side? How?
Percentages or decimals might be used to estimate the probabilities, e.g. 159 + 78 + 13 = 250 (total number of tosses), 159/250 = 0.64 = 64%, 78/250 = 0.31 = 31%, 13/250 = 0.05 = 5%.
You might create a pie chart that shows the percentages:
Students should say that there is twice as much chance of getting Up as Down. That shows in the points allocated.
Is it worthwhile to predict 'Side', at all?
Side only occurs once in twenty tosses, on average, but a win gives 10 points. A lucky person might get two Sides and win the game.
You might investigate approaches to playing the game to see which approach is most ‘winning.’ Ideas might be:
Students will come up with their own approaches. Look for signs they understand that each toss is an independent event, that is, one toss has no influence over the other. The task might also open up discussion on randomness.
Are the results unpredictable, or is there influence (bias) on what happens?
Session 5
In the final session use a Figure It Out activity, Left to chance to assess students’ understanding of theoretical and experimental probability. Left to chance also involves coin tosses, so students should bring some understanding from the first session.
How will you record the results of the trial?
How will you create a model of the outcomes to find the theoretical probability?
For example, they might say that four trials are not enough to provide solid evidence (Steve’s assertion). They might analyse the various ways that each destination in the fourth row might be arrived at (Simon’s false claim). To do so, they recognise that an event, e.g., landing on the second from the left ‘lose’ space, can happen through many different outcomes, e.g. HHT, HTH, THH.
Do students systematically find each set of outcomes for different destinations in the fourth row?
P (Three heads) = 1/8 = 0.125 = 12.5% (This means that the probability of HHH equals 1/8)
P (Two heads and one tail) = 3/8 = 0.375 = 37.5%
P (One head and two tails) = 3/8 = 0.375 = 37.5%
P (Three tails) = 1/8 = 0.125 = 12.5%
Combining the two ‘lose’ events gives a probability of 6/8 or 3/4. The game is definitely not fair!
You might use Slide 13 to discuss all the possible outcomes from three-coin tosses, and the number of those outcomes that lead to each ‘win’ and ‘lose’ destination.
Students might do this by extending the set of possible outcomes to four coin tosses in a systematic way. See Slide 14.
P (Win) = 8/16 = 1/2 = 0.5 =50%
P (Loss) = 8/16 = 1/2 = 0.5 =50%
Dear parents and whānau,
This week we have been looking at events where chance is in play. We are studying probability using simple games with coins and dice.
Ask your child to tell you about the different outcomes that can occur when you toss two coins and what the chances are of getting each of these outcomes. Ask your child to invent a game that uses three coins. Ask them to explain if the game is fair, or not, and try to find out why this is the case.
You will discover that coin tossing creates lots of interesting discussion. Enjoy investigating probability with your child.
What's going on? Fractions
This unit develops students’ recognition of pattern (consistency) in equations involving equivalence, addition and multiplication of fractions.
This unit develops students’ recognition of pattern (consistency) in equations involving equivalence, addition and multiplication of fractions. The patterns of equations show important characteristics of fractions, such as non-unit fractions as iterations of unit fractions, and equivalence as representing fractions of the same value. Students learn to represent specific examples where the properties are applied then provide convincing arguments about why the properties hold in all circumstances.
An important consequence is that students learn to consider variables as generalised numbers. They should also learn to express relationships involving fractions, including the significance of considering both numerators and denominators, when adding and multiplying.
In this unit we build on research by Deborah Shifter and colleagues about the development of algebraic thinking. Shifter works for The Educational Development Centre, a non-profit research organisation in the USA. Her approach follows several steps that can be linked to ‘folding back’ in the Pirie-Kieren model of conceptual development, which is commonly used in New Zealand classrooms.
The phases of approach are as follows:
In this unit, claims are developed through equation sets involving fractions. The sets aim at developing students’ understanding of the structure of non-unit fractions, mixed numbers, and addition and multiplication of fractions.
The learning opportunities in this unit can be differentiated by providing or removing support to students and by varying the task requirements. Ways to differentiate include:
The contexts for this unit are strictly mathematical but the materials used can be adapted. Physical items that have significance to your students might be better used than standard mathematical equipment. You may decide to restrict the materials students use, especially if the materials are already familiar to them. A journey might be used as the metaphor for a strip model and could be related to a local story. Whānaungatanga (family) values might involve finding fair and equitable ways to share items. Kaitiakitanga (guardianship of taonga) might involve tracking the consumption of a treasured resource. Two families that share harvested potatoes might do so with fractions, to reflect the different number of people or needs of each whānau. Family members on a long journey might track the fraction of the journey that has been covered and that which remains.
All lessons in this unit follow the same sequence of phases as given in the diagram above. A poster of the phases is provided as Copymaster 1 for students to refer to. The notes suggest possible student ideas and teacher reactions to those responses. It is not feasible to anticipate all ideas students might give so you are encouraged to be flexible in how you respond to students rather than ‘teach’ the sample ideas and representations provided.
PowerPoint 1 gives the equation sets that drive the unit. The sets are labelled in the top left corner of each slide for reference. Slide One has the first pattern to look at. The pattern involves the addition of fractions with the same denominator i.e., 1/b + (b-1)/b = 1, 1/3 + 2/3 = 1. These patterns will be, relatively easy for students to represent. Slide One can be used as an example to familiarise students with the approach. Be aware that students’ existing schemes for addition of fractions may be incorrect, e.g., they may simply add across the numerators and denominators:1/4 + 3/4 = 4/8.
Equation Pairs Set One
Noticing Consistency
Use ‘think, pair, share’ by inviting students to look independently at the four examples, work out the missing values, then share their ideas with a partner. In the class discussion expect students to express their observations in ways that are clear to others. Students should re-express their ideas if others do not understand what they are saying. You may need to remind students that the ‘something going on’ relates to all four examples, not just one. Expect responses like:
S: The first fraction always has one on the top line.
T: Can you tell us more? What is the denominator, the bottom number?
S: The bottom numbers, denominators are different in each equation.
Discussion opens the possibility of using correct mathematical terms, like numerator (number above the vinculum), and denominator (number below the vinculum).
S: The sum (answer) is always one.
T: All four equations have a sum of one? What about the top right equation?
S: The sum is five fifths. Five fifths make one whole.
Making a claim
Encourage students to state a claim about what is going on with all four examples in Pattern One. They might do so individually at first then work in a small team to refine their ideas and the way they express those ideas.
Expect ideas like:
Your aim is for students to express their claims in clear, minimal terms, using correct mathematical language. For example, ‘the top numbers’ is not as clear as ‘the numerators’, and ‘add to’ is not as precise as ‘the sum of’.
Representation
In this phase, students choose representations to show why the pattern holds consistently. Students might choose physical manipulatives, such as fraction strips or circles, draw diagrams such as strips and circles, and use contexts from everyday life, such as sharing cakes or pizza. Encourage students to begin with the first two examples of equations then consider how the same relationships might generalise to the last, and other similar, equation pairs.
Examples might be:
Some representations are less helpful than others in terms of understanding the structure of the fractions that add to one. Circles are useful for showing that one is complete. Strips may make the iteration of unit fractions more obvious. Strips are also easier for students to draw, and divide up equally. Ensure your students have experience with a mix of circle and strip fraction models. It is important for students to recognise that the denominator in each example defines the size of the equal parts that one is cut into. For example, eighths are created by the equi-partitioning of one into eight parts, so eight of those parts make one. Your questioning is important to support students to connect the symbols and other representations.
Argumentation
In this phase students are asked to formalise their noticing by creating a statement that generalises to all cases. The discussion may start with a specific equation pair but must be amended so that it accurately represents the general pattern.
S: With 1/8 + 7/8 = 1 the numerators add to eight. Eight eighths equal one.
T: So how does that work in the same way with the other equations?
This might lead to expressing the relationship in general terms.
S: The first numerator plus the second numerator add up to the denominator.
T: If we gave names to the numerator and denominator of the first fraction, like a and b, could we express the property more simply?
Some students might experiment with algebraic notation such as a/b + c/b = 1. Note that this statement is incomplete since it misses the necessary condition for a + c = b.
T: Do we need to say something about a and c?
S: We could just write a + c = b.
T: Give us an example of that.
S: If b = 3, the numerators 1 and 2 add to 3.
Though it is difficult for this level, increased sophistication is evident in a + c = b, and writing the generalisation with only two variables, a/b+ (b-1)/b = 1. It is also important to note that b/b = 1, for any whole number value of b, except zero. b can also be any integer, since rational numbers are of the form a/b, a and b∈ I, that is a and b must be integers. High achievers should be challenged to express their generalisations using algebra. You may need to support them to develop the coding strategies to do that.
Equation Pairs Set Two
If time permits in the first lesson, ask the students to approach the second equation set more independently. From this point each equation set is discussed succinctly using the phases of the approach.
Noticing consistency
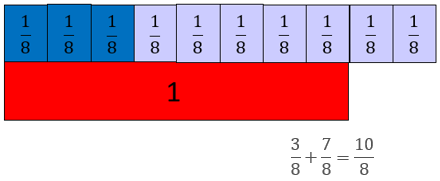
The four equations apply the addition of fractions with the same denominator. Students need to recognise that the denominators in both addends and the in sum are the same. Watch for students incorrectly applying whole number addition, that is, adding both numerators together and adding both denominators together. The completed equations should be:
Note that ten eighths equals 1 2/8 = 1 1/4
Making a claim
In natural language expect the students to use phrases like “you just add the top numbers”. Introduce important vocabulary such as numerator, denominator, addend, and sum to clarify which numbers are being referred to in the claims. If the claim is restricted to one example, encourage students to see what changes and what stays constant across the other three equations. The aim is to broaden the claim to the equivalent of “If the denominator of both addends is the same, then the numerator of the sum is the sum of the numerators of the addends.”
Representation
Expect both physical and diagrammatic representations to be used. A fraction strip representation might look like this:
Diagrams of a ‘sets’ representation can be used but it is unwise to use sets at this point (See the diagram below). The changing whole can be confusing, since the aim is to generalise a relationship for all examples.
Whatever representation is chosen by students they need to be clear about the referent one, be it a length, area, or set. The sum must be defined in terms of that original one whole.
Argumentation
Look for students to justify that if the denominators of two addends are the same then the sum is the sum of the numerators, over that denominator. Algebraically that is represented as:
a/b + c/b = (a+c)/b
Note that a, b, and c are variables, and the generalised argument becomes clearer, and is confirmed, by translating values from the equations back into the general form.
For example, with 3/8 + 7/8 = 10/8, a = 3, b = 8, and c = 7.
An interesting discussion point is whether this is any different to addition of whole numbers. For example, 3 + 7 = 10 is the combining of 3 ones and 7 ones, making 10 ones. The ‘ones’ are regarded as the same unit. With 3/8 + 7/8 = 10/8, eighths are the units being combined.
Developing the process further
PowerPoint One contains seven equation sets. The sets might form the basis of a week-long unit. The phases for each equation set are described succinctly below.
Equations Set Three
Noticing consistency
The four equations both demonstrate the multiplication of unit fractions, that is fractions with one as the numerator. Understanding in general that 1/b × 1/d = 1/bd, e.g. 1/3 × 1/4 = 1/12, is fundamental for understanding equivalent fractions.
Making a claim
In natural language, expect the students to use phrases like “multiply the two denominators and you get the denominator of the answer”. Expect the use of mathematical vocabulary such as factor and product to clarify which numbers are being referred to in the claims. Encourage clarity by asking questions like:
The aim is to state the claim as something like “The product of two unit-fractions is a unit fraction, with a denominator that is the product of the denominators.”
Representation
Expect both physical and diagrammatic representations to be used. Fraction strips are static representations:
Folding a paper strip or a rectangle is a dynamic representation:
A sets model may be used but the product needs to be known to establish the possible numbers of objects in the set. Therefore, identifying the referent one is more complex.
Argumentation
Look for students to state the condition that both addends are unit fractions. The starting product might be expressed as 1/b × 1/d. The product is 1/bd. Students should explain why the relationship occurs. Their explanation needs not be in formal algebraic terms, with letters as variables.
The second factor gives the first equal partitioning and creates some parts. The denominator gives the number of equal parts. Then each part is split into equal parts. That number of parts is given by the denominator of the first factor. Therefore, each of the d parts, is equally partitioned into b parts, so the total number of parts equals b x d.
Equation Pairs Set Four
Noticing consistency
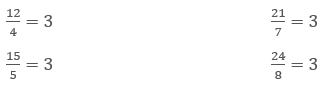
The four equations apply equivalence of improper fractions. The equivalent number is kept at three to limit variation.
Making a claim
In natural language expect the students to use phrases like “the answer is always three.” Some students might indicate what they see in a diagram.
Expect the use of mathematical vocabulary such as denominator, numerator, fraction, equivalent, and whole number to clarify which numbers are being referred to in the claims. Encourage clarity by asking questions like:
The aim is to state the claim as something like “A fraction that has a denominator that divides into the numerator three times, is equal to three,” or “A fraction that has a numerator that is three times the denominator, is equal to three,”
Representation
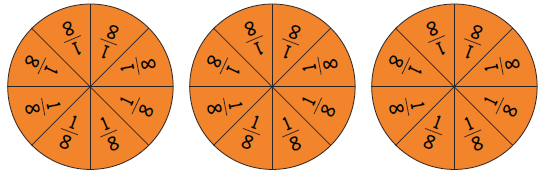
Fraction circles are useful in demonstrating the completeness of a one.
Eight eighths make one. With 24 eighths you can make 24 ÷ 8 = 3 ones.
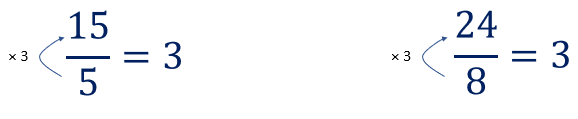
Students may develop more schematic ways to represent the connection between numerator and denominator.
Five fifths make one so 15 fifths must make three, since 3 x 5 =15
Argumentation
Look for students to justify, using words of diagrams, that the denominator of a fraction specifies the number of equal parts that make one. For example, in 12/4 the parts are quarters, four of them are needed to make one. Dividing the numerator by the denominator finds how many ones can be made. With 12/4, 12 ÷ 4 = 3, so three ones can be made. The equation 12/4=3 represents that equivalence.
For all four equations define the denominator of the first fraction as the variable, say b. The observation that the numerator is always the denominator multiplied by three can be represented as 3b/b. The equivalence can be written as 3b/b=3.
Arguments may be supported by graphics or other representations.
Students might also generalise that dividing the numerator by the denominator tells how many ones can be made, and the remainder becomes the fraction part of the mixed number, e.g. 13/5 = 2 3/5.
Equation Pairs Set Five
Noticing consistency
The equation set applies equivalence, that is when two fractions represent the same value. Understanding equivalence is essential to ordering fractions by size and to the addition and subtraction of fractions. The completed sets should be:
Making a claim
In natural language expect the students to use phrases like “If the numerator is three times the other numerator, then the denominator must be three times as well.” Students tend to notice patterns across the equation like this:
Expect the use of mathematical vocabulary associated with fractions, particularly numerator and denominator. Draw students’ attention to the equals sign as representing the same value on both sides. Students are most likely to see equals as a signal to work out the answer. Encourage clarity by asking questions like:
The aim is to state the claim as something like “Two fractions are equivalent, if the one numerator is a multiple of the other, and the denominator is the same multiple of the other.”
Representation
Static representations might involve length, area (circles or rectangles), or sets.
A more dynamic representation is to fold a paper strip or rectangle into thirds, shade two thirds, then fold the thirds in half. How many sixths are shaded?
Argumentation
Look for students to justify, using words of diagrams, that the same multiplication is performed on both the numerator and denominator of a fraction to create an equivalent (same value) fraction. For example, if the numerator and denominator of 2/3 are multiplied by six this gives 12/18, and 2/3 = 12/18. Of interest is that the multiplier 6/6 is another name for one, the identity element for multiplication. 2/3 x 6/6 = 12/18 is the same operation as 2/3 x 1 = 12/18.
However, the multiplication means different things for the numerator and denominator. Multiplying the numerator by a number increases the number of parts by that factor. For example, 12/18 has six times as many parts as 2/3. For the denominator the effect is the inverse. Each part in the new fraction is one sixth that of the first fraction, since six times as many of those parts make one. For example, 12/18 has parts that are one sixth the size of the parts in 2/3.
In general, the transformation a/b × n/n = an/bn, gives n times as many parts but each part is one nth the size. a/b and an/bn represent the same quantity. Note that n/n is always equal to one.
Equation Pairs Set Six
Noticing consistency
The equation set highlights the difference of unit fractions. Note that the denominator of the first fraction is one less than that of the second. This equation set provides an opportunity to apply equivalence. The completed sets should be:
Making a claim
In natural language expect the students to use phrases like “the difference has a denominator that is the product of the two other denominators.” Ask students to be more specific in their description.
The aim is to state the claim as something like “If two unit-fractions have denominators that are one different, the difference of the fractions is the unit fraction with the product of the denominators as its denominator.”
Representation
Students are likely to use specific examples to convince others about how the relationships work. Fraction strips are probably the most useful representation.
It is important for students to consider why the fraction one twelfth fits exactly.
Argumentation
Students need to apply equivalence to argue why a given unit fraction is the difference. Their argument might begin for a specific example.
Since one half and one third are involved, the difference must involve sixths, as both one half and one third can be renamed as ‘so many’ sixths. 1/2 = 3/6 and 1/3 = 2/6 so there is a difference of one sixth.
Encourage the students to generalise by naming the denominator of the first fraction as a variable again.
If the first fraction is 1/b, the second is 1/(b+1), and the product is 1/(b(b+1)). Algebraic notation, like this, is not expected at Level Four, but students may invent their own ways to express what they notice. Whatever notation students create, it can be checked by substituting numbers in place of symbols, and seeing if the equations created belong in the set. This could be done as a paired activity, and could be used to encourage tuakana-teina.
Equation Pairs Set Seven
Use set seven as an opportunity to see how well students engage in the generalisation process independently. Ask them to record their claims, representations, and arguments in ways that work for them. Some students may prefer writing their work while others may prefer to capture their ideas using a digital recording.
Noticing consistency
The equation set highlights the multiplication of fractions, that is a fraction of a fraction. The numerators of the factors are the same, as are the denominators. That is done to reduce variation. The completed sets should be:
Making a claim
In natural language expect the students to use phrases like “It is a fraction multiplied by itself. The product is the two numerators multiplied over the two denominators multiplied.” Ask students to be more specific in their description, through questions like:
The claim, using mathematical language, might be something like, “If a fraction is squared, the product is the numerator squared over the denominator squared.”
Representation
An area model is useful since it illustrates the relationship between a number multiplied by itself and a square. Folding and shading squares of paper works well.
Students might also use strip models, but the squaring of numerators and denominators is not obvious.
Argumentation
The equations include two variables, that is the value of numerator and denominator in the fraction being squared. Students need to recognise that the denominator names the number of partitions of one. The numerator names the count of those parts.
Students may be able to show how they are thinking with variables (lack of closure), by treating the numerator and denominator as variables in an area diagram.
Algebraically this might be written as a/b × a/b = (a×a)/(b×b) or more succinctly as (a/b)2 = a2/b2.
Kia ora parents and whānau,
This week in maths we have been learning a lot about fractions.
Try challenging your child to explain to you why they know 1/3 × 1/4 = 1/12
They may need to draw a diagram to help them.
Choices
This unit is about making best option decisions in real-life situations based on cost. Common examples of such decisions are explored, including the cost of taxis, cooking times, hire cars, and mobile phones.
The mathematics in this unit involves relationships between variables. A variable is a measure that can take up different values. For example, when making decisions about rental cars, customers relate two variables, number of kilometres or days (distance or time) and amount of money (cost).
Most situations define the roles that the variables take. When hiring a car, it is the distance or time, that is the independent, or explanatory variable. An explanatory variable is the variable that explains changes in the other variable, cost. You expect that travelling more kilometres will cost more. Cost is the dependent, or response, variable.
In this unit the relationships are mostly linear. That means there is a constant growth in the response variable, as constant growth occurs in the explanatory variable. For example, Booma Rentals hires cars at $30 per day plus $0.10 per kilometre. The relationship between cost and kilometres is linear, since you pay 10 cents more for every kilometre. If a linear relation is graphed the ordered pairs (co-ordinates) lie on a straight line.
The learning opportunities in this unit can be differentiated by providing or removing support to students and by varying the task requirements. Ways to support students include:
Tasks can be varied in many ways including:
The context for this unit can be adapted to suit the interests and cultural backgrounds of your students. Most students nowadays own a mobile phone or know someone who does. Rental cars and taxis are a more familiar context for urban students so be aware that other forms of rental or journey may be more appropriate to rural students, e.g. delivery fees for products. Cooking times of meats can easily be changed to include cooking times of roasting vegetables or other foods. There may be contexts involving rates that are more relevant to your students. Examples might include hire-to-buy schemes, money earned for jobs such as serving at a café or dairy, cost of shipments of hay (delivery charge + cost per bale), water and electricity charges (line + amount per kilowatt hour).
Teachers’ Notes
Encourage your students to choose appropriate forms of calculation, depending on the complexity of the operations and numbers involved. Mental calculation, recording in written form, and digital devices are all legitimate options. In your discussions ask the class how they got the answers and what methods they used to do the calculations.
Session 1
Who has ridden in a taxi recently? Why did you go in a taxi? (Slide One)
How did the taxi driver calculate the fare? (Slide Two)
Why was there a dollar amount on the meter before you even started off?
Tiki Taxis charge $5 flag fall and $3.00 per kilometre. (Slide Three)
Discuss the meaning of “per kilometre” as a rate “for every kilometre travelled.”
Use Slide Four to show the problems:
Work with a partner to solve the problems together.
How much would it cost you to travel 25 kilometres in the cab?
How much would it cost you to travel 32 kilometres in the cab?
How far could you go for $41?
How far could you go for $77?
Share and korero about your thinking with another pair or group.
You might use a flowchart like this:
Ask:
Why is the order that we carry out the operations important?
How do we find the distance if we are given a fare?
You might decide to record equations for the flowchart processes. Define the variables; f represents the fare in number of dollars, and d represents the distance in number of kilometres.
If we start an equation, f=, what do we include to show how the fare is calculated, what fare is equal to? (f = 3d + 5)
If we start an equation, d=, what do we include to show how the distance is calculated, what distance is equal to? (d = (f – 5)/3). In this case pay special attention to the vinculum in a fraction also being a symbol for division.
Do you see any pattern? (Student might notice that the graph is linear)
Why do you think the points lie on a line? (Same rate of $3 per kilometre)
What do you notice?
Can we work out fares and distances using the graph? How?
What would the fare for 30 kilometres be? ($95)
What is the distance of a fare that costs $65? (20 km)
Animating Slide 7 shows how the answers can be read off the axes.
Tiki Taxis find they are not making enough money to cover their costs, and to give their drivers a decent wage.
Which option is better, if they want to make more money?
Raise flagfall to $10.00
or
Increase the rate to $3.50 per kilometre
What does the graph show? (An increase in flagfall of $5 gives more income than an increase in rate of $0.50 per kilometre up to 10 kilometres)
How far do you think most taxi trips are? (Create some make-believe trips online using Google Maps and use the distance function)
What recommendations would you make to the owners of Tiki Taxis?
Session 2
What does 43 kilograms per capita mean? (An average of 43 kilograms for every person)
Discuss the fact that this might include bones as well as meat, but every person includes little children and elderly people who eat relatively little.
How many whole chickens make up 43 kilograms? (invite predictions then move to Slide Two)
What operation should we perform? (43 ÷ 1.2 = 35.83)
Therefore, kiwis average nearly 36 whole size 12 chickens per year. That’s three chickens every month!
How long should you cook a size 12 chicken?
What calculation should you perform? (1.2 x 55 + 20 = 86)
How long should you roast a size 18 chicken for? 1.8 x 55 + 20 = 119
If a chicken should be roasted for 97 minutes, what mass is the chicken? (97 – 20) ÷ 55 = 1.4
If a chicken should be roasted for 75 minutes, what mass is the chicken? (75 – 20) ÷ 55 = 1.0
What pattern do you notice? (Linear)
Why does this pattern occur? (Constant rate of 55 minutes per kilogram)
How is this situation the same as the rental car situation? (A constant rate and fixed time. The fixed time has a similar effect as flagfall in the rental car situation). Share and korero about your thinking with another pair or group.
Students may be able to relate roasting a chicken to their knowledge of cooking chicken in a hāngi. How long should chicken be cooked for in a hāngi? Does cooking time increase if more chickens are being cooked? Why or why not?
In the Aotearoa New Zealand, it is becoming more common to cook a turkey to celebrate Christmas with whānau. Commercial turkeys are much larger than chickens and have a mass of between 3.6 and 10.8 kilograms, etc.
Let students work on the problems collaboratively with support from digital graphing tools and calculators. Solutions are below:
The relationship is close to linear.
The amount of cooking time goes up by a little over 15 minutes for each extra kilo. For example, between the point (8, 210) and (10, 240), mass increases by 2 kilograms and cooking time increases by 30 minutes. That is 15 minutes per extra kilogram. Students may recognise that their rule should begin as t = 15m but a fixed amount of time needs to be added. They might take any point, say (8, 210), and use it to work out the extra fixed amount.
8 x 15 = 120
120 + 90 = 210
The rule is t = 15m + 90 and can be tested using other known masses and times. For example, 15 x 10 + 90 = 240 minutes.
15 x 7 + 90 = 195 minutes
Why might that be?
Chickens take an extra 55 minutes per kilogram compared to 15 minutes extra for turkeys. Mostly that is because a much larger bird takes way longer in the oven to reach a cooking temperature (90 minutes vs 20 minutes) but having reached that temperature cooks more quickly. There is little difference in the density of chicken and turkey though turkey is a little leaner, has less fat proportionally.
Kiwis eat about 24 kilograms of pork, per capita, each year.
Here are the recommended roasting time details for a shoulder roast.
Put in the oven for 30 minutes at a temperature of 220⁰C.
Turn the oven down to 180⁰C.
Cook the roast for 20 minutes per 500 grams.
Create a graph to help people work out the roasting time for pork.
Slide Eleven provides a model graph.
Ask students to write an equation for the relation between mass and cooking time. (t = 40m + 30)
Have students share and korero about their thinking with each other.
Session Three
Has anyone’s family or friends ever hired a car?
Why did you need to hire a car rather than use your own?
How many days did you hire the car for?
How far did you travel?
Do you know how much it might have cost?
What different things did you have to pay for?
Question 1: Suppose that Rent-A-Bomb charges $25 a day and 30c per kilometre.
How much does it cost for a two-day hire if you travel 300 kilometres?
2 x 25 + 300 x 0.3 = $160
If you use the car for three days, and the hire costs $291 in total, how many kilometres do you travel?
(291 – 3 x 25) ÷ 0.3 = 920km
If you travel 900 kilometres, in total, and the hire costs $650, how many days do you hire the car for?
(645 – 900 x 0.3) ÷ 25 = 15 days
After suitable time, gather the class to discuss the answers.
What different ways did you use to solve these problems?
Which strategies are the most efficient? Have students share and korero about their thinking with each other.
Note that students are likely to use trial and improvement strategies, particularly to problems b) and c). These strategies can be made more efficient by organising data systematically in tables. For example, b might be approximated by choosing likely numbers of kilometres.
The equations given represent an efficient solution that comes from recognising a rule for working out the number of kilometres from the cost or the inverse of that.
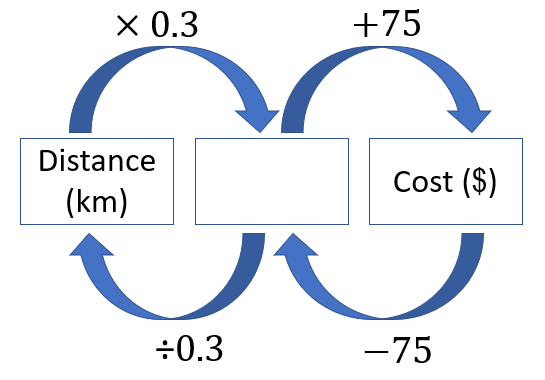
A flowchart for a 3-day hire might support students to see the relationships:
To solve problem 1b put $291 into the cost box and work backwards to find the distance.
4 x 40 + 400 x 0.15 = $220
{197 – (2 x 40)} ÷ 0.15 = 780km
{480 – (800 x 0.15)} ÷ 40 = 9 days
You might use tables again to organise data and flowcharts to suggest the most efficient ways to calculate the answers.
To simplify things let’s hire the car for one day.
Which company is the cheapest to use?
Can you explain your thinking?
Students might offer ideas like:
Rent-a-bomb charges less to hire the car but Rent-a-dent charges less per kilometre.
How might we graph the deals from both companies on the same graph?
What are the variables? (Distance and cost)
What rule connects kilometres and cost for each company?
What is the equation for that rule?
Collectively develop a graph that looks like this (PowerPoint 3, slide 1):
Session 4
In this session students look at mobile phone plans. For many people mobile phones are also their source of emails, music and internet. Plans are developed by companies to attract consumers who meet patterns of phone use. The best plan for one person is not necessarily the best for another. Variables to consider are time in phone calls, number of texts, and amount of data.
Who has their own mobile phone? What do you use your phone for?
How many times a week would you use it to phone someone?
How many text messages would you send in a day?
What does it cost to use your phone?
Who pays for it?
The discussion should show that use of mobile phones is variable and that they cost money.
How do you select the best deal for your phone?
What details do you usually look for in mobile phone plans?
Generally, plans include the amount of data, minutes of calls, and number of texts. Sometimes they include special deals like extra data, memberships to entertainment providers or music channels, and interest free purchase of phones.
Mobile phone plans contain a lot of variables. Let’s simplify the situation by looking at just one variable, data volume.
What is meant by data? (Pieces of information)
Slide Three shows the commonly used file sizes.
A gigabyte equals 1000 x 1000 x 1000 = 1 000 000 000 = 1 billion bytes. To put things into perspective:
1 GB of data is equivalent to about 210 000 text only emails, or 250 3-minute MP3 videos, or 600 high resolution images. A standard movie DVD contains about 4.5 GB of data.
Terabytes (TB) are another common unit of data. For example, if you buy an external hard drive for your computer it is likely to be several terabytes in size. One terabyte equals 1 000 GB, which equals 1 000 000 000 000 bytes (1 trillion).
What is the same and what is different about these plans?
Students should notice that everything is the same except the volume of data.
Is there a relationship between the amount of data and the price of the plan?
If a plan is exactly the same, but allows 8GB of data, how much should you pay per month?
All of these plans cost the same, but which one is best?
Justify your choice of plan.
Let students discuss the plans. They should notice that the relationship between data and call time is negative. That is, when one goes up the other goes down. Choosing one of the plans is likely to be dependent on usual phone usage, preference for internet browsing versus making calls to friends and family.
Is the relationship linear?
How is the relationship different from the others we have seen?
Imagine a plan with same cost that has only call time. How many minutes would you get?
Imagine a plan with same cost that has only data. How many gigabytes would you get?
Find a rule that relates call time to data. Let t represent call time, in minutes, and d represent amount of data, in gigabytes. (t = 240 – 40d)
Is there a best deal? Explain.
Session 5
In this session we give the students a chance to operate a hire car company.
The Hire Car Game: Students work in teams of three to operate their own hire car company. Each team has overheads of $20 a day per small car, $25 a day for a medium car, and $35 a day for a large car, whether the car is used or not. Overheads cover the cost of the vehicle, insurance, building rental, cleaning staff, etc. Costs occur each day irrespective of whether the car is hired or not.
Small Car $35 per day + 0.25c per kilometre
Medium Car $40 per day + 0.30c per kilometre
Large Car $45 per day + 0.35c per kilometre
Each company choses its stock level of cars from a minimum of 4 cars to a maximum of 10 cars. The company nominates the size of each car and assigns each car an identification code, e.g. Car 1.
Family and whānau,
This week we have been investigating the cost of hiring taxis, renting cars, and operating a mobile phone. We've used mathematics to make decisions about the best option to choose, and justified the choices we made when selecting a service or plan. Students have been asked to do some research at home related to the costs of phone plans. It would be helpful if you could discuss your family phone plans and why you have made the choices you have. Ask your student to identify the important considerations when deciding on a phone plan. Looking online for sites that compare phone plans would help to support your discussions. Thanks for your help.
Figure it out
Some links from the Figure It Out series which you may find useful are: