This is a level 3 and 4 statistics activity from the Figure It Out series.
A PDF of the student activity is included.
Click on the image to enlarge it. Click again to close. Download PDF (1228 KB)
compare results of experimental probabilities with other people
make a conclusion from the results of probability experiments
This diagram shows the areas of Statistics involved in this activity.
The bottom half of the diagram represents the 5 stages of the PPDAC (Problem, Plan, Data, Analysis, Conclusion) statistics investigation cycle.
FIO, Levels 3-4, Statistics Revised Edition, Picking Pocket Money, pages 20-21
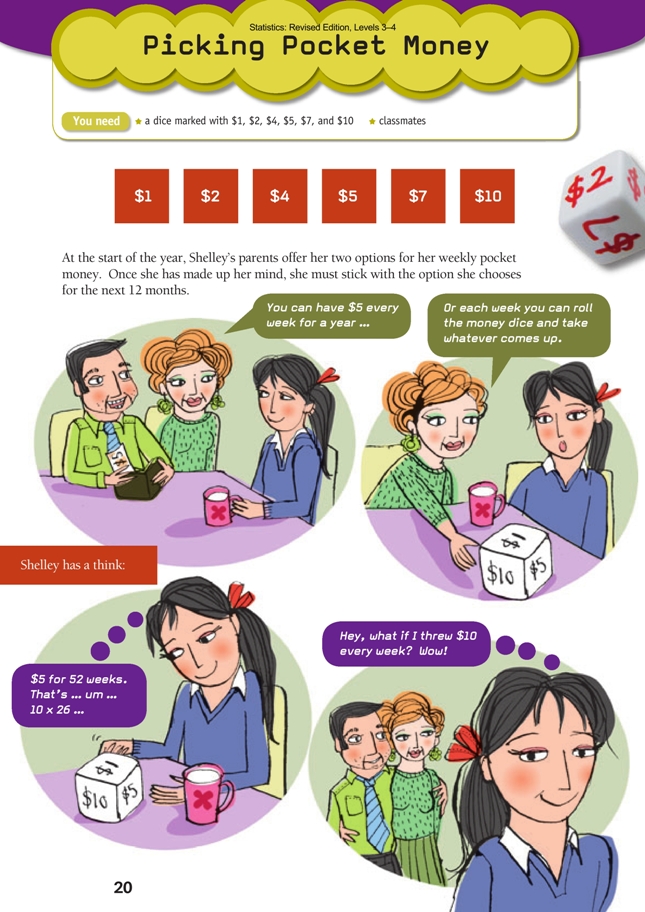
Dice marked with $1, $2, $4, $5, $7 and $10
In this activity, the students carry out a simulation and give advice based on the results of that simulation.
Shelley must choose between two options: one involves certainty; the other, uncertainty. In question 1, the students have to think about what the money dice option might mean for Shelley. At the one extreme, she could get as much as $520 in one year (by throwing $10 on the dice every week); at the other, she could end up with as little as $52 (by throwing $1 every week). Is a guaranteed amount ($260) the best choice? Listening to the students’ discussion and reasoning will give you some insight into their understanding of probability. Students of this age sometimes think that some numbers on a dice are harder or easier to throw than others.
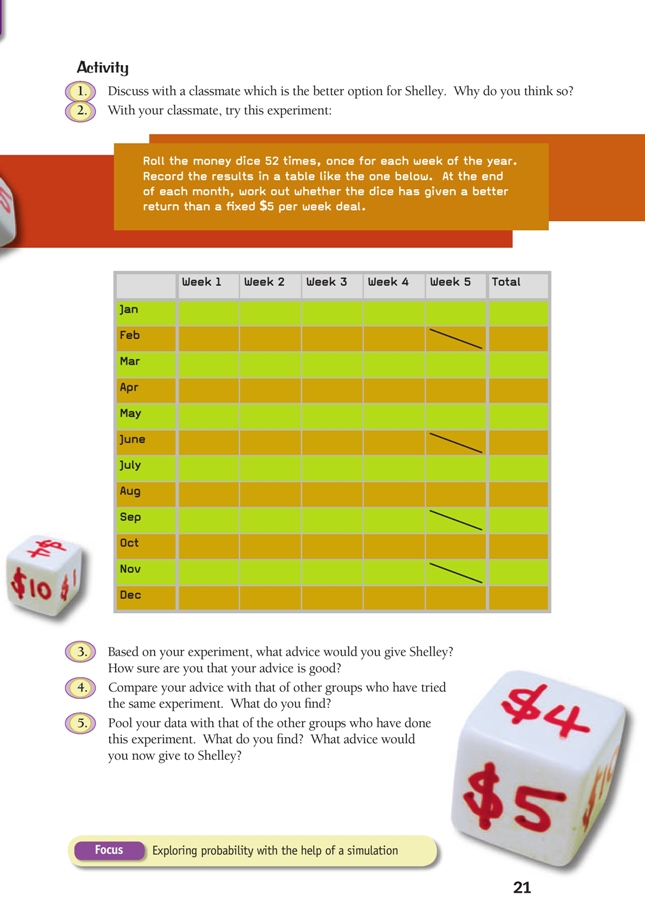
Question 2 is the simulation, with the 52 trials each representing a week. When the students have completed their dice throwing, they need to calculate the grand total for the year and compare it with the $260 that would otherwise be guaranteed. Depending on the outcome of the simulation, either option may turn out to be the winning one.
Question 3 asks the students to reconsider their advice to Shelley. This is a test of their understanding of probability. Those who don’t understand it will probably advise the money dice option if their simulation produces a total of more than $260. Those who do understand probability may advise Shelley to take the guaranteed amount even if the simulation favours the dice, on the grounds that a second simulation might turn out quite differently. Then again, the students’ advice may also refl ect their own values and ways of operating. (“Sure, but it’s worth the risk”.)
Questions 4 and 5 involve seeking out a larger pool of data. By now, the students should be aware that, when a situation involves experimentally determining probability, the bigger the data set, the better.
For your information, if a very large number of trials were to be conducted and the results collated, they would show that, in the long run, the money dice would return slightly less than $5 per week. Theoretically, the amount is $4.83. This amount, known as the expected value, is the mean of the amounts on the six faces of the dice ([1 + 2 + 4 + 5 + 7 + 10] ÷ 6 = 4.83).
This activity may have given students their fi rst experience of a simulation. Simulation is a procedure developed for answering questions about real problems by running experiments that closely resemble the real situation. TTRRC is a model that is commonly used for probability simulations:
Tool: Select a model to generate outcomes with probabilities that match those of the
real situation.
Trial: Define and conduct a trial, for example, one toss of the dice.
Record: Record the outcome of the trial; that is, whether it was favourable or its
numerical outcome.
Repeat: Repeat the process a large number of times. The accurate estimation of
probability requires the experiment to contain many trials.
Conclusion: Summarise the information and draw conclusions.
The probability of an event is estimated by totalling the number of favourable outcomes and dividing this result by the total number of trials.
Data from a computer simulation
The following data from a computer simulation of the money dice is included for your
information and for possible sharing with students. It clearly shows (i) the very wide variation from year to year and (ii) the expected return over an extended period of time:
The above data can be graphed in a bar graph as below and a line added (using the line tool from the drawing toolbar) to show the $260 break-even point. The graph shows that, over the 20 simulated years, the money dice gave a better return than the $5 per week on 9 occasions. But on 3 of these 9 years (4, 16, and 18), the difference was trivial, and on only one occasion (year 7) was the increased return better than $20.
Over the 20 simulated years, the money dice earned a total of $5,063, while the guaranteed $5 per week brought in $5,200.
Answers to Activity
1. Answers will vary. You may think that $5 guaranteed is best because at least Shelley then knows what she is getting. Or you may think that taking a chance on getting $7 or $10 is better because, some weeks, Shelley will have more to spend.
2. Practical activity. Results will vary.
3. Advice will vary, depending on the results of the experiment (and the values of the person making the recommendation!).
4. Results will vary. It is likely that different groups will have quite different results, so their advice may be quite different, too.
5. Results will vary, but it is likely that a large number of rolls of the dice will give a total that is very similar to the total of $5 per week for 12 months. If this is the case, your advice to Shelley might depend on whether you think it best to have the certainty of a regular income or the possibility of doing better (with the risk of
doing worse).
Key Competencies
Picking Pocket Money can be used to develop these key competencies:
• thinking
• managing self
• relating to others.