This is a level 4 statistics activity from the Figure It Out series.
A PDF of the student activity is included.
Click on the image to enlarge it. Click again to close. Download PDF (1313 KB)
play a probability game to find the chance of winning
find all possible outcomes to the probability game
decide from the data if the game is fair
This diagram shows the areas of Statistics involved in this activity.
The bottom half of the diagram represents the 5 stages of the PPDAC (Problem, Plan, Data, Analysis, Conclusion) statistics investigation cycle.
A copy of the game board (see Copymaster)
FIO, Levels 3-4, Statistics Revised Edition, Left to Chance, page 1
A coin
Classmates
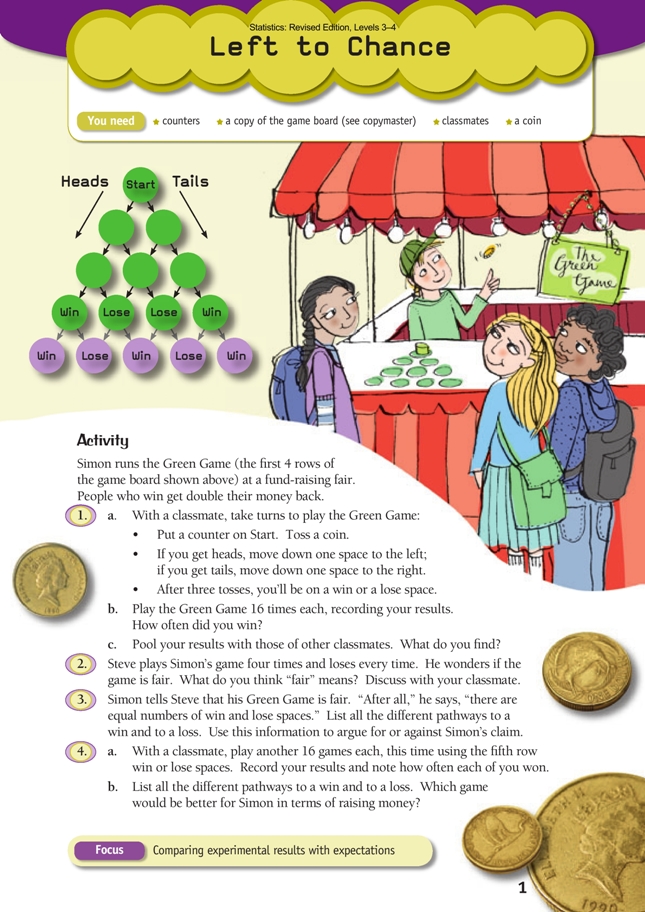
This game explores the concept of “fairness” in relation to the chances of winning or losing a particular game. Even though the game, with its symmetrical board and equal number of “win” and “lose” destinations, looks as if it should be fair, the two outcomes are not at all equally likely.
The Green Game uses the first four rows of the board and the extended game uses all five rows.
Unless you are helping those who may struggle to read the instructions, it is suggested that any introduction to the game should be minimal. The students are likely to get most out of it if they have not been told what to expect. Therefore, as the game progresses, they must try and find out for themselves what is going on.
What is important is that the students keep a record of outcomes. This is the data on which they base and justify their conclusions.
The pattern of results should become clear after a few games: players are much more likely to end up on either of the middle two (lose) circles than on either of the outside (win) circles. This pattern will be confirmed as further games are played and results collated with those of other students.
Although the students are not asked to do this, a suitable tool for fi nding and listing all the outcomes for both the games is a tree diagram. The Answers show how to set one out.
When the students list all the pathways or outcomes (question 3), they will find that there are a total of 8 and that, of this total, only 2 (LLL and RRR) end in a win. All the outcomes are equally likely, so a player has only a 2/8 = 1/4 probability of winning (and a 6/8 = 3/4 probability of losing).
This is the theoretical explanation behind the experimental findings.
Some students will realise that the probability of any particular outcome is given by the calculation 1/2 × 1/2 × 1/2 = 1/8 . This is because, at every choice point on the game board, the probability that the desired path will be followed is 1/2.
Some students may also notice that the probability of a win plus the probability of a loss equals 1 (1/4 + 3/4 = 1). 1 is certainty in terms of probability. It is certain that, if Simon’s game is played, the result will be either a win or a loss; there is no other possible outcome.
Discuss what is meant by equally likely outcomes; not all outcomes are equally likely, and it is important that students realise this. Because of its fundamental symmetry, a coin is equally likely to give a head or a tail when tossed. A milk bottle top does not have such symmetry and is more likely to fall open side up.
Question 4a–b extends the game with a fi fth row of circles. The students will fi nd, this time, that the probability of a win is 8/16 = 1/2. From Simon’s point of view, this would be a very bad fund-raising proposition!
Answers to Activity
1. a. Practical activity
b. Results will vary.
c. Results will vary, but it is likely that there will be considerably more losses than wins (see 3 for explanation).
2. In this context, “fair” means that each person has an equal chance of winning. (Winners do get double their money back, but this is a different issue from “win or lose” chances.)
3. Win: LLL, RRR (L = left, R = right). Loss: RLL, LRL, LLR, LRR, RLR, RRL.
There are 8 equally likely pathways, but only 2 of them lead to a “win”, so the probability of a win is 2/8 = 1/4. So Simon’s game is not fair; he has a 6 in 8 chance of keeping the player’s money.
4. a. Practical activity. Results will vary, but you will probably still have more losses
than wins. You might decide to pool your results with other classmates as you did
earlier and see what difference this makes to the win:loss ratio.
b. Win: LLLL, RRRR, RRLL, LRRL, LLRR, LRLR, RLRL, RLLR.
Loss: RLLL, RLRR, RRLR, RRRL, LRLL, LLRL, LLLR, LRRR.
On a tree diagram, the outcomes are set out (dotted lines for the Green Game) like this:
There are 16 equally-likely pathways. 8 of these give a “win”. So the probability of a win is 8/16 = 1/2.
The game couldn’t be any fairer, but from Simon’s point of view, it wouldn’t be very profitable as a fund-raiser (and in fact, he could make a loss, given that winners get double their money back!). He would raise more money from the 4-row game.
Key Competencies
Left to Chance can be used to develop these key competencies:
• thinking
• participating and contributing.