Getting Started
The purpose of this session is to explore the range of strategies that your students already use to solve multiplication and division problems. This will enable you to evaluate which strategies need to be focused on in greater depth as well as identifying students in your group as "expert" in particular strategies.
Problem 1 (Copymaster 2):
Vanessa bikes 38 kilometres each day for five days. How many kilometres has she travelled by the end of the five days?
Ask students to work out the answer in their head if they can and record their strategy on paper. Some students may need to use recording to ease the memory load. Students who work out the problem quickly could be extended by being asked to check their calculations with a different strategy. Give the students an appropriate amount of thinking time. Then ask them to share their solutions with their learning partner. The following are possible responses:
Note that the convention is to record the multiplier first so equations should be written as 5 x 38 = .
Rounding and compensating:
5 x 38
38 is rounded to 40 so the problem becomes 5 x 40 = 200, then 10 (5 x 2) is subtracted from the product to get 5 x 38 = 190.
In full the strategy might be written as 5 x 38 = 5 x 40 – 5 x 2.
View how to do this using Video 1.
Proportional adjustment:
5 x 38
Solve instead 10 x 19 using doubling and halving (by doubling 5 and halving 38).
In full the strategy might be written as 5 x 38 = 10 x 19
View how to do this using Video 2.
Place value partitioning:
5 x 38
Solve 30 x 5, add 8 x 5.
The strategy can be written as 5 x 38 = 5 x 30 + 5 x 8 or in working form:
View how to do this using Video 3.
As different strategies arise ask the students to explain why they chose to solve the problem in that way. Accept all the strategies that are elicited at this stage, recording them to reflect upon later in the unit (perhaps in a modelling book, on a digital document, or on a poster). Be aware that some students may elect to add rather than multiply.
For example:
You might like to discuss the efficiency of multiplication versus repeated addition.
To provide similar problems alter the numbers in Problem One (Copymaster 2), such as:
Vanessa bikes 46 kilometres each day for four days. How many kilometres has she travelled by the end of the four days?
These problems could also be altered to reflect relevant learning from other area of the curriculum (e.g. 6 children ran 5km in the regional cross-country championships, how far did they run altogether? 4 teams competed in a 20km waka ama race, how far did they travel each day?)
Problem 2 (Copymaster 3):
There are 256 rowers entered in the eights rowing champs at the Maadi Cup, not including the drivers (coxswains).
How many crews of eight rowers can be made?
Ask students to work out the answer in their head if they can and record their strategy on paper. Give the students an appropriate amount of thinking time. Then ask them to share their solutions with their learning partner. The following are possible responses:
Place value partitioning (chunking):
184 ÷ 8
I know that 160 ÷ 8 = 20. That is 20 crews.
There are 24 rowers left. 24 ÷ 8 =3
The answer is 20 + 3 = 23.
View how to do this using Video 4.
Factorisation (proportional adjustment):
Dividing by 8 is like dividing by 2 then 2 then 2 so half 184 is 92 and half 92 is 46 and divide by 2 again leaves me 23 so the answer is 23.
View how to do this using Video 5.
Rounding and compensating:
If there were 200 rowers, that would be 25 crews because 4 x 25 =100 so 8 x 25 = 200. 184 is 16 rowers less. That is two crews. So, the answer is 25 – 2 = 23.
As different strategies arise, ask the students to explain why they chose to solve the problem in that way. Accept all the strategies that are elicited at this stage, recording them to reflect upon later in the unit (perhaps in a modeling book). Watch for repeated subtraction or partial use of multiplication, such as:
10 x 8 = 80
80 + 80 = 160, 20 x 8 = 160
160 + 8 = 168, 168 + 8 = 176, 176 + 8 = 184
So 23 crews can be made
View how to do this using Video 6.
Ask students to reflect on the strategies that have been discussed in the session and evaluate which strategies that they personally need further work on, perhaps using thumb signals - thumbs up - confident and competent with the strategy, thumbs sideways - semi confident, thumbs down - not yet confident. Use this information to plan for your subsequent teaching from the exploring section outlined below.
To provide other related examples change the numbers in Problem Two (Copymaster 3), such as:
There are 212 rowers entered in the fours rowing champs at the Maadi Cup, not including the drivers (coxswains).
How many crews of four rowers can be made?
Exploring
Over the next two to three days, explore the following strategies, making explicit the strategy you are concentrating on as the teacher and the reason for using the selected strategy. For example, In the problem 7 x 29 tidy numbers would be a useful strategy as 29 is close to 30. When sharing, encourage students to also share and justify their strategy use. If you have a wide variety of strategies being used by different students, you might consider implementing a tuakana-teina approach, whereby students work collaboratively and learn from their peers.
The following questions are provided as examples for the promotion of the identified strategies. If the students are not secure with a strategy you may need to make up some of your own questions to address student needs.
The following questions can be used to elicit discussion about the strategy:
- What tidy number or numbers could you use that are close to one of the factors in the problem?
- What do you need to do if you tidy up this number? Why?
- Why is this strategy useful for this problem?
- What knowledge helps you to solve a problem like this?
Place Value Partitioning (Multiplication)
Mani has $54, but he needs 7 times this amount to buy the new mountain bike he wants. How much money does the bike cost?
The place value strategy involves multiplying the ones, and tens separately then combining the partial products. This strategy applies the distributive property of multiplication, as 54 is distributed into 50 + 4. In the above problem the student might say the following:
I multiplied 7 x 50 and got 350, then I multiplied 7 x 4 and got 28. I added 350 and 28 to get 378.
The following questions can be used to elicit discussion about the strategy:
- How can you use your knowledge of place value to solve this problem?
- Why is this strategy useful for this problem?
If the students do not seem to understand the partitioning concept, show the problems physically using place value materials, such as Place Value Blocks, BeaNZ and canisters, or Toy Money. Some students may find it useful to record and keep track of their thinking. An extension of the place value strategy involves the use of standard written form for multiplication.
Use the following questions for further practice if required:
- 3 x 135
- 9 x 66
- 6 x 132
- 8 x 79
Place value partitioning (division)
Pisi has an after-school job at the market, bagging pawpaw into bags of 6. If there are 864 pawpaw to be bagged, how many bags can he make?
The place value partitioning strategy for division involves ‘chunking’ known facts and subtracting them from the answer. Place value partitioning is the basis of the division written form or algorithm. In the case above, a student might think:
100 x 6 = 60 so 100 bags would be 600. 864 – 600 = 264. That leaves me with 264.
I can take 120 away from that, which is 20 x 6. That leaves 144. If I take another 120 pawpaw away I get 24, which is 4 lots of 6. So, I’ve taken away 100 lots, then 20 then 20, then 4… the answer is 144.
This thinking could be recorded as:
If the students do not seem to understand the partitioning concept, show the problems physically, e.g. using place value blocks. Students will find it useful to record and keep track of their thinking, and reduce memory load. An extension of the place value strategy involves the use of standard written form for division.
Use the following questions for further practice if required:
- 760 ÷ 5
- 516 ÷ 4
- 992 ÷ 8
- 3808 ÷ 7
- 522 ÷ 3
- 2505 ÷ 9
Rounding and Compensating (Multiplication)
The Southern Sting netball fans are going to Christchurch to watch a netball game against the Canterbury Tactix.
Each bus is full, with 48 people in it, and there are 9 buses.
How many Sting fans are heading to Christchurch?
The rounding and compensating strategy involves rounding a number in a question to make it easier to solve. In the above question 48 can be rounded to 50 (by adding 2). The problem then becomes 9 x 50 = 450. In order to compensate for the rounding, two lots of 9 people (18) must be subtracted from the ‘rounded’ equation.
If the students do not seem to understand the tidy numbers concept, use place value equipment or a large dotty array to show the problems physically. Some students may find it useful to record and keep track of their thinking. Recording might look like this:
9 x 48 = 9 x 50 – 9 x 24 9 x 40 = 10 x 48 – 1 x 48
= 450 – 18 = 480 - 48
= 432 = 432
View how to do this using Videos Seven and Eight.
Use the following questions for further practice if required, still using the same bus context:
- 7 x 29
- 6 x 38
- 5 x 57
- 3 x 69
- 4 x 97
- 8 x 36
Note that the problems posed here are using a tidying up strategy rather than tidying down. If one of the factors is just over a tidy number (such as 42) then standard place value partitioning tends to be a more useful strategy.
Rounding and compensating (Division)
Sarah uses nine bus tickets every week to travel around town. She wins 162 tickets in a radio competition. How many weeks will the tickets last her?
Rounding and compensating for division involves finding a number that is close to the dividend (starting amount) and working from that number to find an answer. For the question above, a student might say:
I know that 20 multiplied by 9 equals 180. 162 is 18 less than 180, that’s 2 x 9.
The tickets would last her 20 – 2 = 18 weeks.
If the students do not seem to understand the rounding and compensating concept, use place value materials, or a large dotty array, to represent the problems physically. Students may find it useful to record and keep track of their thinking, especially if they partially divide the dividend at first.
View how to do this using Video 7.
Use the same context of bus tickets to pose problems where rounding and compensating is a sensible strategy.
- 343 ÷ 7
- 224 ÷ 8
- 597 ÷ 3
- 392 ÷ 4
- 1764 ÷ 18
Proportional Adjustment (Factorisation)
At the Kapa Haka festival there are 32 schools with 25 students in each group, how many students are there altogether in the groups?
Proportional adjustment involves using knowledge of factors and multiples to create easier equations that have the same answer. Factors are proportionally adjusted to make one (or both) factors easier to work from. In the above problem the factors could be adjusted as follows:
Or, using doubling and halving:
The following questions can be used to elicit discussion about the strategy:
- What could you multiply one of these numbers by to make it easier to work with?
- What would you then need to do to the other number to keep the product (answer) the same?
- Why is this strategy useful for this problem?
- What knowledge helps you to solve a problem like this?
If the students do not seem to understand the proportional adjustment concept, use a large dotty array to show the problems physically. Some students may find it useful to record and keep track of their thinking.
View how to do this using Video 8.
Use the following questions for further practice if required:
- 25 x 200 (multiply and divide by five)
- 27 x 3 (thirding and trebling)
- 33 x 18 (thirding and trebling)
- 44 x 25 (multiply and divide by four)
- 24 x 125 (multiply and divide by eight)
Proportional Adjustment (Division)
A fishing company collects a total of 912 pipis over the course of six months.
How many pipis were collected each month?
In division, proportional adjustment involves changing both numbers in the equation by the same factor. Therefore, the numbers used to proportionally adjust the problem must be factors of both numbers in the equation (dividend and divisor). For example:
If I divide the 912 by 3 and 6 by 3, my equation becomes 304 ÷ 2 which has the same answer. Half of 304 is 152. So, each month 152 pipis were collected.
The following questions can be used to elicit discussion about the strategy:
- What is a common factor of both numbers that could be used to make the problem easier?
- Why is this strategy useful for this problem?
- What knowledge helps you to solve a problem like this?
If the students do not seem to understand the proportional adjustment concept, use equipment to show the problems physically. Some students may find it useful to record and keep track of their thinking.
Use the following questions for further practice if required. Consider how these questions can reflect the cultural diversity and learning interests of your class.
- 636 ÷ 12 = 212 ÷ 4 = 106 ÷ 2 = 53
- 480 ÷ 15 = 96 ÷ 3 = 32
- 1962 ÷ 18 = 981 ÷ 9 = 109
- 1498 ÷ 14 = 749 ÷ 7 = 107
- 1728 ÷ 16 = 864 ÷ 8 = 108
Factorisation (Multiplication and Division)
Stephanie has 492 extra marbles to share evenly amongst six of her friends. How many marbles will each person get?
The factorisation strategy involves using factors to simplify the problem. In this instance six can be factorised as 2 x 3. This means dividing by two, then three, has the same net effect as dividing by 6. Likewise, multiplying by two, then three, has the same net effect as multiplying by 6. In applying factorisation to the above problem, a student might think:
6 is the same as 2 x 3. So I halve 492, then third the result. If I divide 492 by 2 I get 246. 246 divided by 3 is 82. The answer is 82.
The following questions can be used to elicit discussion about the strategy:
- How can you use your knowledge of factors to solve this problem?
- Why is a factorisation strategy useful for this problem?
If the students do not understand the factorisation concept, show the problems physically. Some students may find it useful to record and keep track of their thinking.
Use the following questions for further practice if required. Consider how these questions can reflect the cultural diversity and learning interests of your class.
- 144 ÷ 4 (÷2, ÷2)
- 270 ÷ 6 (÷3, ÷2)
- 612 ÷ 9 (÷3, ÷3)
- 532 ÷ 8 (÷2, ÷2, ÷2)
- 348 ÷ 12 (÷2, ÷2, ÷3)
- 4320 ÷ 27 (÷3, ÷3, ÷3)
- 135 x 12 (x2, x2, x3)
- 43 x 8 (x2, x2, x2)
- 27 x 16 (x2, x2, x2, x2)
Each day follow a similar lesson structure to the introductory session, with students sharing their solutions to the initial questions and discuss why these questions lend themselves to the strategy being explicitly taught. Conclude each session by having students make some statements about when this strategy would be useful and why (e.g. "Place value is useful when there is limited renaming required" or "Factorisation is useful when one of the factors is able to be renamed as a series of smaller factors"). It is important to record these key ideas as they will be used for reflection at the end of the unit.
Reflecting
As a conclusion to this unit of learning, give the students the following five problems in context to solve (Copymaster 4). Ask students to predict which strategy they think will be useful for each problem and why they think this is the most useful strategy before they solve the problem. After they have solved the problems, discuss the effectiveness of their selected strategies for the problems.
There may be problems for which two or more multiplication and division strategies are equally efficient. However, using additive strategies with these problems will not be efficient.
Problems for discussion (more than one strategy might be suitable for these)
- 48 x 50 (proportional adjustment)
- 559 ÷ 13 (place value partitioning)
- 29 x 16 (rounding and compensating)
- 1632 ÷ 24 (proportional adjustment)
- 78 x 11 (place value partitioning)
- 704 ÷ 8 (factorisation)
- 153 ÷ 17 (rounding and compensating)
- 421 x 8 (factorisation)
Ask the students to create problems for a partner where one of the strategies covered in this unit is the most useful.
Conclude the unit by showing the students the questions asked in the initial session again and discuss whether they would solve them in a different way now, why or why not. Review the modeling book or record of statements or generalisations about the strategies and make any changes.

Whakataukī
This unit requires students to find relationships between variables and calculate probabilities. It is set in the context of exploring ideas related to whakataukī (proverbs).
This unit spans number, algebra, measurement and statistics. Several important mathematical concepts are encountered:
Variables are measures of some feature or attribute. A variable might come from simply counting, such as finding the number of strands of spaghetti. Most variables come from measurements, such as the mass of an object or the time in seconds. Relationships are rules (functions) that connect two or more variables. For example, the number of handshakes possible in a group of five people is 4 + 3 + 2 + 1 = 2 x 5. Finding more data from different numbers of people might lead to a function rule for finding the number of handshakes, such as h = n(n-1)/2, where h is the number of handshakes and n is the number of people.
There are a multitude of different relationship types, but a few are privileged in primary and lower secondary school for two reasons; they are relatively simple and common in the real world.
Probability is a measure of the chance of an event occurring. Probabilities are a fraction, They are comprised of the number of favoured outcomes out of the number of possible outcomes. For example, the chance of getting an even number with one dice roll is one half since there are three favoured outcomes (2, 4, 6) out of six possible outcomes (1, 2, 3 ,4, 5, 6) and 3/6=1/2.
The learning opportunities in this unit can be differentiated by providing or removing support to students and by varying the task requirements. Ways to support students include:
The sessions in this unit draw on a limited set of whakataukī. Several online sites provide a large range of proverbs based around themes. Whatataukī typically employ metaphors to represent a moral purpose. A useful way to adapt the contents of this unit is to encourage students to choose a whakataukī that has significance to them. They can design an experience for their peers that captures the moral purpose of the whakataukī. Investigating the proverb, and its meaning, may serve many other areas of the curriculum, particularly literature, social and pure sciences, and wellbeing.
Session One
In this session we consider the mathematics of relationships among people (whanaungatanga) using whakataukī (proverbs). Such relationships are important for all creatures and physical objects in the real world.
He aroha whakatō, he aroha puta mai.
If kindness is sown, then kindness you shall receive.
How hard will it be for Tīpene to complete the wero (challenge)?
How many people will Tīpene "give a kindness" to on each day of the week? Remember that he starts on Monday and sees Kuia again on Sunday.
How many people will Tīpene do a kindness to in total from Monday to Sunday?
Let students investigate the problem. You might allow calculator use for some students, but most calculations can be done mentally. Look for students to organise their data. It may be necessary for you to provide graphic organisers to help students organise their data. A table, like the one shown below, could be used.
Obviously, the number of kindnesses doubles from the previous day. You might discuss students’ strategies for doubling, e.g. adding to itself or multiplying by two.
Consider: Do students notice that the total is one less than the number of kindnesses on the next day? For example, a total of 63 on Saturday is one less than the number of new kindnesses, 64, on Sunday.
You might ask students to write the last few slides for Kuia and Tīpene (PowerPoint 1). Is Tīpene able to complete his mahi? Does he get to play video games?
The answer is dependent on how long Tipene takes to complete a favour. 64 favours at a rate of 30 minutes each will take 32 hours. That is longer than the number of hours available on Sunday.
On what day did Tīpene give 16 kindnesses?
How many kindnesses did Tīpene give on Saturday (Day 6)?
There are about 5 million people in Aotearoa/New Zealand.
How many days would Tīpene need to do kindnesses for, so everyone received a gift from him?
Of course, he could never physically do that many kindnesses!
Session Two
The next investigation is an extension for capable mathematicians. This session could be adapted to look at a different native bird which may be more relevant to your local context. Another whakataukī that can be used to illustrate exponential growth is:
Mēnā ka tiakina te kiwi he maha ngā uri
If protected, the kiwi has many descendants
Let’s assume there are only 50 fertile female kiwi left in New Zealand and they are all protected. There are also 50 fertile male kiwi as well. Half of the chicks that hatch are male and half are female. Let’s say a female begins laying in her third year of life and she lays two eggs per year for 15 years. Find a way to predict the number of kiwi alive after 15 years, if we protect them all.
Start the students off by considering the first three years. Draw a table like this and discuss as you fill it in:
What will the table look like at the end of Year 1? Look for students to interpret the conditions and suggest the appropriate numbers to go in the table.
Discuss why the table doesn't have columns for males (half the chicks are female and half are male, so you can just double the female population to find the total population).
Ask students to create their own table and extend it.
What will the table look like at the end of Year 2?
Ask them to extend their table for the third year.
Why will the table get more complicated in Year three? The 50 young females from Year 1 will start to breed.
Students should apply the condition that new females lay eggs in their third year of life.
How many kiwi would there be after 15 years?
The spreadsheet shows that if totally protected, 100 kiwi would become over 150 000 in 15 years. It is an impressive result but shows that conservation efforts can have dramatic effects.
https://www.nzonscreen.com/title/seven-black-robins-1981
https://youtu.be/MUgpl5X6_xo
What happens to the population prediction if 10% of kiwi die of natural causes each year?
What happens to the population prediction if the fertility rate changes from two eggs per year to three?
Session Three
Whiria te tangata
Weave the people together.
Do you know of situations where unity works?
A related whakataukī is:
Mā tini mā mano ka rapa te whai.
By many, by thousands, the work will be accomplished (Many hands make light work).
Imagine this strand of spaghetti represents the strength of a single person. A single strand may not be strong, but many strands working together may hold a lot of weight.
For this experiment, each group of students will need:
Dry strands of spaghetti, paper cup, piece of string, duct tape, scissors, paper clip, weights (e.g. coins, sinkers, washers), scales (as sensitive as possible).
What is represented on each axis? (x axis shows the number of strands of spaghetti (independent or explanatory variable) and the y axis shows the mass in grams upon breaking (dependent or response variable))
Is there a linear relationship between the two variables? (The first graph suggests linear but the second does not)
Whiria te tangata
Weave the people together
What does the experiment suggest about the importance of unity?
Session Four
Another whakataukī about relationships is:
Ehara taku toa i te toa takitahi, engari he toa takitini
My strength is not from myself alone, but from the strength of the group.
This whakataukī is about the fact that part of the strength of a group is the number of interpersonal connections that can be made. The relationship between the size of the group and the number of connections is not linear.
How many two person relationships are possible with five people?
What shape is formed by the connection lines? (a pentagram inside a pentagon)
What is the total number of two person connections? (10)
How many connections does each person make? (Four)
If 5 x 4 = 20, why are there only ten connections? (Each connection can be in two directions, A to B and B to A)
Go inside and provide the students with Copymaster 2. The investigation aims at finding a general rule for the number of two person connections with n people. After a suitable time, gather the class to share their ideas.
The completed table should look like this:
Why does the rule involve multiplying the number of people by one less than the number of people? (Each person can connect with each of the other people in the group)
Why is the number of connections halved? (Each connection is counted twice)
This is like finding all the diagonals of a polygon.
Imagine six people. The distant friend connections are:
Each person has p - 3 = 4 connections to distant friends. That makes 7 x 4 = 28 one-way connections. Half of 28 equals 14, the number of two-way connections.
In general, if p represents the number of people, then the number of connections, c, is given by c=p(p+3)/2. Note that recording the relationship algebraically is usually attempted at higher levels.
Session Five
In this session students confront their bias towards subjective judgement in situations involving chance. A good example of subjectivity is that students often believe that six is harder to get on a standard dice roll, than the other numbers one to five. Researchers believe that this bias is linked to games where it is crucial to roll a six, e.g. to escape jail in Monopoly. The urgency of getting a particular outcome affects people’s perceptions of how easy it is to get that outcome.
He manako te kōura i kore ai.
There are no crayfish as you set your heart on them.
I have a normal dice here. My Kuia (Grandmother) says if I do all my mahi I can roll this dice. If it lands on ono (six) I get crayfish for tea. Is that likely to happen?
(1)
(2)
(3)
(4)
(5)
(6)
Example:
Why do so many of you think tahi, toru or rima are most likely, and I won’t get crayfish?
Is it just luck, or can I say what my chance of getting crayfish is?
In the case of a single dice six outcomes are possible; 1, 2, 3, 4, 5 or 6. My desired outcome, ono, has a ‘one out of six’ chance of occurring. You might go to one of the many dice simulators online and look at what occurs with a sample of 120 dice rolls. If students have digital devices each member of the class might carry out 120 virtual rolls.
Will you find a way to get what you desire? – lots of crayfish!
Or will the whakataukī prove correct?
Using Copymaster 3 students cut out many paper kōura. Students also need opaque plastic cups, labels A, B, C, D, E for the tops of the cups, and cards labelled 0, 1, 2, 4, 8, also made from Copymaster 3. You might use Slide One of PowerPoint 4 to illustrate the game. Without the PowerPoint on show you can edit the slides which includes moving them around.
There are two people in the game, the guest and the host. A turn goes like this:
What are your chances of picking four cups in a row that leave only the eight kōura? (one fifth)
What are your chances of getting at least two kōura? (three of the five cups cover two or more kōura, so the chances are three fifths.
Would you take the offer, or play on? Why?
What are your chances of getting more than what is offered, if you play on?
Is the offer reasonable? Explain why.
Dear family and whānau,
This week we have been exploring whakataukī, Māori proverbs. Whakataukī have symbolic meaning and offer wisdom about how to behave appropriately towards others and to care for our environment. The week we explored the importance of connecting to other people, of conserving wildlife, of finding strength in numbers, and not wishing too hard for things that are hard to get. Do you have proverbs that are special to your family? If you would like to, you could send these to school for us to share in the classroom.
Multiplication and Division Pick n Mix 1
This unit presents a range of strategies for solving multiplication and division problems with multi-digit whole numbers. Students are encouraged to notice the structure of problems, and to anticipate which strategies might be best suited to solving them. This unit builds on the ideas presented in the Multiplication Smorgasbord session in Book 6: Teaching Multiplication and Division.
The New Zealand Curriculum requires students to understand and use a range of mental, written and digital calculation strategies to multiply and divide multi-digit whole numbers. This unit of work is useful for students working at or towards Level Four Stage 7 - Advanced Multiplicative of the Number Framework). Students at this stage partition and recombine numbers to simplify calculations and draw on their knowledge of multiplication facts and related division facts with factors up to ten. Understanding of whole number place value underpins all strategies in this unit.
The key teaching points are:
The learning opportunities in this unit can be differentiated by providing or removing support to students and by varying the task requirements. Ways to differentiate include:
The contexts for this unit include cycling, working at a fruit shop, transporting people to netball, rowing crews, and delivering pamphlets. Other situations of relevance to your students might be used to capitalise on contextual knowledge and increase motivation. For example, fundraising for an event, preparing a class feast, and organising teams for waka ama may provide useful story shells.
Getting Started
The purpose of this session is to explore the range of strategies that your students already use to solve multiplication and division problems. This will enable you to evaluate which strategies need to be focused on in greater depth as well as identifying students in your group as "expert" in particular strategies.
Problem 1 (Copymaster 2):
Vanessa bikes 38 kilometres each day for five days. How many kilometres has she travelled by the end of the five days?
Ask students to work out the answer in their head if they can and record their strategy on paper. Some students may need to use recording to ease the memory load. Students who work out the problem quickly could be extended by being asked to check their calculations with a different strategy. Give the students an appropriate amount of thinking time. Then ask them to share their solutions with their learning partner. The following are possible responses:
Note that the convention is to record the multiplier first so equations should be written as 5 x 38 = .
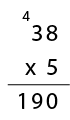
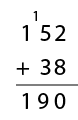
Rounding and compensating:
5 x 38
38 is rounded to 40 so the problem becomes 5 x 40 = 200, then 10 (5 x 2) is subtracted from the product to get 5 x 38 = 190.
In full the strategy might be written as 5 x 38 = 5 x 40 – 5 x 2.
View how to do this using Video 1.
Proportional adjustment:
5 x 38
Solve instead 10 x 19 using doubling and halving (by doubling 5 and halving 38).
In full the strategy might be written as 5 x 38 = 10 x 19
View how to do this using Video 2.
Place value partitioning:
5 x 38
Solve 30 x 5, add 8 x 5.
The strategy can be written as 5 x 38 = 5 x 30 + 5 x 8 or in working form:
View how to do this using Video 3.
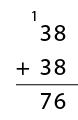
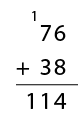
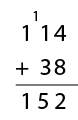
As different strategies arise ask the students to explain why they chose to solve the problem in that way. Accept all the strategies that are elicited at this stage, recording them to reflect upon later in the unit (perhaps in a modelling book, on a digital document, or on a poster). Be aware that some students may elect to add rather than multiply.
For example:
You might like to discuss the efficiency of multiplication versus repeated addition.
To provide similar problems alter the numbers in Problem One (Copymaster 2), such as:
Vanessa bikes 46 kilometres each day for four days. How many kilometres has she travelled by the end of the four days?
These problems could also be altered to reflect relevant learning from other area of the curriculum (e.g. 6 children ran 5km in the regional cross-country championships, how far did they run altogether? 4 teams competed in a 20km waka ama race, how far did they travel each day?)
Problem 2 (Copymaster 3):
There are 256 rowers entered in the eights rowing champs at the Maadi Cup, not including the drivers (coxswains).
How many crews of eight rowers can be made?
Ask students to work out the answer in their head if they can and record their strategy on paper. Give the students an appropriate amount of thinking time. Then ask them to share their solutions with their learning partner. The following are possible responses:
Place value partitioning (chunking):
184 ÷ 8
I know that 160 ÷ 8 = 20. That is 20 crews.
There are 24 rowers left. 24 ÷ 8 =3
The answer is 20 + 3 = 23.
View how to do this using Video 4.
Factorisation (proportional adjustment):
Dividing by 8 is like dividing by 2 then 2 then 2 so half 184 is 92 and half 92 is 46 and divide by 2 again leaves me 23 so the answer is 23.
View how to do this using Video 5.
Rounding and compensating:
If there were 200 rowers, that would be 25 crews because 4 x 25 =100 so 8 x 25 = 200. 184 is 16 rowers less. That is two crews. So, the answer is 25 – 2 = 23.
As different strategies arise, ask the students to explain why they chose to solve the problem in that way. Accept all the strategies that are elicited at this stage, recording them to reflect upon later in the unit (perhaps in a modeling book). Watch for repeated subtraction or partial use of multiplication, such as:
10 x 8 = 80
80 + 80 = 160, 20 x 8 = 160
160 + 8 = 168, 168 + 8 = 176, 176 + 8 = 184
So 23 crews can be made
View how to do this using Video 6.
Ask students to reflect on the strategies that have been discussed in the session and evaluate which strategies that they personally need further work on, perhaps using thumb signals - thumbs up - confident and competent with the strategy, thumbs sideways - semi confident, thumbs down - not yet confident. Use this information to plan for your subsequent teaching from the exploring section outlined below.
To provide other related examples change the numbers in Problem Two (Copymaster 3), such as:
There are 212 rowers entered in the fours rowing champs at the Maadi Cup, not including the drivers (coxswains).
How many crews of four rowers can be made?
Exploring
Over the next two to three days, explore the following strategies, making explicit the strategy you are concentrating on as the teacher and the reason for using the selected strategy. For example, In the problem 7 x 29 tidy numbers would be a useful strategy as 29 is close to 30. When sharing, encourage students to also share and justify their strategy use. If you have a wide variety of strategies being used by different students, you might consider implementing a tuakana-teina approach, whereby students work collaboratively and learn from their peers.
The following questions are provided as examples for the promotion of the identified strategies. If the students are not secure with a strategy you may need to make up some of your own questions to address student needs.
The following questions can be used to elicit discussion about the strategy:
Place Value Partitioning (Multiplication)
Mani has $54, but he needs 7 times this amount to buy the new mountain bike he wants. How much money does the bike cost?
The place value strategy involves multiplying the ones, and tens separately then combining the partial products. This strategy applies the distributive property of multiplication, as 54 is distributed into 50 + 4. In the above problem the student might say the following:
I multiplied 7 x 50 and got 350, then I multiplied 7 x 4 and got 28. I added 350 and 28 to get 378.
The following questions can be used to elicit discussion about the strategy:
If the students do not seem to understand the partitioning concept, show the problems physically using place value materials, such as Place Value Blocks, BeaNZ and canisters, or Toy Money. Some students may find it useful to record and keep track of their thinking. An extension of the place value strategy involves the use of standard written form for multiplication.
Use the following questions for further practice if required:
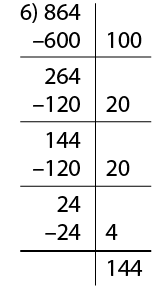
Place value partitioning (division)
Pisi has an after-school job at the market, bagging pawpaw into bags of 6. If there are 864 pawpaw to be bagged, how many bags can he make?
The place value partitioning strategy for division involves ‘chunking’ known facts and subtracting them from the answer. Place value partitioning is the basis of the division written form or algorithm. In the case above, a student might think:
100 x 6 = 60 so 100 bags would be 600. 864 – 600 = 264. That leaves me with 264.
I can take 120 away from that, which is 20 x 6. That leaves 144. If I take another 120 pawpaw away I get 24, which is 4 lots of 6. So, I’ve taken away 100 lots, then 20 then 20, then 4… the answer is 144.
This thinking could be recorded as:

If the students do not seem to understand the partitioning concept, show the problems physically, e.g. using place value blocks. Students will find it useful to record and keep track of their thinking, and reduce memory load. An extension of the place value strategy involves the use of standard written form for division.
Use the following questions for further practice if required:
Rounding and Compensating (Multiplication)
The Southern Sting netball fans are going to Christchurch to watch a netball game against the Canterbury Tactix.
Each bus is full, with 48 people in it, and there are 9 buses.
How many Sting fans are heading to Christchurch?
The rounding and compensating strategy involves rounding a number in a question to make it easier to solve. In the above question 48 can be rounded to 50 (by adding 2). The problem then becomes 9 x 50 = 450. In order to compensate for the rounding, two lots of 9 people (18) must be subtracted from the ‘rounded’ equation.
If the students do not seem to understand the tidy numbers concept, use place value equipment or a large dotty array to show the problems physically. Some students may find it useful to record and keep track of their thinking. Recording might look like this:
View how to do this using Videos Seven and Eight.
Use the following questions for further practice if required, still using the same bus context:
Note that the problems posed here are using a tidying up strategy rather than tidying down. If one of the factors is just over a tidy number (such as 42) then standard place value partitioning tends to be a more useful strategy.
Rounding and compensating (Division)
Sarah uses nine bus tickets every week to travel around town. She wins 162 tickets in a radio competition. How many weeks will the tickets last her?
Rounding and compensating for division involves finding a number that is close to the dividend (starting amount) and working from that number to find an answer. For the question above, a student might say:
I know that 20 multiplied by 9 equals 180. 162 is 18 less than 180, that’s 2 x 9.
The tickets would last her 20 – 2 = 18 weeks.
If the students do not seem to understand the rounding and compensating concept, use place value materials, or a large dotty array, to represent the problems physically. Students may find it useful to record and keep track of their thinking, especially if they partially divide the dividend at first.
View how to do this using Video 7.
Use the same context of bus tickets to pose problems where rounding and compensating is a sensible strategy.
Proportional Adjustment (Factorisation)


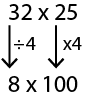
At the Kapa Haka festival there are 32 schools with 25 students in each group, how many students are there altogether in the groups?
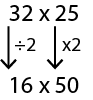
Proportional adjustment involves using knowledge of factors and multiples to create easier equations that have the same answer. Factors are proportionally adjusted to make one (or both) factors easier to work from. In the above problem the factors could be adjusted as follows:
Or, using doubling and halving:
The following questions can be used to elicit discussion about the strategy:
If the students do not seem to understand the proportional adjustment concept, use a large dotty array to show the problems physically. Some students may find it useful to record and keep track of their thinking.
View how to do this using Video 8.
Use the following questions for further practice if required:
Proportional Adjustment (Division)
A fishing company collects a total of 912 pipis over the course of six months.
How many pipis were collected each month?
In division, proportional adjustment involves changing both numbers in the equation by the same factor. Therefore, the numbers used to proportionally adjust the problem must be factors of both numbers in the equation (dividend and divisor). For example:
If I divide the 912 by 3 and 6 by 3, my equation becomes 304 ÷ 2 which has the same answer. Half of 304 is 152. So, each month 152 pipis were collected.
The following questions can be used to elicit discussion about the strategy:
If the students do not seem to understand the proportional adjustment concept, use equipment to show the problems physically. Some students may find it useful to record and keep track of their thinking.
Use the following questions for further practice if required. Consider how these questions can reflect the cultural diversity and learning interests of your class.
Factorisation (Multiplication and Division)
Stephanie has 492 extra marbles to share evenly amongst six of her friends. How many marbles will each person get?
The factorisation strategy involves using factors to simplify the problem. In this instance six can be factorised as 2 x 3. This means dividing by two, then three, has the same net effect as dividing by 6. Likewise, multiplying by two, then three, has the same net effect as multiplying by 6. In applying factorisation to the above problem, a student might think:
6 is the same as 2 x 3. So I halve 492, then third the result. If I divide 492 by 2 I get 246. 246 divided by 3 is 82. The answer is 82.
The following questions can be used to elicit discussion about the strategy:
If the students do not understand the factorisation concept, show the problems physically. Some students may find it useful to record and keep track of their thinking.
Use the following questions for further practice if required. Consider how these questions can reflect the cultural diversity and learning interests of your class.
Each day follow a similar lesson structure to the introductory session, with students sharing their solutions to the initial questions and discuss why these questions lend themselves to the strategy being explicitly taught. Conclude each session by having students make some statements about when this strategy would be useful and why (e.g. "Place value is useful when there is limited renaming required" or "Factorisation is useful when one of the factors is able to be renamed as a series of smaller factors"). It is important to record these key ideas as they will be used for reflection at the end of the unit.
Reflecting
As a conclusion to this unit of learning, give the students the following five problems in context to solve (Copymaster 4). Ask students to predict which strategy they think will be useful for each problem and why they think this is the most useful strategy before they solve the problem. After they have solved the problems, discuss the effectiveness of their selected strategies for the problems.
There may be problems for which two or more multiplication and division strategies are equally efficient. However, using additive strategies with these problems will not be efficient.
Problems for discussion (more than one strategy might be suitable for these)
Ask the students to create problems for a partner where one of the strategies covered in this unit is the most useful.
Conclude the unit by showing the students the questions asked in the initial session again and discuss whether they would solve them in a different way now, why or why not. Review the modeling book or record of statements or generalisations about the strategies and make any changes.
Family and whānau,
This week we have been exploring strategies for multiplying and dividing numbers. Ask your child to show you two different ways to solve each of these problems. They should be able to explain their thinking to you and show their thinking process with a diagram.
Transformations
This unit explores important ideas about reflective and rotational symmetry.
Both reflection and rotation are isometries. This means that a shape can be transformed (i.e. reflected or rotated) without altering the measures or metrics (e.g. the arrangement of points with relation to each other). Within this, the lengths, angles and areas of 2-dimensional shapes and their images under reflection and rotation remain the same. For example, in the image below a polygon is reflected on the y-axis. The lengths AB and A’B’ are the same, as are <CDE and <C’D’E’ and the areas of the polygon and its image (8½ square units).
The only changes from shape to image in reflection and rotation are to do with orientation. In reflection the shape and image face opposite directions relative to the line of reflective symmetry (mirror line). In rotations orientation depends on the angle of rotation.
Invariance of length, angle and area are insufficient to locate the image of a shape under reflection and rotation. In reflection, the location of points and their image are the same perpendicular (90°) distance to the mirror line. B and B’ are both 3 units of length away from the y-axis at right angles.
In rotation, points on the shape and on the image are the same distance to the centre of rotation, meaning the point through which the shape was rotated. In this example, the distances of both A and A’ to the centre of rotation (0,0) are equal. Note that the angle formed by the distance rays is 90° the angle of rotation anti-clockwise.
Specific Teaching Points
Research by Ramful and Lowrie (2015) shows that students tend to rely on their spatial thinking rather than analytically considering whether or not a shape is the image of another under reflection or rotation. Spatial thinking involves capturing an image of a shape and transforming it mentally. Spatial imagery is important and is extremely useful in a wide variety of fields, such as engineering, design, architecture, building and surgery.
However, advancing spatial reasoning requires students to connect their spatial imagery and analytic thinking. Analytic thinking involves considering the properties of shapes under transformation. Knowing and applying the invariant properties of reflection and rotation allows students to solve more complex problems than those accessible by visualisation alone.
The learning opportunities in this unit can be differentiated by providing or removing support to students, or by varying the task requirements. Ways to support students include:
This unit is focused on reflection and rotations. These symmetries are common in everyday figures. Use examples from real life that are appropriate to the interests and cultural identities of your students. Traditional Māori and Pasifika designs and art forms such as whakairo (carving) and tapa cloth, use reflection and rotation. Logos of well-known brands, tiles, wallpaper patterns, and natural shapes in the environment, such as reflections in lakes, provide other possible contexts.
Prior Experience
It is anticipated that students will have prior experience of reflecting and rotating shapes without necessarily attending to invariant properties. They may have experience of creating patterns such as tessellations and kowhaiwhai by use of reflection and rotation. Games such as Simon Says could be used to engage students in the context of "reflecting" and "rotating" actions.
Session One
In this session students explore the invariant properties of reflection.
The camera only sees one real half of Harry. The other half is the image of his real half after reflection. A student might physically model how the effect works.
Pay particular attention to what becomes of the key points (label them) when they are reflected to form the image. This may need to be done systematically. For example:
Look for the following:
Session Two
In this session the theme of symmetry is continued with focus on the internal symmetry of a shape. Students will need a digital picture of their face looking straight onto the camera with their eyes level.
Session Three
In this session students extend their concept of symmetry to include rotational symmetry, looking for invariant properties and testing to see if a shape has internal rotational symmetry.
https://www.geogebra.org/m/PhvUvyqz (symmetry of a snowflake and octagon)
Suppose you have a polygon that has some key points. These key points have coordinates such as A = (1,2), B = (3,5), C = (6,6) etc.
Rotate the polygon 180°. What is the connection between the coordinates of each key point and the coordinates of the image of those points, A’, B’, C’, etc.
Can you generalise what happens to any key point under a 180° rotation about the origin?
Try rotations of 90° and 270°.
Can you generalise about the image of any key points under these rotations?
Session Four
In this session students engage in an investigation that applies reflective and rotational symmetry. Students will work in small groups. Each group will need a set of paper squares which are readily available at stationery and dollar shops. They will also need a compass.
Giving the shapes names is helpful in identifying them, especially if the names relate to real world shapes, such as ‘hedgehog’ and ‘lightning bolt’.
Kia ora parents and whānau,
This week we are studying transformations of shapes. In particular, we are looking at the features of a shape that change or stay constant as we reflect or rotate the shape. Encourage your child to look around the house and gardens for symmetrical shapes. Good examples might be dinner plates, plants and flowers, logos on products (cars and sporting apparel are good examples), and toys. Ask your child to explain the types of symmetry each shape has.
Solving linear equations
This unit teaches students to identify linear relationships and solve linear equations in context.
Algebra started with the need to solve problems. Al Khwarizmi, a Persian mathematician, was arguably the first person to represent linear and quadratic problems in symbolic form, and solve the problems by processes of ‘restoration’, i.e., equivalent operations that conserved equality. In fact, the word for algebra comes from the Arabic word for restoration.
It is fitting then that modern approaches to algebra focus on the thinking that underpins the symbolic systems. Algebraic thinking is concerned with generalisation. Letters, words, tables, graphs, networks, etc., are cultural tools that enable us to represent, then think with, those generalisations. With representational tools we are capable of ‘amplified cognition’ in that we can anticipate results that would never be possible if we relied solely on the physical environment, and on our limited capacity to process ideas just mentally.
Generalisation begins with noticing patterns and structures. A pattern is a consistency, that is something that occurs in a predictable way. It is the ‘what’ of algebraic thinking. Structure is about the organisation of patterns. It is the ‘how’ and sometimes the ‘why’ of generalisation. From noticing pattern and structure, we develop properties. For example, early counting involves pattern and structure. The ‘fourness’ of a collection comes from noticing sameness among collections of four, irrespective of the size, colour, texture of the objects. Structure of counting involves ideas like the order of counting the objects doesn’t matter.
Specific Teaching Points
In upper primary school, learning experiences for algebraic thinking typically begin with patterns. Usually these patterns are spatial and may be connected to some meaningful life context, though number patterns are also rich in opportunity. Patterns involve variables, that is features, some of which can be quantified. For example, consider this simple spatial pattern.
Among the variables we might discern that the ‘tower’ has height and each ‘tower’ is made of some number of squares. Height and number of cubes may not be the only variables, just those we notice. Variables change, that is height varies and so does the number of squares in the ‘tower’. We might try to find a relation between the variables, describe and represent that relation, and use it to predict how the pattern grows beyond what we can see. Then we are thinking of the properties and representations in a sophisticated way.
During this process, it is likely we will need to systematically organise the data from the pattern. A table of values is a productive, generic strategy that allows us to represent patterns, as demonstrated below:
The danger in moving to an organised numeric strategy (i.e. a table) too early is that it may negate what we can ‘see’ in the pattern visually. Noticing and reasoning may be inductive, that is tied to the incremental change of the figures. For example:
Noticing and reasoning can also be abductive, that is based on the structure of one example.
Noticing and reasoning can be deductive, that is based on making assumptions about structure and reasoning with the assumptions. For example, we might assume that the tower is composed of an array of something multiplied by three plus two.
From the assumptions we might deduce the appearance of towers much further on in the sequence, e.g. A tower 100 high will contain 2 + 99 x 3 squares. Ways of ‘seeing’ the pattern are manifest in relations within the table of values. For example, inductive thinking leads to seeing the values in the bottom row increasing by three each time. Abductive reasoning might support seeing this relation in the table:
Representing the relation as an algebraic equation involves two important and connected types of knowledge, related to the language conventions (semiotics), and to the nature of variables. We might write s = 3h – 1, or s = 3(h - 1) + 2, or s = 2h + (h – 1), depending on what we notice. The equations are meaningless to anyone else unless we clearly define what the variables, s and h, represent. Note that both and s refer to quantities that vary and are not fixed objects, such as houses or towers. Quantities are a combination of count and measurement unit. In this case h expresses unit lengths in height, and s refers to an area of squares. 3h means h multiplied by three, not thirty-something, and 3(h - 1) means that one is subtracted from h before the multiplication by three occurs. Working with variables requires acceptance of lack of closure, that is thinking with an object (h in this case) without specifically knowing what it is. For example, knowing that 3(h – 1) = 3h – 3 is true, irrespective of whatever the value of h, is itself a generalisation. The equals sign represents a statement of ‘transitive balance’ meaning that the balance is conserved if equivalent operations are performed on both sides of the equation. Knowledge of which operations conserve equality and those which disrupt it are important generalisations about the properties of numbers under those operations, e.g., distributive property of multiplication.
This unit specifically deals with relations that are linear. The first sign of linearity is that there is constant difference in the increase or decrease of one variable, as the value of the other increases by one. In the table above the number of squares increases by three as height increases by one.
Note that this graph shows a relation, not a function, since the values of variables are discrete, not continuous. There are some important connections between features of the algebraic equation, the table and the graph of a linear relation. Constant difference is represented by the coefficient of the independent variable (s = 3h -1 in this case), differences of three in the bottom values of the table, and a slope of three (change in s for every unit change in h). The constant in the equation (- 1) is reflected in the table by a need to adjust the value of 3h by subtracting one to get the value of s, and reflected in the graph as a downward translation (shift), of the graph for s = 3h, by one unit. This results in the intercept of the graph with the s axis being (0, -1), not the origin (0, 0).
Simple linear equations occur when the value of one variable in a relation or function is set and the other must be found. For example, with the tower problem this problem might be posed; “A tower in the pattern has 98 squares. How high is the tower?” Depending on the equation used to represent the relation, this problem can be expressed as 3h – 1 = 98, 3(h – 1) + 2 = 98 or 2h + (h – 1) = 98. Linear equations with the variable on both sides occur when two conditions are equalised. An example might be, “Both Lilly and Todd look at the same tower. Lilly notices that the number of squares in the tower is three times the height less one. Todd notices that the number of squares is two times the height plus 18. How tall is the tower?” This problem can be written as 3h – 1 = 2h + 18.
The learning opportunities in this unit can be differentiated by providing or removing support to students and by varying the task requirements. Ways to differentiate include:
The contexts for this unit include Maia Moa, working for money, ropes for gymnastics, swimming, stacking supermarket trolleys, and video games. Those contexts will appeal to most students. Use other contexts relevant to your students, in which there is a constant difference between consecutive terms (linear relationships). For example, the coach takes his car that holds three extra players. All the other players must travel on vans, seven players to a van.
Te reo Maori vocabulary terms such as wharite rarangi (linear equation), kauwhata (graph) and tau whakarea (multiplier) could be introduced in this unit and used throughout other mathematical learning.
Prior Experience
It is anticipated that students at Level 4 understand, and are proficient with, multiplicative thinking. However, the tasks in this unit are also accessible for students whose preference is additive thinking. In fact, the experiences may prompt a move towards multiplicative thinking.
Session One: Maia the Moa
In this session students are shown a spatial growth pattern for a moa made from square tiles. As Maia the moa ages she grows in her legs, body and neck while her feet and head remain constant. Session One is driven using PowerPoint 1. The approach is to structure one example of the pattern then transfer that structure to other members of the pattern.
Students might notice different features such as colour, height, width, age, total number of squares, etc.
For example, from Casey’s method these two expressions emerge:
4 + 2 x 3 + 2 (Age two) 6 + 2 x 5 + 2 (Age four)
The ‘+ 2’ is constant and ‘2 x’ is present in both expressions. The other numbers vary.
Are their strategies based on induction? That is sequential processing. For example, 4 , ? , 6, so ? = 5, and 2 x 3, 2 x ?, 2 x 5, so ? = 4.
Imagine that Maia celebrates her twentieth birthday.
How many squares will she be made of?
Find a way to predict the number of squares that Maia is made of for any age in years?
Session Two
This session builds on the Maia the moa, pattern to represent the relation between age and number of squares using a table, a graph and an equation. Features of these representations are connected through looking at the effect of changing the original spatial pattern with focussed variation.
Some may notice missing values in the Age column, particularly the ages 0, and 1. Others may notice that the number of squares are all multiples of three. They may express this idea inductively, “The number of squares goes up by three.”
How can we continue the table to get more values?
Why are the points in a line? (This tell us that the relation is linear)
How steep is the line?
Note (0, 6) represents Maia’s situation upon hatching.
Where does it cross the s axis?
Why does it cross there?
Session Three
What does A# represent? (Maia’s age in years, a). So instead of A# we could write = (a + 2) x 3 or = 3(a + 2).
What does this expression tell us? (The number of squares Maia is made up of). So we could write s = 3(a + 2).
Do the students observe that a is free to take up different values? a is a variable. The twos remain equal in length as the value of a changes. So, +2 is a constant.
Pose this problem to the students.
This situation constrains "s" to 144. Therefore, a linear equation is created. This might be expressed as 3(a + 2) = 144 or in other forms, dependent on the structure of the rule. For example, Katia’s method would yield 3a + 6 = 144. Students may need access to a picture of Maia’s growth pattern, e.g. Slide 3 of PowerPoint One.
For example, inductive methods might involve creating a table of values and extending it until the matching value of a is found. Spreadsheets make inductive methods easy to implement. A sign of reliance on additive methods would be repeated adding of three to find next values of s.
Deductive methods involve applying inverse operations to rules. For example, “I divided 144 by three to get 48, so the age plus two must equal 48.”
Session Four
In this session students investigate linear equations where the variable is present on both sides.
Do students recognise that both rules can be rearranged to give 3a + 6 which is Katia’s rule?
(Leah’s rule) 3 (a + 1) + 3 = 3a + 3 + 3
= 3a + 6 (Katia’s rule)
Maia the moa is made of 222 squares. How old is Maia?
Do students apply inverse operations to both sides of the equation, 3a + 6 = 222, to find the solution?
Ken and Katia are looking at the same picture of Maia.
Katia says that the number of squares equals three times Maia’s age plus six.
Ken says that the number of squares equals four times Maia’s age minus 18.
They are both correct. How old is Maia?
An equation based solution looks like:
3a + 6 = 4a – 18
3a + 24 = 4a (adding 18)
24 = a (subtracting 3a)
Note that there are many possible first moves.
Session Five
This session is intended as an opportunity for students to practice applying their understanding of linear relations and their techniques for solving linear equations.
Provide the students with copies of Copymaster 2 and encourage them to solve the problems in co-operative (mahi tahi) groups.
Dear parents and caregivers,
This week we are learning about linear relationships. Real life is full of situations where things grow at a constant rate, such as the money we earn for the hours we work, or the total cost related to the quantity we buy.
In the unit we will learn to represent linear relationships using tables of values, graphs and equations. We will use spreadsheets to solve problems with linear relations, and use a learning object to solve linear equations.
Addition, subtraction and equivalent fractions
The purpose of this series of lessons is to develop understanding of equivalent fractions and the operations of addition and subtraction with fractions.
In this unit students learn to find equivalent fractions and apply equivalence when adding and subtracting fractions with different denominators. A fundamental idea about addition and subtraction is that the units that are combined, separated, or compared are of the same size. In a simple addition problem such as 6 + 7 = 13 it is assumed that 6, 7, and 13 refer to the same units, such as apples, or centimetres.
Addition and subtraction of fractions involves greater complexity than with whole numbers.
For example, 3/4 + 2/5 = ? involves two fractions composed of different units. Three quarters refer to three units that are one quarter in size, while two fifths refer to two units that are one fifth in size. Since quarters and fifths are different sized units they cannot be added. Key to this, is understanding that the denominator in a fraction describes the size of units the fraction is made up of.
Renaming the fractions in units of the same size involves creating a common or "like" denominator. A common denominator can be any common multiple of the denominators of the fractions being added or subtracted. For example, to solve 4/5 – 2/3 = ? the common denominator of 3 and 5 could be 15, 30, 45, etc. For simplicity, the least common multiple, 15, is commonly used. Partitioning fifths into three equal parts creates fifteenths, so 4/5 can be rewritten as 12/15. Partitioning thirds into five equal parts creates fifteenths, so 2/3 can be rewritten as 10/15. Note that renaming a fraction in equivalent form is like multiplying by one, in fraction form. 4/5 x 3/3 = 12/15 and 2/3 x 5/5 = 10/15. 3/3 and 5/5 are names for one.
Once 4/5 and 2/3 are renamed as equivalent fractions with the same denominator the units are of equal size and can be separated or compared. So, 4/5 – 2/3 can be rewritten as 12/15 – 10/15 = 2/15. Therefore the problem becomes 12/15 – 10/15 and gives the answer 2/15.
The learning opportunities in this unit can be differentiated by providing or removing support to students, by varying the task requirements. Ways to support students include:
Tasks can be varied in many ways including:
The contexts for this unit can be adapted to suit the interests and cultural backgrounds of your students. Fractions arise from equal sharing and measuring. Fair shares are a common feature of many cultures, particularly Pasifika communities where effort and reward are communally owned. Sharing food is a cultural universal. With your class, you might come up with a list of contexts in which your students share food (e.g. marae visits, birthday parties, picnics, Christmas). Use these contexts to enhance how the maths learning in the following sessions reflects the cultural diversity of your students. For example, in Polynesian cultures, shares given to families from collective food and materials gathering or hunting, are often based on the number of family members, so the fractions are often unequal.
Measurement contexts are ubiquitous in modern life, due to the use of metric measures. Length, area, mass, volume and capacity occur in everyday settings from allocating water, to creating items from fabric, to calculating loads. Historical measures, such as arm spans, head circumferences, and foot lengths, also provide contexts for use of fractions, arising from the need for accuracy.
Te reo Māori vocabulary terms such as haurua (half), hautoru (third), hauwhā (quarter), hautau ōrite (equivalent fraction) and hautau (fraction) could be introduced in this unit and used throughout other mathematical learning. In te reo Māori, the prefix ‘hau’ refers to how many parts a whole has been divided into. Therefore, number terms such as rima (five) can be added to the ‘hau’ prefix to make ‘haurima’ (fifth). The te reo Māori term for a whole number is tauoti. To talk about non-unit fractions (for example, 2/3), we use the same number-words as we would for counting in te reo Māori. Therefore, two-thirds can be called rua hautoru.
Session 1
SLOs:
For example: “one quarter, two quarters, three quarters, one, one and one quarter, one and two quarters, one and three quarters, two, two and one quarter…”
Use a set of fractions strips (Copymaster 1) to build up a number line model as you count.
Why is 4/4 called one?
Why is 6/4 called 1 ½?
Write on the class/group chart in words and symbols:
Four quarters is the same as one: 4/4 = 1,
Eight quarters is the same as two: 8/4 = 2, etc.
Highlight the equals sign. Ask students to discuss the meaning of = (is the same as, the amount on one side is equivalent in value to the amount on the other side).
Record their ideas.
Equals means the same quantity. So, 8/4 and 2 are two ways to record the same number. At this stage, you could draw on students’ understandings of algebraic equations, if they are familiar with equations such as 2a = 4, so a=2. The equals sign can also be linked to familiar measurement contexts (e.g. weighing items on scales to see if they are equal).
Ask students to work in pairs to reach a solution. Provide Copymaster 2: Pizza Pieces for students to use if needed. Share the strategies as a class and summarise those strategies on the class chart. Encourage students to think flexibly. Prompt thinking with questions like the following:
Are any pairs of fractions easy to add? (e.g. 1 1/8 + 7/8). Why?
How many eighths of a pizza, altogether, are left over?
Can you think of any ways to combine the 1/2 of Hawaiian pizza and 1/4 meat lovers pizza? Would this make it easier or more difficult to count?
Students might divide the total of 6 ½ pizzas and convert that amount into 52/8. Alternatively, they might change each fraction into eighths and total the number of eighths.
Make your own fraction number line, starting at zero and finishing at eight, where the right-hand edge is. Tape both strips together to get a good length.
What number will go on the join?
Where will you locate 1? 7? 4 ½, 6 3/4?
Please show all the halves, quarters, and eighths from 0 to 8.
Watch that students locate all numbers, including fractions, on the marks and not in the spaces.
Have students begin at zero and add 1 1/8 (the vegetarian pizza left over) on the number line. They might use a peg to mark the total amount of pizza each time, as each fraction is added.
How can we figure out where a jump of ¾ more will land? This jump can represent us, adding on the leftover meat lovers pizza?
Three quarters (i.e. 6/8) more than 1 1/8 equals 1 7/8. Then, 1 whole pizza can be added to get 2 7/8 pizza. One might be added first then 7/8 and the answer is the same.
Use your number line to add the fractions of leftovers. Check to see that our original answer is correct.
Roam the room to see that students add the fractions correctly, renaming ones, halves, quarter, and eighths as needed, and recognising when another one (whole) is created.
For some students, it may be appropriate to present these questions orally. However, other students may benefit from questions written on mini whiteboards or sticky notes.
Ask your students to solve the problem by imaging the number line. Ask students to share their results with a partner. Model solving the question - making explicit links to fraction materials to show the relationship between halves, quarters, and wholes. Ensure the recorded fractions are visible for students to see.
Repeat with other examples involving halves, quarters, and eighths. Use pizza pieces to confirm the sums if necessary.
Make a new number line starting at zero and finishing at eight. Join the strips like last time.
This time your number line must show halves, thirds, and sixths.
How will you divide each length of one into thirds?
How will you divide thirds into sixths?
Do they locate the whole numbers correctly?
Is the one third unit made by dividing one into three equal lengths?
Are students aware that one half of one third equals one sixth?
You might align the first and second number lines.
Using our number lines, how many names for 1 ½ can we find?
1 2/4, 6/4, 1 4/8, 12/8, 1 3/6, 9/6.
What would happen if we added 3/4 and 5/6? What would the answer be?
Students should recognise that the answer, 19/12, cannot be expressed as an exact number of quarters or sixths. You might use a fraction strips to show that twelfths are needed to express the answer.
Session Two
SLOs:
For example: John says he needs 3 1/4 of the playing field to set up for a game of Kī-o-Rahi. He sections off the playing field. What portion of the playing field remains?
Let students calculate an answer then check their responses with fractions strips (Copymaster 1). The physical action is removal. Taking away 1 1/4 is straight forward. This leaves a remaining 2/4 to be taken away, leaving a total of 1 2/4 or 1 1/2 of the playing field remaining.
Review strategies from Session 1. Just like with addition, units of the same denominator are needed for subtraction of fractions.
For example: Ihaia is carving a new whakairo for the marae. He has a 4 3/4 metres length of wood. He cuts off 2 1/3 metres. What length of wood is left?
Ask students to work in pairs to attempt the problem. Encourage access to their previous number lines and fraction strips.
How might you find the length that remains? (Either add on to 2 1/3 until you reach 4 ¾ or remove 2 1/3 from 4 ¾).
Estimate the length that remains. (2 metres and a fraction of a metre)
What fraction is ¾ with 1/3 taken away? What sized pieces might fit? (Twelfths)
Record the problem using an empty number line to capture the removal of parts.
What is the problem with 3/4 - 1/3? (Different denominators means different sized pieces)
Could we rename both 3/4 and 1/3 using a different denominator? Which denominator?
Students may have already discovered that twelfths fit the gap between 2 and the answer on the number line.
How many twelfths equal 3/4? How many twelfths equal 1/3? (Align fraction strip pieces if needed to check that 3/4 = 9/12 and 1/3 = 4/12)
4 3/4 - 1 1/3 = 4 9/12 – 2 4/12
= 2 5/12 (subtracting ones first then twelfths)
Why did we need a common denominator of twelve to solve this problem? (Addition and subtraction are only possible if the units are the same.)
It is vital that students recognise that equivalent means of equal value, that is, different expressions of the same quantity. ½ and 5/10 are equivalent because they represent the same amount and occupy the same location on the number line between zero and one.
Refer to the class/group chart recording from Session 1:
4/4 = 1, 8/4 = 2, 12/4 = 3, 16/4 = 4, and the highlighted = sign.
Do students agree that equals means “is the same as” or “that the amount on one side is equal in value to the amount on the other side”?
Use lengthwise folding to illustrate how equivalent fractions can be found.
Here is the example of 2/3 = 4/6 = 8/12 = …
What comes next in the equation? How do you know? (= 16/24 = 32/48 …)
What patterns do you notice in the numbers?
Students should notice that both the numerator and denominator are doubling.
Why did that happen? (With each half fold the number of pieces that make one (denominator) doubled so the number of shaded pieces doubled)
Start with 3/4 and repeatedly halve to get 3/4 = 6/8 = 12/16
Start with 1/2 and repeatedly third to get 1/2 = 3/6 = 9/18
Find as many equivalent fractions as you can using these materials. Record the fractions using equations and diagrams. Create a poster of your work explaining how equivalent fractions work.
Give students plenty of time to explore. Roam the room looking for:
Are students confident with the meaning of numerator as a count, and denominator as the size of pieces counted?
Do students anticipate the relationships among different sized pieces?
Do students anticipate the effect of halving and thirding pieces of a parent fraction?
Do students record equivalence appropriately using equations?
For example:
Session Three
SLOs:
Here are some equivalent fractions that I found:
2/3 = 4/6 = 8/12
I want to mark each fraction on a number line.
How will I find the place to mark two thirds? (Two copies of one third from zero)
How will I find the place to mark four sixths? (Four copies of one sixth from zero)
How will I find the place to mark eight twelfths? (Eight copies of one twelfth from zero)
What other fractions will be equivalent to two thirds?
Look for vertical alignment to check for correct placement of fractions and equivalence.
Provide each student with three blank A4 pieces of paper and ask them to fold the pieces in these ways.
You will need to think about how the paper was folded.
Remember to label each piece with the correct fraction.
Use your paper pieces to show a partner that:
How many sixths are equivalent to three quarters? (3/4 = 9/12 and 1/6 = 2/12. There are 4 ½ sixths in three quarters)
How many eighths are equivalent to one third? (1/3 = 8/24 and 1/8 = 3/24. There are 2 2/3 eighths in one third)
Equivalent fractions:
Ask the students what they notice happening to the numerator (it is doubling each time) and what is happening to the denominator (it is doubling each time).
Ask students how this could be shown. Accept their suggestions, reaching an understanding that it could be shown in this way.
Purpose: to recognise the multiplicative relationship between equivalent fractions)
This game is for two or three players and the rules are included with the Copymaster.
Session Four
SLOs:
Refer to this expression and have the students suggest how the pattern of equivalent fractions continues.
How long can this pattern of making fractions that are equivalent to one half continue?
How do you know? (note that some fractions equal 1/2 but do not arise in the doubled list)
50/100 64/128 36/72 256/512 22/44
The common property of all fractions equivalent to 1/2 is that the denominator is twice the numerator.
Is there a simpler way to write this fraction?
Let students investigate the question in pairs and record their ideas.
Ideas might be:
If we look at the numerators and denominators of the fractions can we know the simplest fraction without using strips?
Record the equality as:
9/12 = 3/4
We know that we can change three quarters into nine twelfths through multiplying by one. We use 3/3 as a name for one.
What would undo multiplying both the numerator and denominator by three?
Students might recognise that 9 ÷ 3 = 3 and 12 ÷ 3 = 4 which gives the numerator and denominator of 3/4.
Provide some other examples of simplifying fractions by identifying a common factor. Use fraction strips to model each problem if needed. Note that students will need to consider twentieths as half of tenths, and twenty fourths as halves of twelfths.
More knowledgeable students may benefit from being extended through the use of word questions. The questions you pose to your students can be enhanced through connections with students’ cultural backgrounds. For example if your learning has involved looking at images of carvings from the local marae, the questions could be posed as “the whakairo (carving) at our local marae is being restored. The artists use grids to divide up the work, but they cannot agree on how much they should work on each. Hone says it is simplest to divide the carving into twelfths, and that he will complete 8/12 of the work. Can you think of a simpler way to write the fraction that Hone has come up with?
In a school context, problems could also be posed around the use of the school playing field (e.g. for Friday afternoon sport).
For example:
8/12 (2/3) 6/10 (3/5) 15/20 (3/4) 9/24 (3/8)
Purpose: To simplify fractions and to identify which fractions can be simplified.
Student pairs share a deck of shuffled playing cards with picture cards and the jokers removed. They each need a pencil and a sheet of paper.
Players take turns to turn over two cards. The first card is the numerator and the second is the denominator. The player records their fraction. Beside the fraction they write a simpler equivalent fraction if they can, showing what they divided both numerator and denominator by. If their partner agrees they tick their recording.
Fractions for which they can find no simpler fraction are recorded and nothing further is added.
For example:
If a player draws a 6 and then an 8, they write 6/8 = ¾, justifies the division factor, and once their partner agrees they can add a tick ✔.
If a player draws a 7 and then a 9, they write 7/9 but no tick is given.
If the fraction is an improper fraction that is changed to a mixed numeral without simplification, no tick is given as this is not simplifying the fraction. For example: 7/2 = 3 ½ earn no tick bit 9/3 = 3/1 does earn a tick.
Students play and record 10 rounds (at least). They should then look closely at the fractions they were able to simplify (✔) and the ones they were not.
They must discuss, agree, and write the ‘Secret to simplifying fractions is…’
For example:
Session Five
SLOs:
When would it be useful to know about equivalent fractions?
Record the students' suggestions and ask them to provide examples. They may offer problems like these:
How much time, in total, has Aria spent creating her kete?
(3/4 + 2/3 = 9/12 + 8/12 = 17/12 = 1 5/12)
How much fabric does Tina have left?
(1 4/5 - 3/4 = 9/5 - 3/4 = 1 16/20 – 15/20 = 1 1/20)
Why is finding a common denominator necessary to solve both problems?
Which common denominators did you use? Why did you choose those numbers?
When did you use equivalent fractions to solve the problems?
What is the best way to find a common denominator?
Let’s use 2/3 + 4/5 as an example.
From previous work students might know that thirds and fifths can be equally partitioned into fifteenths.
How many equal parts is each third broken into, so that fifteenths are formed? (five)
You may need to demonstrate the partitioning with fraction strips. Students need to see that the size of the parts comes from considering how many of those parts make one (whole).
How many fifteenths are equivalent to two thirds? (write 2/3 = 10/15)
We look for the least common multiple of 3 and 5 (LCM) so both fractions can be named with the same denominator.
Shade the multiples of three in one colour; 3, 6, 9, …
Shade the multiples of five in another colour; 5, 10, 15,…
Continue until all the multiples have been found.
How do we know which numbers are common multiples of 3 and 5? (double colour)
What is the least common multiple of 3 and 5? (15)
Let students work on these tasks using Copymaster 4 as support.
Why are the common multiples of 2 and 5 in the right-hand column?
Why is 12 the LCM of 4 and 6, when 4 x 6 = 24?
Why do 7 and 13 have only one common multiple less than 100?
Note that any common multiple will work but LCM is the simplest to use.
Record the thinking using a table like this:
3/4 + 2/3 =
1 4/5 - 3/4
Do your students look for pattern in the occurrence of multiples?
For example, the common multiples of 3 and 8 occur in every eighth cell in the 3 column and row, and every third cell in the 8 column and row.
Can they identify the LCM in each problem?
Purpose: To apply knowledge of equivalent fractions to solving problems.
This is a game for two players. Story cards and fraction cards are shuffled and placed face down in two piles. Each player takes two story cards and 6 fraction cards and places them face up in front of them.
Players take turns to:
The winner is the player that makes the most pairs.
Note: There will be 7 fraction cards left over because some are ‘trick’ cards.
Extra work:
Students could work on some of the Fractions e-ako to consolidate learning of concepts developed in these lessons. These e-ako are at the right hand end of the level 3 shelf on the Additive thinking and Multiplicative thinking pathways.
Students work independently to complete MM8-9 - part 2, explanation of which fraction is larger. Ask them to pair, share, and discuss.
Students watch the following videos to see how a unifix cubes model can be used to add and subtract fractions:
Dear parents and whānau,
In mathematics we have been exploring equivalent fractions. We have learned to play a game called Fraction Fish in which we find equivalent fractions. Your child has brought home a plastic bag containing the playing cards and instructions. They will explain how this is played.
Enjoy the challenge.