This is a level 4 number, algebra, and statistics activity from the Figure It Out series. It relates to Stage 7 of the Number Framework.
A PDF of the student activity is included.
Click on the image to enlarge it. Click again to close. Download PDF (2385 KB)
identify which graph best represents the data
use multiplicative strategies to calculate costs
Number Framework Links
Students need to be strong multiplicative thinkers to solve the problems in this activity. They need to be working at stage 7 at least, although some of the questions involve proportional reasoning at stage 8. For example, calculating tax payments involves using a percentage (decimal fraction) as an operator.
Calculator
Activity One
Financial language
Profit margins
Financial understanding
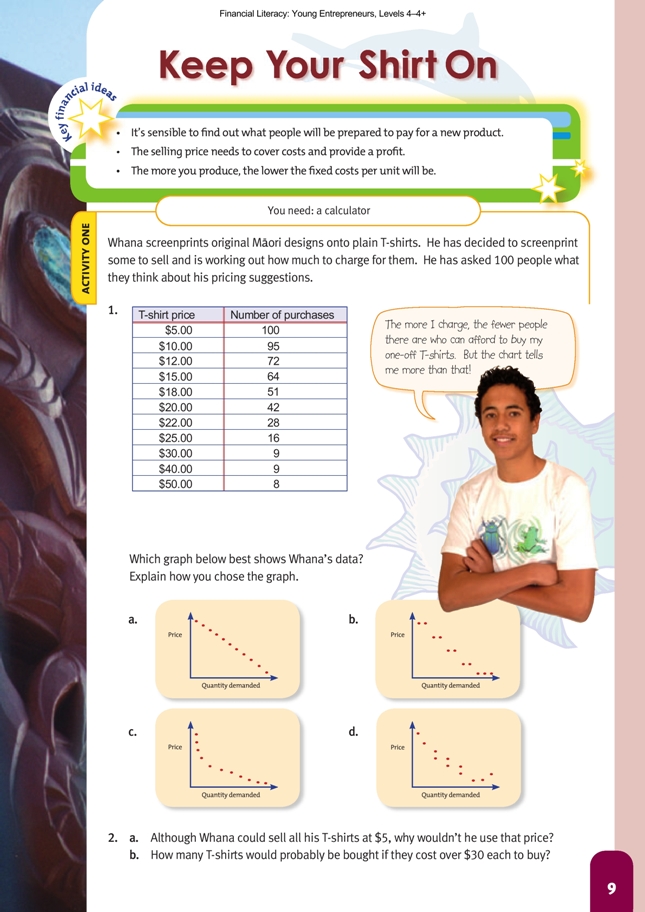
In this activity, students follow Whana’s thinking in pricing his T-shirts. Whana knows he has a good product, so he’s keen to find out what people are prepared to pay for it. He anticipates that this price will cover his costs and provide him with a profit. He also does his maths and can see that if he can sell more, his fixed costs per unit will fall, allowing him to have higher profit margins.
Whana is still at the planning and organising stage of his business. By analysing these figures and setting the best price for his market, he is identifying, managing, and assessing risks.
Students who have taken part in enterprising activities soon learn about the theory of supply and demand: once students take their products to market, they can see whether the quantity they supplied was too small for the price ticket they put on the goods. If they have a long queue and the product is snapped up, then they will conclude the price was too low. Equally, if the students have products for sale and the goods sit unsold, they very quickly drop the price to clear their stock of goods! Students understand supply and demand at a practical level, but communicating the principles of supply and demand often trips them up. One of the issues is the time frame. For their own market day, there is a fixed quantity on sale, and therefore demand determines the market price on the day. However, if they have time to produce more, the quantity to be supplied is a variable, influencing the potential market price. Deciding what quantity to take to market is a very difficult decision for students to make; if the quantity is too small, they have lost the opportunity of earning higher sales revenue, and hence a higher profit, and if the quantity is too large,
they may even make a loss! Pricing is one of the hardest decisions to make because it involves some “guesstimates” about what people will buy at what prices.
Activity One looks at the relationship between the price ticket on the item and the quantity demanded for that item. Introduce this by choosing a semi-valuable item (for example, a music CD or a set of felt pens) and offering to sell it to the students at a certain price. Collecting, organising, and analysing information, including setting the price, is an important part of business planning.
Say: I am offering this (item) to you for 10 cents. Put your hand up if you’d be willing to buy it at that price. (Some students will want to buy 10 at that price!)
Begin a table that shows the quantities that students would like to buy of the item at each price point. Tell the students that they are all potential buyers (purchasers).
Keep offering the item at increasing price points, for example, 50 cents, $1.00, $5.00, $20.00, $50.00). Record each of the “total quantity demanded” by willing buyers as the price increases. Graph the pattern on a scatterplot. Ask: What does this graph show?
As the advertised price increases, the number of willing buyers goes down, as does the quantity they indicate they want to purchase. (Note: The word quantity is critical, so encourage the students to use it, for example, quantity supplied, quantity demanded). Ask Why do people want to buy 30 of the item at 10 cents, but only one person wants to buy the item at $100?
At 10 cents, it’s a good “buy”, that is, it costs much less than you would pay elsewhere. At $100, it’s a bad “buy” because it can be bought much cheaper elsewhere.
Get the students to read through and attempt Activity One, which looks at a similar demand curve to ascertain the potential demand for Whana’s T-shirts. Market research is a part of the financial planning undertaken when setting up a business. It’s pointless for a business to produce goods or services that cannot be sold at a price that adds to the business’s profit. Note: The expected total revenue can be
calculated by multiplying the quantity demanded by the price.
Another interesting way of presenting this data is by considering how the gross
revenue depends on the price, not just the quantity demanded.
Graphing this data and identifying any local maximum will clearly show at what price Whana needs to set his T-shirts to maximise his revenue:
Question 2 encourages students to consider the fact that businesses must balance the supply of their product with the demand for it. Whana aims to sell at a price that equates his quantity supplied with the quantity demanded and at a price that covers the cost of producing his T-shirts plus a fair profit. There’s no point in Whana selling 100 T-shirts at $5.00 each if it costs more than $500 to make those T-shirts.
His research indicates that 8 or 9 percent of people would buy his T-shirts at $30.00 each. Acting in a financially responsible way for a business involves selling enough of their product at a price that makes a reasonable profit so that the business is able to continue.
Mathematics and statistics
To interpret the graphs in question 1, the students need to identify the rate of change between price and quantity. That is, how much extra quantity of product could be sold if the price was reduced by $1.00.
Note that the students can also calculate the expected change in revenue by changing the price by $1.00 because revenue is calculated by multiplying price by quantity. Sometimes this decision to reduce price increases total revenue; at other times, it reduces total revenue – it depends how potential customers react to your price change! This rate of change between, in this case, price and quantity, is a critical concept in developing pre-calculus thinking.
The students should accept or reject the graphs by looking for connections between the pattern of points and the table of the quantity of purchases. For example, graph a shows a linear pattern of points. The slope of a line passing through the points is constant, so the difference between the number of purchases for each unit increase in price should be constant.
Students may also work from the table to the possible graph. The last few price points in the table show very similar numbers of purchases. This would show in a scatterplot as zero slope, that is, a horizontal arrangement of points. Graphs b and c reflect this pattern of points. Graph b shows a relation that makes a pattern of steps. This would represent a table in which there are several places where an increase in
price has no effect on the number of buyers. This is not the case in Whana’s table, so graph c is the most likely. The students could check this by entering Whana’s table into a spreadsheet and using the graphing tool to create a scatterplot.
If the students have difficulty with this graphing question, they could use spreadsheets to develop the connections between number patterns in tables and the slope of points on a graph. Get the students to create scatterplots for the following tables and connect the patterns in numbers with the slope of the lines connecting the points. Tell them which values go on the vertical scale and which values go on the horizontal scale.
Social Sciences Links
Achievement objectives:
• Understand that people make decisions about access to and use of resources (Social Studies, level 3)
• Understand how exploration and innovation create opportunities and challenges for people, places, and environments (Social Studies, level 4)
Have the students discuss how price impacts on a buyer’s access to resources (in this case, Whana’s T-shirts). Ask: Does price influence your buying decisions? Is it always a good idea to see price as a guide to the quality and desirability of a product?
Activity Two
Financial understanding
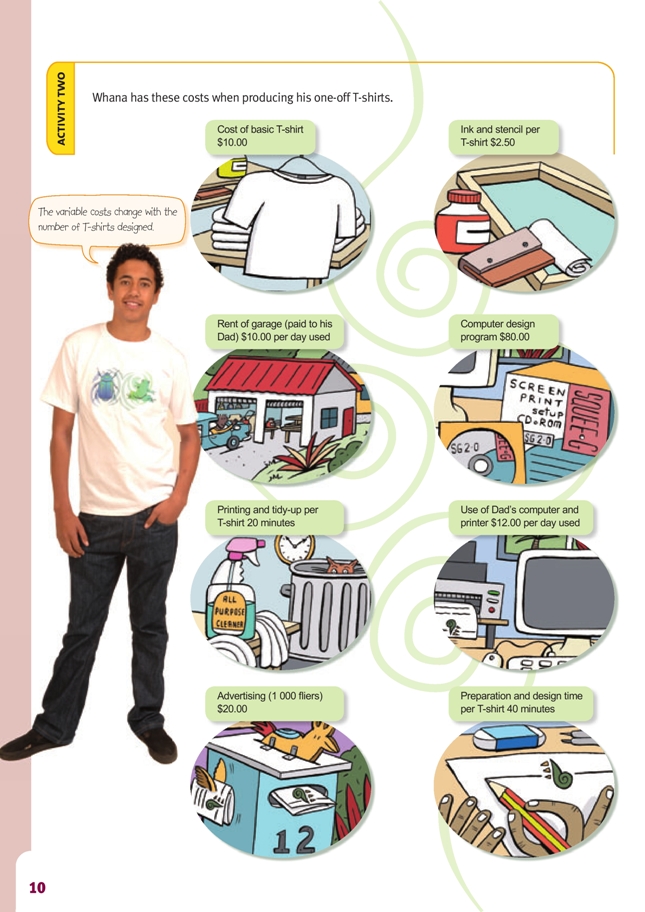
In this activity, students consider what are the one-off costs to get the business up and running and what are ongoing costs. They then consider what are fixed costs for any day and variable costs for that day.
Classifying costs into fixed and variable is another important way for a businessperson to collect, organise, and analyse information. This helps with pricing decisions.
Mathematics and statistics
To help the students consider the difference between fixed and variable costs, you could set up the scenario that you are going to sell bubbles. You will need a bowl, a bubble wand, water, and detergent (bubble liquid). Act out creating bubbles and selling them to class members. Ask:
What is likely to happen if I want to sell 1 000 bubbles today? The bowl will need to be refilled several times and filled with water and bubble liquid.
What does it cost me to make each bubble? The cost of the water, the bubble mixture, the bowl, the wand, and your time.
Suppose I made only 500 bubbles. Would my costs be the same? No, you would use less water, bubble liquid, and time, but the cost of the bowl and wand would be the same.
Now suppose the cost of water, bubble liquid, and my time is 10 cents for each bubble. What is the cost of the bowl and the wand for each bubble? That depends on how many bubbles you make. That cost has to be spread out over what you charge for all of the bubbles.
Is it cheaper to make 1 000 bubbles than 500 bubbles? No, it costs more because you use more water, bubble liquid, and time.
Is the cost per bubble the same? Why? No, the cost per bubble decreases as more bubbles are made because the cost of the bowl and wand is “spread out” over all the bubbles.
In financial terms, some of my bubble-making costs are fixed and some are variable. Variable means they change with the volume of production. Which of my costs do you think are fixed and which are variable?
The cost of the bowl and the wand is fixed. The costs of the water, the bubble liquid, and time are variable. Now that they have this background, let the students attempt Activity Two.
The calculation of production costs for Whana’s T-shirts is complex. Question 3b seeks to simplify this calculation by excluding the fixed cost. The extra cost of producing the “next” item is referred to as the marginal cost. Students should recognise that the variable costs per T-shirt involved here are the cost of the T-shirt ($10.00) and ink and stencil ($2.50).
All other costs are fixed for a day because Whana has to pay them no matter how many T-shirts he makes on that day. Whana will have to decide which is the best quantity to produce on any one day, given the information provided.
Social Sciences Links
Achievement objective:
• Understand how people make decisions about access to and use of resources (Social Studies, level 3)
Have the students discuss why Whana’s dad is charging for the use of the garage and computer. Is this fair? Will this influence Whana’s use of these resources?
Activity Three
Financial language
Advertising, marketing
Financial understanding
In this activity, students learn about advertising and setting selling prices. Advertising is one of the marketing decisions a business makes. The other marketing decisions they make are how they will package their goods, price their goods, and the place they will sell their goods at or through.
Marketing involves a lot of planning and organising. If planning and organising the campaign is done well, it will influence people to buy the product. For marketing to be successful, the business person needs to generate and use creative ideas and processes in creating the campaign. They also need to communicate these and be open to ideas and information from other sources.
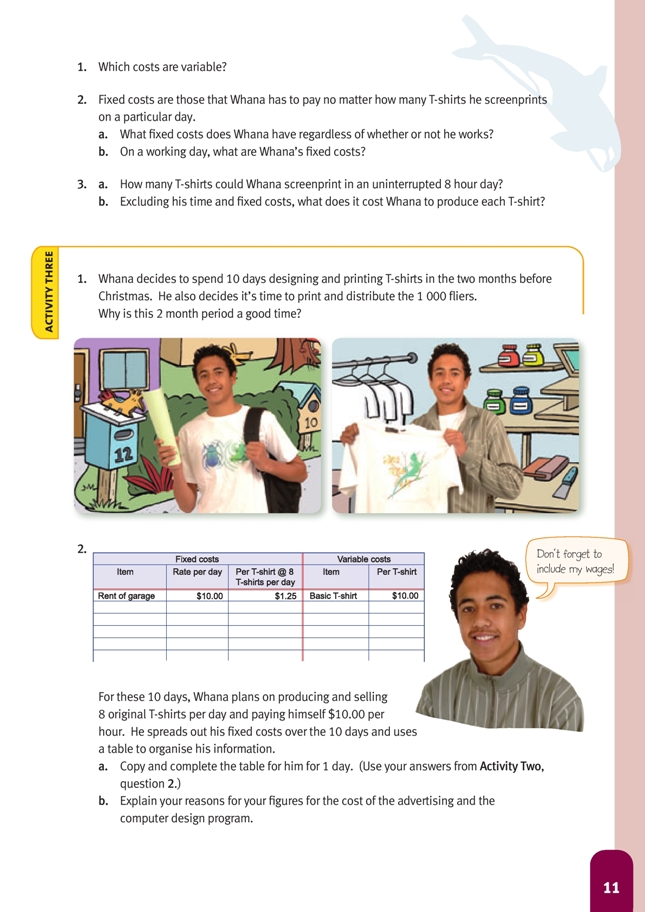
Businesses advertise for two main reasons: to make potential customers aware that they exist to sell a product or products and to create demand for these. Whana’s timing of his production before Christmas shows that he is using the opportunity of increased demand for gifts to market his T-shirts.
The students also need to consider whether Whana’s time is a fixed or variable cost. Because he pays himself as a casual worker based on the number of hours he works, his wages are a variable cost. For businesses that employ people on wages or salaries for fixed times, these costs are fixed because they must be paid no matter how much is produced or sold.
As noted in the students’ book for question 4 a–b, income tax on Whana’s profit has not been included in this exercise for the sake of simplicity. However, you might want to explain to the students that businesses usually allow for that extra tax when setting the prices that will bring them the profit they want to earn. With regard to the goods and services tax (GST), most businesses in New Zealand display prices that have
the GST included. However, this is not always the case, and the students should be aware that GST is sometimes added on to the price, particularly in the sale of land and land agents’ fees. A business that is GST registered can claim back from the Inland Revenue any GST they pay on goods and services used to make their product. So most firms budget in net (before tax) amounts.
Mathematics and statistics
Assuming that Whana consistently produces 8 T-shirts per day allows the fixed costs to be spread out across all 8 T-shirts. The term “rate” refers to a multiplicative relationship between two measures, in this case cost (in dollars) and product (T-shirts). In calculating the cost per T-shirt, the students are working out the unit rate, that is, the cost for each T-shirt. The most difficult of these calculations are those involving time because three measures are involved: time, wages, and T-shirts. For example, printing and tidying up takes Whana 20 minutes per T-shirt, and 20 minutes is one-third of an hour. Whana pays himself $10.00 per hour, so the cost of printing and tidying up per T-shirt is one-third of $10.00, which is $3.33.
Question 2b also involves spreading out the cost of the advertising and computer program over all 10 days and 80 T-shirts.
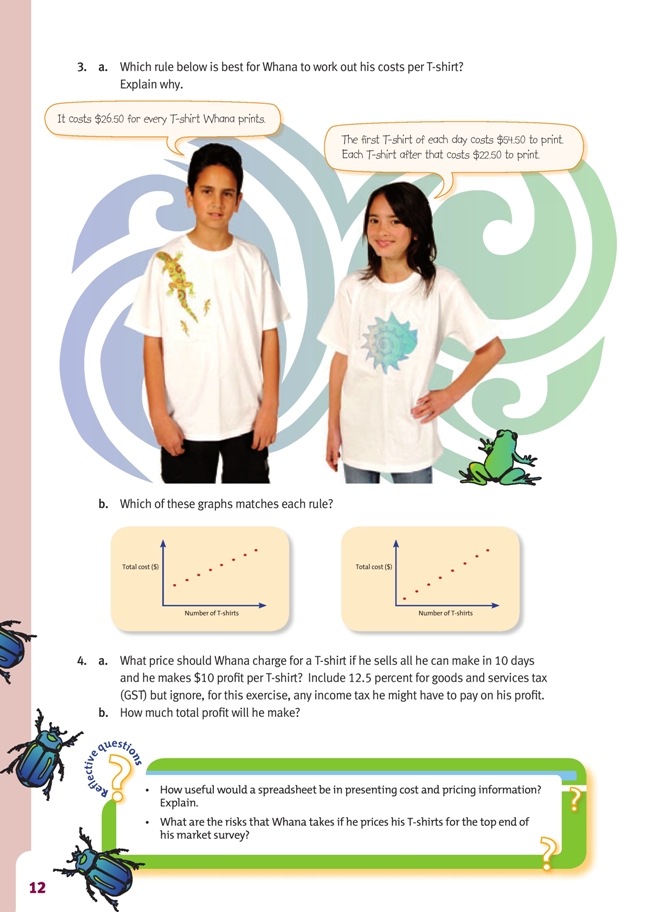
Question 3 involves the students comparing two linear relations. Each of the two rules can generate a set of ordered pairs.
Ordered pairs for the left-hand rule (the graph on the right-hand side of the page) are (1, 26.50), (2, 53.00), (3, 79.50), … where the first number is the number of T-shirts and the second number is the total cost in dollars. Students might compare the graph of these relations using a spreadsheet. Firstly, expect them to anticipate which graph goes with each rule. Important features of the graph are the cost of one T-shirt
(higher for the right-hand rule than the left) and the slope of the line through the points (steeper for the left-hand rule than the right).
(Alternative formulas, which show more clearly the fixed versus variable costs, are, for B2, =A2*26.50 and for C2, A2*22.50+32. The $22.50 is the variable [per T-shirt] and the $32 is the fixed cost.)
An important generalisation from the graph is that the difference between the second numbers in consecutive ordered pairs gives the slope of the line through the points, for example, for the right-hand rule: (1,54.50), (2, 77.00), … 77.00 – 54.50 = 22.50 (the slope of the graph).
Question 4 requires the students to add GST to the total of $26.50 plus $10.00 profit. Drawing diagrams may help some students to visualise the problem, for example,
Ask the students what simple fraction is equivalent to 12.5 percent, which means twelve and one-half per hundred. Since 8 x 12 1/2 = 100, 12.5 percent is equivalent to one-eighth. In this case, the GST is one eighth of $36.50, which is about $4.56. For the students to answer question 4b, you may need to remind them that profit is the extra money left over after a business has paid all its costs. Financially responsible
businesses plan to make a profit because without profit they can go out of business, frequently owing other people money in bad debts.
Reflective question
The first reflective question focuses on the power of spreadsheets for calculating costs and prices. Spreadsheets are a modern electronic form of the paper ledgers kept by bookkeepers before computers. The great advantage of spreadsheets over paper ledgers is that they calculate amounts automatically and allow for if–then predictions. If–then predictions are situations where something is changed and the effect is looked at. For instance, consider the effect if Whana charges $12.00 per hour for his work rather than $10.00. A new paper ledger would be needed each time something is changed. With a spreadsheet, all entries can be altered and returned to their former “default” (status quo) easily. Spreadsheets are also very useful because you can quickly and easily draw “pictures” (graphs) of your
data. Many people find it easier to see patterns from pictures than from lists of numbers in a table.
Social Sciences Links
Achievement objective:
• Understand how producers and consumers exercise their rights and meet their responsibilities (Social Studies, level 4)
Have the students discuss what rights Whana will have to consider for his customers when he is marketing his T-shirts, for example, the quality of the product, including accurate graphics and text.
Answers to Activitiies
Activity One (page 9)
1. Graph c. Explanations will vary. You could eliminate graph d immediately because the last dot goes up and that doesn’t fit the chart information. The numbers in the chart don’t go down evenly as in graph a or in matching pairs as in graph b. Graph c
does fit the data pattern.
2. a. Answers may vary. $5 may not cover his costs, and it certainly gives too low a return for one-off T-shirts. Also, only 5 people indicated they wouldn’t pay $10, which is double $5.
b. 8 or 9. (8 of the 9 who would pay $40 will be the same 8 who would pay $50.)
Activity Two (page 10)
1. Cost of basic T-shirt, ink and stencil, preparation and design time, printing and tidy-up
2. a. The cost of the computer design program and of advertising, once he has paid for it.
b. Fixed costs are rent, computer design program, computer use, advertising.
3. a. 8. (40 minutes preparation and design time, 20 minutes printing and tidy-up time)
b. $12.50. (T-shirt and ink and stencil)
Activity Three (page 11)
1. Answers may vary. People might buy his T-shirts for Christmas presents or because it’s almost summer time.
2a.
b. The fixed cost of advertising and the computer design program need to be
spread across all the T-shirts. To get a rate per day, divide the fixed cost by the 10 days.
To get a rate per T-shirt, divide this daily rate by 8 because Whana is printing 8 T-shirts a day.
3. a. Answers will vary. The right-hand rule shows that after all the fixed costs have been met from the sale of the first T-shirt, the remaining T-shirts are cheaper to produce. The left-hand rule spreads out the cost across all 8 T-shirts produced in a day.
If Whana can screenprint 8 T-shirts per day, every day, the left-hand rule is best because it is simpler. However, if he is interrupted and doesn’t get all 8
T-shirts printed, the right-hand rule is best.
b. The right-hand graph matches the $26.50 per T-shirt rule. The left-hand graph matches the $54.50 for the first T-shirt rule.
4. a. $41.10 (using rounding) per T-shirt (GST inclusive), based on $36.50 per T-shirt ($26.50 costs + $10 profit, plus 12.5% GST). (Remember that his
“wages” are part of his costs, not part of the profit. Note that GST is payable once a business’s income reaches a certain level.)
b. $800. ($10 x 80 T-shirts)
Reflective questions
Answers may vary.
A spreadsheet would be useful because it allows Whana to change costs and/or prices and see what happens as a result. (This is called “if–then” analysis.) The
spreadsheet can also display the information graphically, which can be useful to see trends and patterns. If Whana prices his T-shirts at the top end of the market,
he may not sell enough to cover his costs and make a profit.