This is a level 4 algebra strand activity from the Figure It Out series.
A PDF of the student activity is included.
Click on the image to enlarge it. Click again to close. Download PDF (391 KB)
use a formula to continue a pattern
FIO, Level 4, Algebra, Book Three, Save Some Spend Some, page 1
computer spreadsheet
In this activity, students interpret, make, and solve problems using spreadsheets.
Note that there may be slight variations in how spreadsheets make the calculations in selected cells. Some require direct use of Fill Down in the Calculate menu while others automatically complete the calculations as soon as the appropriate cells are selected or allow the use of Copy and Paste commands. Even if students have had experiences with spreadsheets in other books in the Figure It Out series, you
will probably need to work with them as they carry out these tasks.
In questions 3 and 4, the students see the effect of making increased savings. Sarah makes changes to her savings pattern after 7 weeks when she stops purchasing her magazine at a cost of $4 a week. So the formula changes from =C8+6 in cell C9 for the savings after 7 weeks to =C9+10 in cell C10 for the savings after 8 weeks. The effect of this change is significant. The new savings plans proposed in
questions 3 and 4 for both Daniel and Sarah are shown below. The first spreadsheet shows the formulae that calculate the values shown in the second spreadsheet.
As an extension exercise, the students may wish to graph the differing savings plans in order to highlight what is going on. For example, the two scenarios presented for Daniel’s savings can be represented as shown:.gif)
Sarah’s savings plans could then be shown in another colour on the same graph or on a separate graph.
Answers to Activity
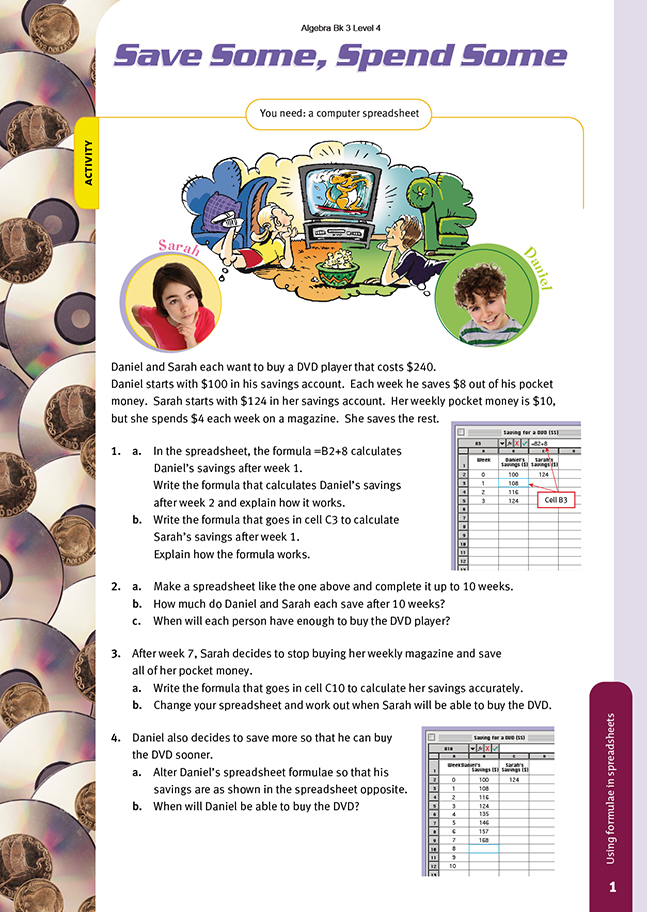
1. a. The formula is =B3+8. It adds 8 to the value 108 in cell B3, so the value in cell B4 becomes 116.
b. The formula is =C2+10–4 or just =C2+6. It adds 6 to the value 124 in cell C2, so the value in cell C3 becomes 130.
b. After 10 weeks, Daniel has saved $180 and Sarah has saved $184.
c. Daniel: after 18 weeks. (He has $236 after 17 weeks and $244 after 18 weeks.)
Sarah: after 20 weeks. (She has $238 after 19 weeks and $244 after 20 weeks.)
3. a. =C9+10
b. She will be able to buy the DVD player after 15 weeks. (She will have $236 after 14 weeks and $246 after 15 weeks.)
4. a. The new formulae are: =B5+11 in cell B6, =B6+11 in cell B7, =B7+11 in cell B8, and =B8+11 in cell B9. (The different figure in cell B6 shows that Daniel increases his savings after week 3.)
b. After 14 weeks. (He will have $234 after 13 weeks and $245 after 14 weeks.)