The purpose of this unit is to synthesise students’ fraction and decimal place value knowledge, thus enabling them to work with rates and ratios with understanding and competence.
- Understand what a ratio is and how it is written and read.
- Identify, describe, generate, and record equivalent part-to-part ratios.
- Create ratio tables.
- Identify, describe, generate, and record part-to-whole ratios.
- Recognise and record fractional relationships in ratios.
- Express ratios as fractions, decimal fractions and percentages.
- Apply ratio understanding to problem solving.
- Create and solve ratio problems.
- Understand what rates are and how they differ from ratios.
- Calculate and compare rates.
- Use graphs to show the linear relationship of a constant rate.
Implicit within students’ understanding of fractions and percentages is relational thinking, or the ability to see and use possibilities of variation between numbers in an equation. Just as fractions and percentages express part-whole relationships, a ratio expresses a relationship between two numbers of the same kind. It is usually expressed as ‘a to b’ or ‘a : b’, meaning that for every amount of one thing, there is so much more of another thing of the same kind. Ratios can express a part-to-part relationship, such as the number of boys to the number of girls in a group of children or a part-to-whole relationship, such as the number of boys to the number of children in the whole group.
It is not a significant conceptual shift for students to work with ratios, as their proportional nature is familiar, and the students’ ability to understand and work easily with multiplicative relationships is fundamental to any proportional thinking. This thinking has been consolidated in their fractional and percentage work, so the shift in their work with ratios is rather in the contexts in which ratios are most often used, and the interpretation of these contexts. However, students do encounter for the first time, the colon notation used in the expression of a ratio.
Students need to understand that, as with fractions, ratios can be reduced by common factors of the quantities, to make the simplest form. For example, a ratio of 20:60 can be represented in its simplest form as a ratio of 1:3. This can also be expressed as a fraction. The first amount is one third of the second amount. However, in this 1:3 part-to-part ratio, we can also see that there are 4 parts altogether (1 + 3) so the relationship of the first quantity (1) to the whole (4) can be expressed as 1/4. Students may not have recognised before that every fraction is in fact a ratio. It is important to model well with equipment both the part-to-part and part-to-whole relationships that make up ratios.
Rates
The key idea that students need to develop is that a ratio compares two amounts of the same kind of thing (eg. people: girls to boys, drink mix, odds) whilst a rate is a special kind of ratio that compares different kinds of measures such as dollars per kilogram. A distinguishing feature of a rate is that it uses the word per and the symbol /. Students therefore need to be able to co-ordinate pairs of numbers, and be competent in working with fractions, decimals and percentages, to calculate the multiplicative relationship between the number pairs and to make comparisons of rates.
A rate is a very important kind of ratio because many practical tasks in our lives involve some kind of rate: speed (kilometres per hour), remuneration (dollars paid per hour of work), health (pulse, heartbeats per minute), or the price of something (cost per unit bought), to name a few.
Constant rates are ordered pairs that result in a straight line when plotted on a number plane. The slope of the line is the unit rate, and the relationship between the numbers on the line does not change. This co-linear representation of a constant rate captures visually this multiplicative relationship ‘in action’.
Proportional thinking underpins one’s ability to make sense of and use easily ratios and rates in our daily lives. These ideas are presented in five sessions however, as they include complex concepts that are fundamental to a student’s success with ratios and rates, these sessions can be extended over a longer period of time.
Note: One very well known ratio is the golden ratio, also known as the golden mean. The golden ratio is a special number approximately equal to 1.618. It appears many times in geometry, art, architecture and other areas. Your students may well enjoy investigating exploring this remarkable ratio that has fascinated people for centuries.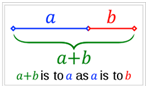
Links to the Number Framework
Stages 7- 8 (Advanced Multiplicative to Advanced Proportional)
The learning opportunities in this unit can be differentiated by providing or removing support to students and by varying the task requirements. Ways to differentiate include:
- beginning with simple ratios, e.g., 1:2, 1:3, and 2:3, and using objects like connecting cubes to model the ratios
- using symbols for ratios and fractions alongside physical and diagrammatic models
- progressing to working with the symbols alone, with the option of folding back to materials
- applying focused variation, particularly varying the number of objects while keeping the ratio the same
- asking predictive questions to encourage students to think beyond what is visible, e.g., If you make three copies of this ratio, 2:3, what ratio do you have in total?
- validating students' use of multiplication strategies, with the aim of moving them towards the use of more efficient strategies
- providing opportunities for students to work in a range of flexible groupings to encourage peer learning, scaffolding, and extension
- constructing a class chart of key ideas, models, and expressions to be used by students as a point of reference
- modelling and providing explicit teaching around the construction of tables, diagrams and graphs, and around the mathematical thinking involved in each stage of the unit. Gradually releasing your level of responsibility allows you to scaffold students towards working independently
- allowing the use of calculators for making predictions and confirming calculations, and to ease the mental load associated with calculation.
The contexts for this unit involve collections of discrete objects (e.g. people, scoops of mochaccino mix). These contexts might be supplemented by, or adapted to, better reflect students' interests, cultural backgrounds, or to make connections to learning from other curriculum areas. Examples might include ratios in cooking, ratios of positions in sports teams or genders in a class, or in the dimensions of human faces. Consider how you can utilise these ratio and rate problems as a way to make connections between mathematics and your students' 'real-world' contexts.
Te reo Māori kupu such as ōwehenga (ratio), hautanga (fraction), whakarea (multiplication, multiply), and pāpātanga (rate) could be introduced in this unit and used throughout other mathematical learning.
- Paper or small whiteboards
- Copymaster 1
- Copymaster 2
- Copymaster 3
- Copymaster 4
- Brown and white Unifix cubes (or a digital representation)
Session 1
SLOs:
- Understand what a ratio is and how it is written and read.
- Identify, describe, generate, and record equivalent part-to-part ratios.
- Create ratio tables.
Activity 1
- Begin the session by sharing this problem (or an adapted version) with the class. Ask them to try use multiplication (as opposed to addition) strategies in their solution:
1/4 or 25% of the class are absent. There are 18 students present.
How many students are in the whole class?
- Give students time to solve the problem and have several share their solutions.
Highlight the fact that they were using their multiplicative thinking and looking for relationships between the numbers.
- Point out that this session is about exploring relationships between numbers but that these will be presented in a slightly different way.
- Distribute the shuffled picture cards only of Copymaster 1 (Class Ratios) to student pairs. Pose this problem:
Look closely at the numbers of girls and boys on each card.
Can you group any of these cards together?
If so, can you explain why you have grouped them as you have?
Give students time to explore, discuss and group.
(a. 1:3, 2:6, 3:9 and 4:12, b. 2:3, 4:6, c. 1:2, 2:4, d. 4:4, 3:3. Two do not have an equivalent: 3:4 and 2:5)
- Have student pairs share their groupings. Roam and listen as they explain.
Summarise student findings, accepting all ideas. Emphasise that students are looking at part-to-part ratios (e.g. the number of boys to the number of girls in a group of children). You might write this on the board to refer back to.
Activity 2
- Distribute the white cards (shuffled) to student pairs.
Ask a student to read one of the cards aloud.
Ask what we call this representation (a ratio) and ask for an explanation from the students.
Record student ideas on the class chart. Elicit key ideas:
A ratio is a relationship between two numbers of the same kind and is usually expressed as ‘a to b’ or ‘a : b’. This is saying that for every amount of one thing there is so much of another thing of the same kind.
A ratio is expressed using a colon. A ratio is expressed in the order the two amounts are presented:
For example: This shows one girl to three boys. We would write the ratio as 1:3, not as 3:1.
- Have students read several of the ratios aloud: eg. (“one to three”, “two to six”…).
- Have student pairs match the white ratio cards with the picture cards. If same ratio groupings have not already been established, encourage students to look for these by looking closely at the numbers.
- Group ratios on the class chart and discuss the number relationships. Have students discuss and explain how these can be simplified.
a. 1:3, 2:6, 3:9 and 4:12 (1:3)
On each of the cards demonstrate how the 1:3 ratio is evident in each.
In each case the number of girls is 1/3 of the number of boys.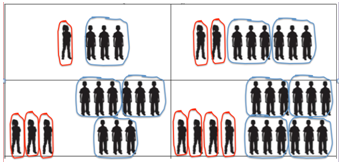
Explore the paired equivalent cards, discuss, and have the students explain the number relationships for each pair.
b. 2:3, 4:6 (there are 2 girls for every 3 boys: the number of girls is 2/3 the number of boys)
c. 1:2, 2:4 (there is 1 girls for every 2 boys: the number of girls is 1/2 the number of boys)
d. 4:4, 3:3 (there is 1 girls for every 1 boy: the number of girls and boys is the same)
- Explore the two cards that do not have given equivalents: (3:4 and 2:5). Emphasise that each of these is presented in its simplest form.
- Together generate a ratio table for 3:4.
| Girls | 3 | 6 | 9 | 12 | 15 | 18 | 21 |
| Boys | 4 | 8 | 12 | 16 | 20 | 24 | 28 |
- Discuss what is happening to the numbers of girls and the number of boys.
Emphasise that the ratio of 3:4 remains the same. In each case there are 3/4 as many girls as there are boys.
- Ensure students have paper/small whiteboards available.
Have student pairs discuss and create a ratio table for 2:5 and ‘draw’ what the first three would look like using simple girl/boy ‘pictures (modeled on the cards of Copymaster 1).
- Have student pairs suggest at least one more different girl:boy ratio of their own, and generate a table for this.
- Conclude this session by collecting the Copymaster 1 ratio cards from this session and summarising, on the class chart, what the students have learned about part-to-part ratios.
Session 2
SLOs:
- Identify, describe, generate, and record part-to-whole ratios.
- Recognise and record fractional relationships in ratios.
- Express ratios as fractions, decimal fractions and percentages.
Activity 1
- Write part-to-part ratio on the class chart.
Distribute the shuffled picture cards only of Copymaster 1 (Class Ratios) to student pairs.
Point out that so far the class has explored the ratio between two parts of a group, the number of girls to the number of boys. Emphasise that this kind of ratio is known as a part to part ratio.
- Explain that this session will introduce a different kind of ratio. Distribute the shuffled green cards to student pairs and have the students match these with the picture cards. Tell them that they need to be prepared to explain what each of the ratio cards expresses (i.e. the ratio of girls to the whole class).
- Have student pairs share their results with another pair. Select some students to share their thinking with a whole class, and confirm what the ratio cards express.
- As a group, ask the students what this kind of ratio describes: this is a part to whole ratio. Ask if the students notice anything about the ratio (each can be expressed as a fraction: what fraction are the girls of the whole group?)
Activity 2
- Explore a part-to-whole fractional relationship by using the ratio table generated in Session 1. (Refer to the picture card and ratio card showing 3:7, number of girls to number in the whole group).
- Add the group total line to the ratio table and ask a student to complete this for the class, with the help of the rest of the class.
| Girls | 3 | 6 | 9 | 12 | 15 | 18 | 21 |
| Boys | 4 | 8 | 12 | 16 | 20 | 24 | 28 |
| Total in group/class | 7 | 14 | 21 | 28 | 35 | 42 | 49 |
- As a class, identify what fraction of the class the girls are, in each instance, and record these:
(3/7, 6/14, 9/21, 12/28, 15/35, 18/42, 21/49)
- Write these fractions on the class chart:
1/1, 2/2, 3/3, 4/4, 5/5, 6/6 and 7/7
Ask students what they notice about these fractions. Emphasise that they are all ways of writing 1.
- Explore and record these fractional relationships.
3/7 x 2/2 = 6/14
3/7 x 3/3 = 9/21
3/7 x 4/4 = 12/28
3/7 x 5/5 = 15/35
3/7 x 6/6 = 18/42
3/7 x 7/7 = 21/49
Elicit from the students that all fractions are an expression of 3/7 or a 3:7 part to whole ratio.
Activity 3
- Distribute the blank pale blue cards from Copymaster 1 to each student pair and have them write for each of the picture cards, the ratio of boys to the whole group.
- Have student pairs use the ratio table generated in Session 1, Activity 2, Step 6 for the 2:5 ratio of girls to boys.
They should:
1. Add a group total line and complete this.
2. Explore the fractional relationships as in Activity 2, Step 2 above between the boys and the whole group.
3. Confirm that the decimal fraction for each is the same.
4. State what percentage the boys are of the whole group.
For example:
| Girls | 2 | 4 | 6 | 8 | 10 | 12 | 14 |
| Boys | 5 | 10 | 15 | 20 | 25 | 30 | 35 |
| Total in group/class | 7 | 14 | 21 | 28 | 35 | 42 | 49 |
The fraction of boys in each group: 5/7, 10/14, 15/21, 20/28, 25/35, 30/42, 35/49
These can be explored this way:
5/7 x 1/1 = 5/7
5/7 x 2/2 = 10/14,
5/7 x 3/3 = 15/21,
5/7 x 4/4 = 20/28,
5/7 x 5/5 = 25/35,
5/7 x 6/6 = 30/42,
5/7 x 7/7 = 35/49
- Discuss and agree that all are expressions of a 5:7 part-to-whole ratio which can be expressed as a fraction. Therefore, the boys are always 5/7 of the whole class according to these expressions.
- Discuss and agree that this can be expressed as a decimal fraction: 5 ÷ 7 = 0.714 (check each fraction is equivalent to the same decimal fraction eg. 35 ÷ 49 = 0.714).
- Discuss and agree that the 5:7 part-to-whole ratio can also be expressed as a percentage. In this case the percentage of boys in the group class is 71.4%.
Activity 4
- Have students pair share and check their results.
- Conclude the session by recording students’ reflections about part-to-whole ratio learning and the decimal and percentage calculations.
Session 3
SLOs:
- Apply ratio understanding to problem solving.
- Create and solve ratio problems.
Activity 1
- Distribute Copymaster 2 asking students to complete this on their own or in pairs.
- Discuss. Ask students to share their responses to the question in Copymaster 2, “Is there anything else you know?” Notice students’ explanations.
- Ask for, and develop, a list of contexts in the students’ lives in which ratios are used in a very practical sense. (For example: in recipes for food and drink, scaling up and down models and maps, ratio of kinds of people such as left handed to right handed people).
Activity 3
- Pose this problem (Copymaster 3) and make brown and white Unifix cubes (or a digital representation) available:
Mochaccino Mix
Millie and Maxwell are creating their own homemade ‘mochaccinos’ with scoops of mochaccino mix (MM) and scoops of milk (m).
Which cup has the stronger mochaccino flavour?
How do you know?
| 2:6 (MM:m) | 5:11 (MM:m) |
| Millie | Maxwell |
- Have student pairs model the ratio with cubes, discuss how they would solve it and agree on a solution.
 |  |
- Have students share their thinking and solution with another pair. Choose some pairs to share their thinking with the rest of the class. Confirm the answer and model the solution, as necessary.
Answer:
They should include (some of) these ideas.
Millie: 2:6, MM is 2/8 (1/4) of the mix (this is the same as 4:16).
MM is 25% of the mix.
Maxwell 5:11, MM is 5/16 of the mix.
MM is 31.25% of the mix.
Maxwell’s mochaccino has a slightly stronger flavour. It has 1/16 (6.25%) more mochaccino mix.
 |  |
| Millie's | Maxwell's |
- Tell the students that it is their turn to make a mochaccino. Pose the following questions (included on the Copymaster) and allow students to work in groups to find a solution. Roam and provide support, questioning, and guidance.
You decide to make some mochaccinos using Millie’s recipe.
If you use 18 scoops of milk, how many scoops of MM will you use?
If you use 1 1/2 scoops of MM, how many scoops of milk will you use?
If Millie’s recipe makes a small drink for one person, what quantities will you use to make a small drink for eight people using Millie’s recipe?
You decide to make your own mix.
You use a 2:8 ratio in your first drink. What percentage is mochaccino mix?
Your second drink mix is stronger. You use a 3:7 ratio. What percentage is milk?
Your third drink mix is really thick. It is made with 40% mochaccino mix. What ratio did you use?
Answers:
6, 4 1/2 , 16MM:48m
20%, 70%, 4:6 or 2:3
Activity 4
- Pose this problem (from Copymaster 3):
Odds
It’s winter in the south. Four children are predicting the likelihood of school having to close early because of the snowfall that is predicted. They state their odds as Yes will close (Y) to No, won’t close (N).
Here are their odds. Y:N
| 3:5 | 7:9 | 5:11 | 6:10 |
| Filipo | Toni | Arapeta | Mona |
- If you wanted the odds of school closing to be greater, whose odds would you pick and why?
- Whose odds show the greatest chance of school remaining open?
Answers:
1. Toni.
2. Arapeta.
(Toni 7:9 is a 7/16 chance of closing. Filipo 3:5 is a 3/8 or 6/16 chance of closing. Mona 6:10 is a 6/16 chance of closing. Arapeta 5:11 is a 5/16 chance of closing.)
Activity 5
- Refer to the contexts brainstormed in Activity 2 of this session.
- Have student pairs write (at least) two ratio problems and work out the answers.
- Have them give their ratio problems to another pair to solve.
- Bring the class together, as necessary, to discuss the mathematics involved in the new ratio problems. Identify the problems that were particularly challenging/successful/enjoyable.
Session 4
SLOs:
- Investigate conjectures involving ratios.
Activity 1
- Remind students of the mochaccino ratios from Session 3.
Mochaccino Mix
Millie and Maxwell are creating their own homemade ‘mochaccinos’ with scoops of mochaccino mix (MM) and scoops of milk (m).
| 2:6 (MM:m) | 5:11 (MM:m) |
| Millie | Maxwell |
- Write on the class chart and explain that Millie has stated: If Maxwell and I combine our mochaccino mixtures to make one big cup of coffee, the combined ratio will be 7:17 (MM:m). You add two ratios together to give a combined ratio.
- Challenge the students in pairs to explore, argue and justify their position of agreement or disagreement with this conjecture.
(Answer. This is so with a single combination, or where the number of cups are the same for each)
Activity 2
- Pose the following problem: Millie makes her mochaccinos (2:6MM:m) for 1 person and Maxwell makes his mochaccinos (5:11 MM:m) for 2 people. Maxwell makes this statement: The combined ratio of our combined mochaccino mixtures is 7:17 You add two ratios together to give a combined ratio.
- Challenge the students in pairs to explore, argue and justify their position of agreement or disagreement with this conjecture.
(Answer: This is not correct. These represent different quantities. The combined ratio must be calculated from the combined quantities.
2:6 1 mochaccino made by Millie
10:22 2 mochaccinos made by Maxwell
12:28 the combined ratios of MM and m
6:14 or 3:7 the simplified combined ratio of MM and m)
- Have students pose a similar combination problem of their own for investigation, using different numbers of cups for Millie and Maxwell. Have them swap problems with a partner, and provide time for them to solve and discuss the problems they have been given.
- Gather as a class and discuss the problems, as well as any challenges students faced.
- Have pairs of students work together to formulate a general statement about ratios and how they work (conjecture). Share (e.g. digitally, on sticky notes) and discuss these as a class. Emphasise that just one counter example is sufficient to disprove the proposition (false conjecture).
Session 5
SLOs:
- Understand what rates are and how they differ from ratios.
- Calculate and compare rates.
- Use graphs to show the linear relationship of a constant rate.
Activity 1
- Have each student write down their definition of a ratio. Ask selected students to share what they have written.
Eg. A ratio is a relationship between two amounts of the same kind (eg. people: girls to boys, drink mix, odds) usually expressed as ‘a to b’.
- Write Rate on the class chart. Have each student write their own definition and share what they have written.
Elicit and record the difference and these key ideas about rates:
A rate is a special kind of ratio: a rate compares different kinds of measures such as dollars per kilogram.
A rate involves a multiplicative comparison and uses the word per and the symbol /.
- Have students brainstorm and record rates that they experience/know of in their own lives: For example:
dollars per hour (pay rate), metres per second or kilometres per hour (rate of speed), heartbeats per minute (pulse rate).
Activity 2
- Have students suggest a rate of speed that they travel on their bicycles: for example 30 km/hour.
Record this in full: 30 kilometres per hour and beside this write the abbreviation.
- Ask for a student to explain what this rate means: “In every hour I ride 30 kilometres”.
Write on class chart:
| Distance (km) | Time (minutes) |
| 30 | 60 |
| 10 |
- Pose: How long will it take to ride 10 km? Ask students to discuss this in pairs and be prepared to explain 2 ways of working out their response.
- Ask at least one student pair to explain their thinking.
- Elicit and demonstrate:
- the between relationship: 30 is half of 60 so 10 must be half of 20
- the within relationship: 10 is one third of 30 so 20 is one third of 60.
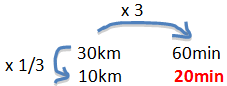
This is equivalent to half a kilometre per minute or 30 km/hour. (30 kilometres/60 minutes)
- Explore other examples, each time highlighting the between and within relationships.
How long to ride 60 km?
How long to ride 40 km?
How long to ride 15 km?
How far in 30 minutes?
How far in 45 minutes?
How far in 10 minutes?
- Ask, what is meant by a constant rate? (In this case the rate is 30km/hour and this doesn’t change regardless of distance.) Discuss whether this is realistic, for example, cycling over a long distance.
- Highlight the fact that in exploring the examples in the next task a constant rate is assumed.
Activity 2
- Explain that students are going to investigate Millie and Maxwell’s coffee making a little further.
- Distribute one set of coloured cards (3) from page 1 of Copymaster 4 to each student pair.
- Provide time for students to solve the problems posed, recording their ‘between’ or ‘within’ thinking as they do so.
- Emphasise that they need to be able to show and explain the multiplicative relationship between the numbers.
- Make the relevant coloured section of page 2, Copymaster 4 available, if required, to scaffold their calculations and recording.
- Have student pairs share their work with another student pair with the same coloured problem, explaining their results and the rationale for these.
- Have one person from the group of 4 collect a piece of graph paper for each member of the group. Have them discuss in a group how they would show this rate on a graph.
- Have each student create a graph showing the linear relationship. Compare.
- Have student pairs swap coloured problems, solve and repeat 2-4 above.
- Have student pairs write two more problem scenarios for Millie and Maxwell. Suggested contexts: speed that they ride home from school on their bikes, the pulse rate of the person who drinks the mochaccino.
- Solve each other’s problems in pairs or as a class.
- On the class chart, summarise key learning about rates.
Dear families and whānau,
We have been working with rates and ratios in class. Your child would like to tell you about what they have been learning and invite you to solve with them and discuss these problems that they have worked on in class.
Perhaps you could also discuss and explore rates that you know and use in your own lives.
We trust that you find this both challenging and enjoyable.
We hope that you learn together and enjoy the mathematics.