Solve problems involving ratios.
Number Framework Stage 8
Using Materials
In Mixing Colours, a sequence was provided for introducing the part-whole relationships in ratios and expressing them as fractions and percentages. The lesson for Extending Mixing Colours should initially follow the same sequence. The notes below show how the Number Properties phase of the lesson can be made more complex.
It is important for students at the Advanced Proportional stage to have multiplicative strategies to compare ratios without needing to replicate the ratios until a common part or whole is found, e.g., at earlier stages, to compare 2:4 with 3:5, both are duplicated (2:4 = 4:8 = 6:12 … and 3:5 = 6:10 …) until a common part of 6 measures of A is found.
Using Imaging
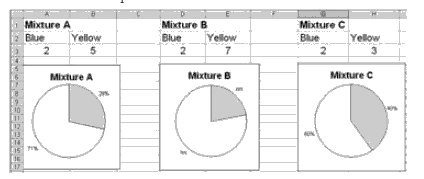
Follow the steps on the next page to create a computer spreadsheet that allows ratios to be displayed simultaneously as a table and connected graph. This spreadsheet can be accessed online by downloading Material Master 7–10. Create a table like this:
2. For each mixture, create a pie graph and embed it in the spreadsheet rather than save it as a separate file. This means that any changes made to the cell entries are transferred to the pie chart.
The spreadsheet can then be used to compare mixtures visually and numerically. In the example above, the proportion of blue changes while the actual amount of it stays constant (two units).
Ask the students how the percentage of each colour was calculated and why this made the comparison easier. Percentages provide a common denominator of 100 for the equivalent fractions. In Mixture A, there are 2 units of blue out of a total number of 2 + 5 = 7 units. 2/7 = 2 ÷ 7 = 0.2857 = 28.57%.
Pose other problems requiring students to compare ratios. Ask the students to anticipate which mixture gives the darkest shade of green before the spreadsheet is used to confirm. (A blue and yellow mixture produces green. The greater the proportion of blue, the darker the green will be.)
Good examples are (blue:yellow):
Using Number Properties
Provide similar problems but allow students access only to their calculators rather than to any visual display. If confusions arise, the spreadsheet can be used to check solutions. Expect students to justify their calculation steps and encourage estimation and use of leveraging from known benchmark fractions, e.g., 5/11 > is slightly less than one-half or 50%.
Further problems are:


