This is a level 4 number activity from the Figure It Out series. It relates to Stage 7 of the Number Framework. It is also a level 3 statistics activity.
A PDF of the student activity is included.


Click on the image to enlarge it. Click again to close. Download PDF (1498 KB)
find a percentage of a number using a calculator
find the probability of an event occurring
Number Framework Links
These activities involve finding percentages of decimal amounts and calculating percentage increases and decreases. They are appropriate for students who are at stage 8 and could also be accessible for those at stage 7 with teacher help. Students who are at stage 6 will need a lot of scaffolding with the mathematics involved.
Students should preferably have had exposure to percentages before attempting these activities. (See the table of NDP material on page 4.) It will also help students if they know the conversions between basic fractions and percentages, for example, that 10 percent = 1/10 and that therefore calculating 10 percent of 300 is equivalent to finding 1/10 of 300 (= 30).
A copy of Tavita's investment simulation sheet (see Copymaster)
FIO, Level 3-4, Financial Literacy: Granny’s Gift, Investing on the Share Market, pages 21-23
A dice
2 classmates
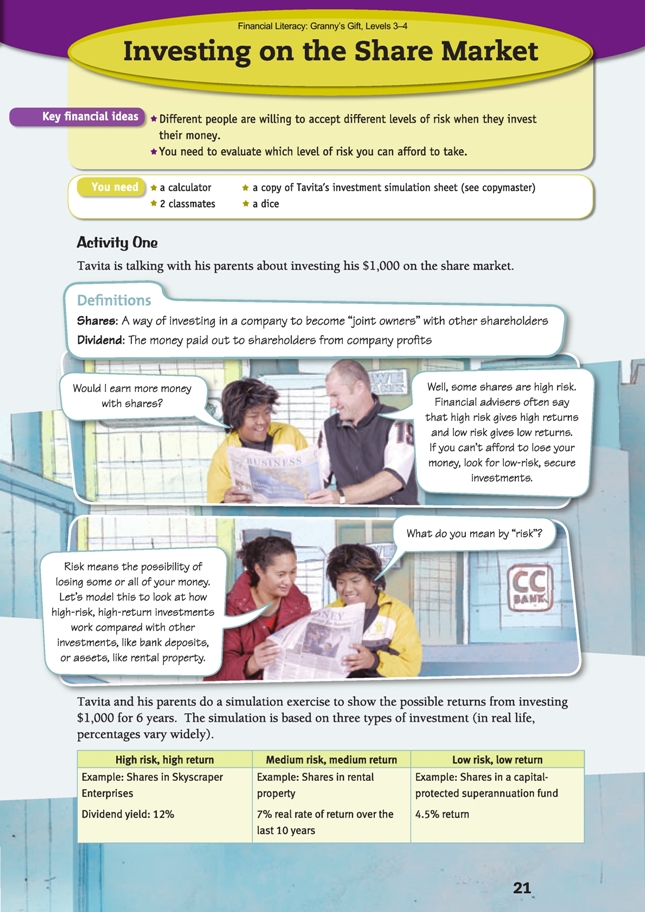
Activity One
Financial understanding
In this activity, Tavita learns that there is always an element of risk in investing and that it’s important to identify the level of risk a person is prepared to take and is comfortable with before making a decision.
A key idea for this activity is the notion of risk. One way to introduce this to your students is within the context of probability and popular culture.
Say: At the Fear Factory, you are offered the chance to win prizes on the roll of a dice after doing a special task. If you eat a worm and then roll a 1, you win $100. If you eat a dry wheat biscuit and roll a 2, 3, 4, 5, or 6, then you win $10.
Which prize chance do you choose?
Discuss with students how the worm option is the riskiest (you could eat a worm and still win nothing) but involves the biggest reward. The wheat biscuit option also has a risk of winning nothing but there is a much greater chance of winning something, although the prize money is less. To understand this concept of risk, students need to also understand that the probability of rolling just one of six numbers is much less than that of rolling any one of five out of six numbers. When investing money, there is always risk involved. At the fear factory, you may have to eat something horrible and win nothing; similarly, when you invest money, you may receive nothing extra – or get back even less than you invested.
The purpose of question 1 is for students to understand what happens when money is invested with different types of investments rather than understanding the actual calculations being made. It may be useful to ask them a number of questions about the table in order to guide their own reading of the situation. For example:
What is the starting investment amount? ($1,000) What happened with the first dice roll? (A 1 was rolled, so all investments lost money.)
Why might investments lose money? (There might be a downturn in the market.)
Which investment option made the most money after 2 years? (Low risk, after 4 rolls, with $9.40 profit)
Which investment option made the most money after 3 years? (High risk, with $237.50 profit)
How long did it take the medium-risk investment to make $200? (7 rolls, that is, 3 years)
(Note: In order to understand the simulation, students may also need it reinforced that each dice roll stands for 6 months.)
After the above discussion, the students should be able to cope independently or in collaborative groups with the similar questions in the book.
As an extension, the students could create a triple line graph of the simulation to provide a picture of what is happening to the funds, for example:
This graph makes it clear that the low-risk, low-return investment is slow and steady, whereas even though the high-risk investment suffered a setback in the first 6 months, which had an impact until the end of the second year, over time it recovered and made the most money. People who are able to invest for a longer period of time
often choose an investment option that is high risk and high return, but if they want to invest just for a short term (perhaps because they need or want access to their money earlier) they choose a lower risk, low-return option – such as a bank.
Mathematics and statistics
The investment simulation involves complex mathematics. It’s important that the students can relate the percentages to risk and to probabilities. One way to examine the effects of the dice rolls is to imagine that all outcomes will happen (that is, every number will be rolled once) to get an expected value.
In the high-risk, high-return situation, if all numbers are rolled once, the net result can be approximated as – 25% + 0 + 0 + 0 + 10% + 50% = + 35%. The medium-risk, medium-return investment approximates as – 5% + 0 + 0 + 5% + 5% + 10% = + 15%. The low-risk, low-return will approximate as – 2% + 0 + 0 + 3% + 3% + 3% = + 7%.
Ask: Which investment gives the greatest return? (High risk, high return is potentially best, for example, 35 percent of $1,000 is $350 [compared with $150 or $70].)
What if we roll only a 1? Which investment is riskiest? (High risk, high return is riskiest as it will lose 25 percent, for example, 25 percent of $1,000 is $250, compared with losing $50 or $20.)
Question 2 does require students to be able to calculate percentages, which with these “untidy” figures provides quite a challenging context. It is therefore appropriate to use a calculator. The activities on pages 10–11 will provide students with an introduction to calculating difficult percentages with large numbers.
There is a table in the Answers section for Activity One, question 2, that shows the effect of possible dice throws on investments after 6 years. It starts like this:
Note that with dice roll 1, rather than calculating 25 percent and subtracting it from the previous total, it is much quicker to calculate 75 percent of the previous total. Using a multiplier of 0.75 means a one-step calculation. Multiplying by 0.25 would involve multiple steps (and increase the possibility of errors).
Similarly, use “multiply by 0.95” instead of “multiply by 0.05 and subtract” for medium risk and “multiply by 0.98” instead of “multiply by 0.02 and subtract” for low risk. (See the table of NDP material on page 4.)
Note that, on some calculators, if you enter “original figure” – percentage (for example, 2041.88 – 25) and then press the % button on the calculator, you also get the answer very quickly.
Game
Financial understanding
In this game, students compare the results from the games they play and discuss the effects of the different types of risk. In this way, they learn the effect of different levels of risk when investing in the share market. The simulation illustrates that although you can “calculate” the probability of such risks, chance can also have an effect.
The game provides students with the opportunity to take part in their own simulation. Students will need to successfully complete question 2 and understand how to use the multipliers used in the above table in order to be able to attempt the investment simulation game. By multiplying in this way, they can keep a running total on the calculator rather than writing down multi-step calculations.
Activity Two
Financial understanding
In this activity, Tavita learns that he can make money from the share market by selling his shares for a profit, cashing in his dividends, or reinvesting his dividends by buying more shares (and therefore potentially getting more dividends the next time they are due). As an investor, the decisions Tavita makes now will determine how
well off he will be in the future. Note that, although in the scenario the share price increases, in reality, a share price can move both up and down, so there is risk in this type of investment in that some of the initial money invested can be lost. This is a valuable discussion to have with the students.
Tavita monitors and evaluates the success (or otherwise) of his share portfolio so that he can have the best information on which to base his next financial decision.
In question 3, the students will most likely need to have the concept of a dividend explained to them. (A dividend is part of a company’s profit that is paid to shareholders; see the definition on page 21 of the students’ book.) Investors are often given the choice of reinvesting their total dividend as new shares or taking the
dividend as money. Note that, in question 3b, Tavita has enough to buy only 11 shares because, although 11.55 rounds up to 12, in the context of this problem, Tavita does not receive enough to buy a twelfth share, so the answer must be rounded down.)
Mathematics and statistics
Question 1 is a simple division problem. A good strategy is to recognise that 1 000 ÷ 2.5 is equivalent to 2 000 ÷ 5 (and also to 4 000 ÷ 10), which is 400 (shares). (See the table of NDP material on page 4.)
For question 2a, 400 x $2.77 is equivalent to 4 x $277. The students could solve this in a variety of ways, such as: 4 x 200 = 800, 4 x 70 = 280, 4 x 7 = 28, therefore 4 x 277 = 800 + 280 + 28 = 1 108; or: 2 x 250 = 500 and 2 x 27 = 54, therefore 4 x 250 = 1 000 and 4 x 27 = 108, therefore 4 x 277 = $1,108.
Extension
Financial understanding
Many students are very motivated by the idea of investing in the share market.
At the start of term, you could assign the students various sums of virtual money. Pairs of students (randomly assigned) are able to invest their “money” on the share market. Have students look in the financial pages of the newspaper to select how they will invest their money. It is useful to have outside visitors (for example, someone
from the local bank) come to discuss with students how to invest wisely. The investment is then “locked in” for the rest of the school term and the one following. At the end of that second term, students can find the value of their shares and calculate their gain (or loss).
Social Sciences Links
Social Sciences achievement objectives:
• Understand how people make decisions about access to and use of resources (Social Studies, level 3)
• Understand how producers and consumers exercise their rights and meet their responsibilities (Social Studies, level 4)
For Activity Two, the students could consider investigating the following questions: What rights and responsibilities does Tavita have as an investor (consumer of the stock exchange)? Who and what “protects” (governs) these rights and responsibilities?
Answers to Activities
Activity One
1. a. The low-risk, low-return investment
b. After 2.5 years (5 rolls)
c. The high-risk, high-return investment
d. A dice roll of 1 decreases your investment by 25%, so you not only don’t get any
dividends, you may also end up with less money than you started with.
e. Answers may vary. In most cases, there is very little risk of losing your capital
investment, but although your capital may be safe, you won’t earn as much interest as on riskier investments. However, the advantages of feeling that your money is “safe” may outweigh the lower income from it.
2. Answers will vary, depending on the roll of the dice. Check your dice throw on the table below. (*The amounts in row 1 are the value of each investment after 6 months, year 6.)
Game
A game simulating investment options, followed by discussion.
1.–2. Results and discussion will vary.
3. a. By throwing more 1s, you will either earn less money than you hoped or even lose money.
b. With each investment, you are more likely to earn money than to lose money. (There are three numbers on the dice where you earn money and only one number where you lose money.) However, with the highrisk, high-return plan, the risk of ending up with less money is elevated because of the high percentage involved. (With each individual roll, the risk of losing money is 1 in 6.)
Activity Two
1. 400 shares
2. a. $1,108
b. $108
3. a. $32
b. 11 shares
Reflective questions
• Answers will vary.
• If people invest in more than one company (possibly a mix of risk types), there is less chance of losing all your money if any one company fails. For example, if a high-risk investment loses money, you would most likely still have income from your low-risk investment.