In this unit students investigate the link between experimental estimates of probability and theoretical probability. They also learn about short run variability and independence/dependence of events.
- Explore the theoretical and experimental probabilities of situations involving chance
- Recognise variability from theoretical expectations, especially with small numbers of trials
- Estimate and find the relative frequencies of events
- Distinguish between events and the outcomes that lead to those events
- Distinguish between dependent and independent events.
Simply put, probability is a measure of the likelihood of an event occurring. Just like 2.3 metres is a measure of length, 50% or 1/2 is a measure of the chance of getting heads with a single coin toss.
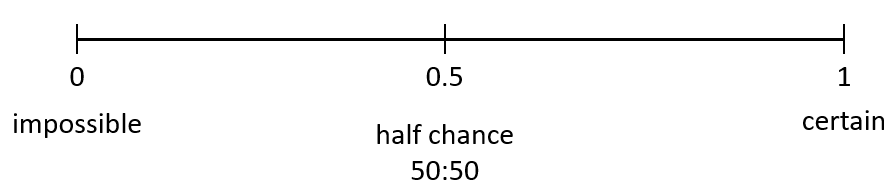
Probabilities range from zero to one (0-100%). An event that always occurs is certain and has a probability of 1 or 100%. An event that never occurs is impossible and has a probability of 0 or 0%.
There are two ways to estimate or calculate the probability of an event occurring. An experiment consists of trials where the event may occur. For example, a coin might be tossed 100 times and the results used to estimate the probability of heads occurring. The experimental probability is unlikely to be exactly 50% but the results will provide an approximate measure for the likelihood.
The likelihood of some events can be worked out theoretically. A model must find all the possible outcomes and identify which of the outcomes leads to the event occurring. The probability is expressed as a part-whole fraction, Number of outcomes that lead to the event/Total number of possible outcomes. In the simple case of a coin toss there are two possible outcomes, and one of those outcomes leads to the event of heads. Therefore, the probability of heads equals 1/2.
In more complex situations involving chance, models of theoretical probability become more complex. Events are independent if they do not influence each other. Tossing two separate coins involves independent events as the result from the first coin has no impact on the result from the second coin. Selecting two coloured pegs from a bag, without placing the pegs back in the bag after each turn, involves two dependent events. The result of the first peg draw affects the possible outcomes for the second peg draw.
The learning opportunities in this unit can be differentiated by providing or removing support to students and by varying the task requirements. Ways to support students include:
- using drawing diagrams and acting out as strategies to represent how all the possible outcomes can be found. For example, simulate creating three-child families by drawing three cubes of two colours (for boys and girls) from a bag, and drawing the arms of the tree diagram as the outcomes occur
- clarifying the language of probability, particularly words like ‘chance’, ‘likelihood’, 'certain', 'impossible', and more technical terms such as ‘experiment’, ‘trial’, and ‘theory'
- encouraging students to work collaboratively (mahi-tahi) so they can share their knowledge and develop persistence
- modeling efficient ways to record the results of trials, especially tally charts and frequency tables
- modeling ways to find all the possible outcomes, such as tables, networks, and systematic lists
- easing the calculation demands by providing calculators, particularly for converting among fractions, decimals, and percentages.
Tasks can be varied in many ways including:
- reducing the complexity of the situations, e.g. two child families before progressing the three and four child possible outcomes
- allowing sufficient opportunities for practical exploration, and teacher and student modeling, so students develop sense of how the activity works, and a sense of which events are most likely or least likely
- encouraging informal prediction about probabilities and testing those predictions out by experiment
- selecting sample sizes that make comparison between theoretical and experimental probabilities easier. For example, if there are eight possible outcomes for three child families then use multiples of eight, such as 16, 24, and 40 as the sample size.
The context for this unit can be adapted to suit the interests and cultural backgrounds of your students. Most students are captivated by games of chance and are intrigued when their expectations about fairness do not match what occurs. This unit uses contexts such as traffic lights, fish populations, horse races, and family makeup. These contexts can be adapted to others without losing integrity, such as sampling shellfish populations, or other rare animals such as kiwi or tuatara. Horse races could be replaced by waka racing. Card games are also ideal opportunities to investigate probability.
The following te reo Māori vocabulary terms could be introduced in this unit and used throughout other mathematical learning, raraunga (data), ōrau (percentage), tūponotanga (probability, chance), pāpono (event, probability), matapae (prediction), putanga (outcome), hoahoa rākau (tree diagram), tūtohi (chart/table of data), tūtohi tatau (tally chart) , auau (frequency), kauwhata porowhita (pie graph).
- Counters
- Standard dice
- Paper bags or plastic containers (e.g., icecream)
- Blank wooden cubes (for the optional assessment task)
- Copymaster 1
- Copymaster 2
- Copymaster 3
- Copymaster 4
- Copymaster 5
- Copymaster 6
- PowerPoint 1
- PowerPoint 2
- PowerPoint 3
Session One
- Begin the session by asking: Who in this class is a netball fan?
(Maybe the fans can explain how the game works. Perhaps show a brief highlights video from a recent game). This context could be adapted to recent sports events that are relevant and interesting to your students (e.g. Olympic sports, Rugby World Cup matches). The learning in this session could be used as the basis for independent/paired student investigations into different sports teams and matches. - Tell your students that they are going to simulate a game of netball played between two rival netball teams, the Rockets and the Emeralds .
What do you think a simulation is?
A simulation is an imitation of the real thing, so the game will not be real. Discuss: What positions shoot for a goal in netball? (Goal Shoot and Goal Attack)
I have looked at a few games played between the two teams to see how accurate the goal shooters are. Here is the data.
Show them this table of results:Team Goals Total Shots Taken Rockets 259 298 Emeralds 277 324 - Tell the students to discuss the data in their groups and to come up with some statements about the shooting performance of the two teams in the last few games. You may wish to lead them with questions such as:
How many games between the two countries do you think are included in these results? Explain. (Teams usually score around 50 goals per game)
How can we compare how accurate the shooters of both teams are?
(Students need to recognise that there were different numbers of shots taken so fractions/percentages are needed. Look online for netball shooting statistics to see that percentages are used – Why? Use a calculator to find the percentages, i.e. 259 ÷ 298 = 87% and 277 ÷ 324 = 85%, and discuss rounding to the nearest percent) - Ask: If the goal shoots of each team had ten shots, how many would you expect to be goals? (Eight or nine goals is a good estimate from the percentages. Relate 87% as 87 in every 100 to about 9 in every 10)
What is the purpose of working out the shooting percentage? - Share the results of their discussions. Look for statements such as:
- The Emeralds' shooters seem to be slightly more accurate than the Rockets' shooters
- The Rockets' shooters take more shots and get more goals.
- Ask students to imagine that it is part way through the game and one of the Rockets' shooters is about to take a shot.
What are the chances that this shot will be a goal? - Discuss factors that affect the chances, like distance from the goal, how far the shooter has run to get the ball, the attention of the defence players, who the shooter is, how important the goal is to the game outcome, etc.. Some students may mention that all shooters take bad shots, no matter how reliable they usually are. Introduce the word variation, which means the outcome might be different from what is expected.
- Ask students to give a word or number that tells us about the chance of the shooter scoring.
Expect words such as likely, almost certain, probably.
Expect numbers such as three quarters (3/4), 85%, 0.8. - To simulate the next game between the Rockets and the Emeralds you are going to use standard dice (1-6).
Let’s imagine that rolling the dice is like taking a netball shot. When a Rockets player takes a shot, the numbers 1-5 are goals, and 6 is a miss. When an Emeralds player shoots the numbers 2-6 are goals, and 1 is a miss.
Write the rules on the board:- Rockets: 1, 2, 3, 4, 5 (Goal); 6 (Miss)
- Emeralds: 1 (Miss); 2, 3,4, 5, 6 (Goal)
- Ask students to discuss which team is more likely to win. You may see misconceptions such as the Regency Effect, when six is regarded as harder to get than other dice numbers due to the priority it has in board games. Expect students to justify their thinking, e.g.
- Both teams have five out of six chances to score from each shot. Their chances are the same. (Prediction based on theoretical probability for one throw)
- It is impossible to know which team will win. One team might just be luckier than the other. (Acknowledges uncertainty, albeit subjectively)
- Players might throw the dice in a way to get the numbers they want. (Addresses whether the dice outcome is random)
- Tell the students that we are going to assume that the Rockets' shooters take the same number of shots as the Emeralds' shooters. With their dice the students play a Six-shot game, that is each team has the dice rolled three times. The students look at the data to determine which team wins, or if the result is a draw. Students might use Copymaster 1 to record the results of their trials.
- Gather the class to discuss the results.
How many games ended in a draw? In a set of 25 games around seven, eight, or nine will end in draws. There is slightly less than one third chance of a draw.
What are the ways a draw might happen? (Both teams get three goals, two goals, one goal, or no goal) Collate the results (for example):
Event Rockets win Emeralds win Draw Number of games 8 10 9 Do the results match our predictions? Why? Why not?
Expect students will comment that the results were unpredictable. In probability the word random is used to describe an outcome that is uncertain. However, the number of wins for Rockets and Emeralds are close.- Move on to playing a 20-shot game and a 50-shot game. You may decide to use a digital dice simulator online to speed up the process. After each set of games collate the results.
Is a draw more likely with more shots in a game?
Is it more likely that the winning sides are more balanced with more shot games?
Students might note that the results for a small number of shots are erratic and do not appear to match the theoretical idea that both teams have the same chance of winning. This is known as short-run variability, that is, the outcomes from a short number of trials often vary from expectations. You might also discuss the difference between an outcome and an event. A win for Rockets, a win for Emeralds, and a draw are events, things that may or may not happen. Many different outcomes contribute to those events. For example, Rockets might win by their three shots all being goals with Emeralds scoring two, one, or no goals.
Session Two
- In this session we investigate a simpler situation involving chance. The purpose of this session is to look at the relationship between theoretical probability and experimental probability. Students are expected to create a model of all the outcomes and use that model to predict the results of a simulation.
- Introduce the problem:
A couple I know are expecting their first baby (pepe). They are not worried about which gender the baby (pepe) is, but secretly I think they want a girl.
What are their chances of getting a girl baby (pepe)? - Students might think that the probability is 50% or they might call on personal experience that one gender is more likely than the other. Research online with the question “What is the probability of having a female baby?” There is a slight imbalance towards having a male baby. The actual probabilities are 51% male to 49% female.
- Let’s assume that the chances are 50:50.
Does anyone in the class come from a family that has two children?
What are the genders of the children in your family, starting with the first born?
Record the data you get from students.
MF FF MM FM MF MM FM FF FF MM MF
If there are not many families with two children, open the data up to other families that your students know about. - Discuss the limitations of the data you have collected. This dataset only includes a few families.
Looking at these data, what are the chances of getting two female babies in a two-child family? - Express the ‘experimental data’ as fractions, e.g. Probability of two males = 3/10 or 30%, Probability of two males = 2/10 or 20%, etc.
How reliable do you think these data are?
Students might mention issues like a small sample size, and that the sample is drawn only from our families. - Tell the students that they are going to investigate having lots of two-child families.
- Go to Spinner and create a spinner like the one below. Red represents female and blue represents male (or whatever colours you choose). A single spin simulates a single birth, two spins simulates a two-child family. In this case the outcome was FM so the event was a mixed gender pair.
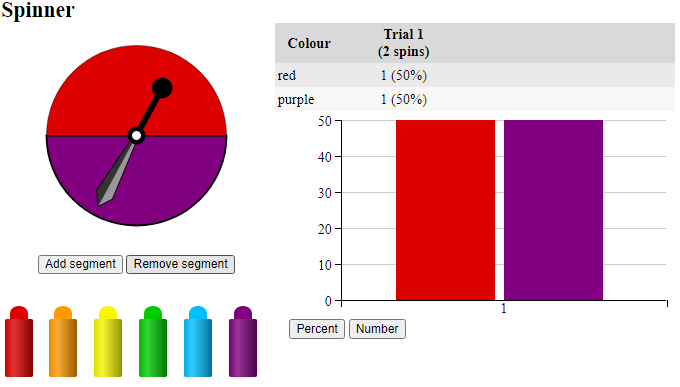
Show your students how to reset the spinner each time (Clear results) before creating the next family. Ask them to work in pairs and represent their results using a tally chart.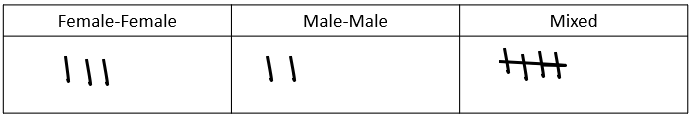
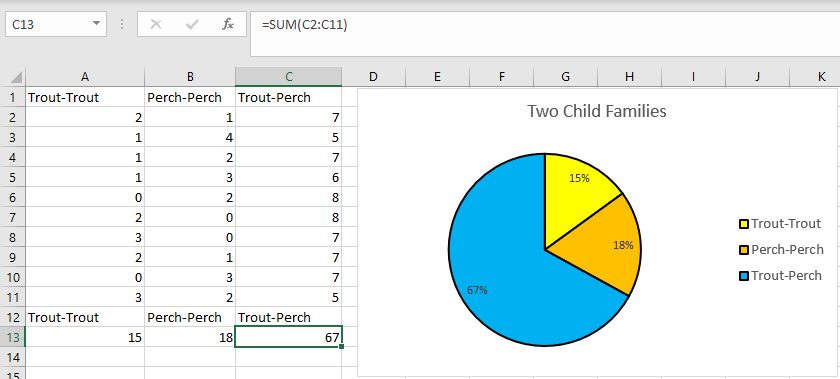
If you prefer you could use two coins to carry out the simulation instead of the spinner (assign a gender to each side of the coin and record the results of flipping). - Use a spreadsheet to collate the class results and create a pie chart of the data.
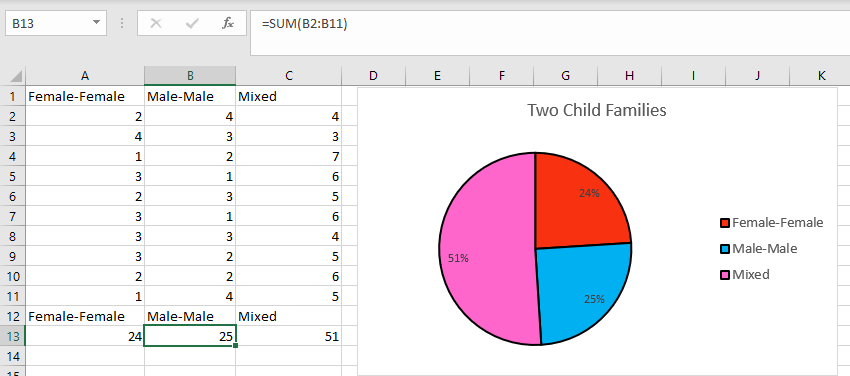
What do you notice? (Same gender families are about 1/4 each and the mixed family is about 1/2)
Why do these events have different likelihoods/chances?
Students may explain that there is only one way to get MM, one way to get FF, but two ways to get a mix, MF and FM. - Explicitly model how to create a tree diagram of all the possible outcomes (See Slide One of PowerPoint 1 which is animated on mouse clicks). Ask your students to draw the tree diagram as you work through it.
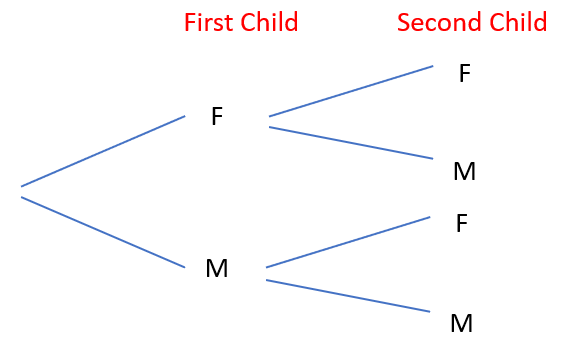
Which outcomes give a mixed two-child family? Circle those outcomes.
Which outcome is a Male-Male family? Circle that outcome.
Which outcome is a Female-Female family? Circle that outcome.
Note that two outcomes out of four give a mix of male and female (MF and FM). 2/4 is equivalent to ½ and 50%. - Introduce the next challenge using Slide Two of PowerPoint 1. Read the task as a class then let students work on it in pairs.
What mixes of female and male children are possible in a three-child family?
Use the spinner (or coins) to simulate having three-child families, at least 24 times.
Record your results.
Which events happen most frequently?
Which events happen least frequently?
Create a tree diagram to explain your results. - Roam the room looking for the following:
- Do your students organise their data using a tally chart?
- Do they notice differences in frequency?
- Do they try to explain why some events are more likely than others?
- Do they construct a tree diagram and calculate probabilities for each gender mix?
- After a suitable period of investigation, gather the class. Slide Three builds the tree diagram for a three-child family. Students might extend the tree diagram they built for the two-child family if they have not already done so.
What is the probability that all the children will be female? (1/8 or 12.5%)
What is the probability that all the children will be male? (1/8 or 12.5%)
What is the probability of a two-female and one-male family? (3/8 or 37.5%)
Where do these two-female and one-male outcomes appear in the tree diagram?
How many possible outcomes result in the event of a two-female and one-male family? (Three: MFF, FMF, FFM)
Why is the probability of a two-male and one-female family the same, 3/8? - For assessment purposes ask students to solve the following problem independently.
Jacob tosses two coins. Each coin has a heads side and a tales side.
“There are three possible outcomes, two heads, two tails, or head and tails,” he says.
What does Jacob think is the probability of getting two heads?
Is he correct? Explain.
Do students notice that the situation is the same as the two-child family scenario?
Session Three
In this session students explore the implications of independent and dependent events.
- Begin by discussing what students already know about fishing:
Who likes fish? Who likes fishing?
What species of fish/ika moana can we catch in Aotearoa?
Which species are found in fresh water?
Students might suggest species like trout (brown, rainbow), eel, bullies, etc. Most species in New Zealand lakes are introduced, usually as game fish. This learning could be linked to fish or animals that are significant to your local area, or to learning about pests or native animals (e.g. mudfish). - Explain that scientists sample fish in our waterways to keep track of numbers and species. That is one way to make sure our sea, lakes, and rivers are not overfished. Consider if there are any experts in your local community that could come and talk to your class about overfishing and sampling (e.g. from NIWA).
You might play a short video about freshwater fish. Forest and Bird has some interesting examples. - Show students Copymaster 2 that shows pictures of two introduced species, rainbow trout and perch. Both species are common in New Zealand lakes and rivers.
Imagine a tiny lake that has only four fish, two trout and two perch. - Cut out two of each card, fold the cards into quarters so the image is obscured, and put the cards into a paper bag, box, or container (a blue icecream container is ideal).
A scientist catches two fish out of the lake, one after the other. The second fish bites so quickly there is no time to return the first one.
What species might the two fish be? - Let students discuss the question. Expect them to say that the situation is like two-child families. But is it?
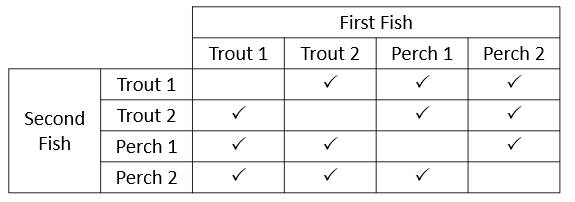
- Students should say that three different events are possible:
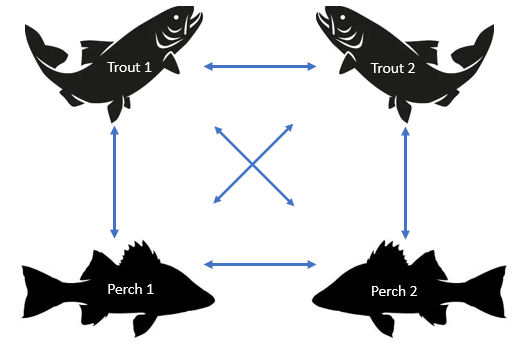
Two Trout (T1 and T2) Two Perch (P1 and P2)
Trout-Perch (Note that four outcomes can result in this event, T1 and P1, T1 and P2, T2 and P1, and T2 and P2) - Ask: What is the probability of each event?
Students may mimic the probabilities from two-child families (1/4, 1/4 and 1/2). - Explain that you are going to test out the situation with a simulation:
- Put two cards of each fish in a bag and randomly select two fish. Make sure the cards are folded in quarters so the draw is random.
- Record your results using a tally chart.
- Replace the two cards, shake the bag, and do it all again.
- Ask each pair of students to take ten samples of two fish.
- Collate the data using a spreadsheet and create a pie chart.
Are the results what we expected?
Students should note that the proportions are a long way off 1/4, 1/4 and 1/2.
Have we got enough data? Do we need to trial the fish catching again?
100 trials represent a reasonable sample size.
Think about the situation. Can you create a model to explain these results? Discuss the model with your partner. Record your thinking. - Let students work on the problem for a suitable period then gather the class and share students’ ideas. Various models usually emerge, such as:
- Tree Diagram
- Network
- Table
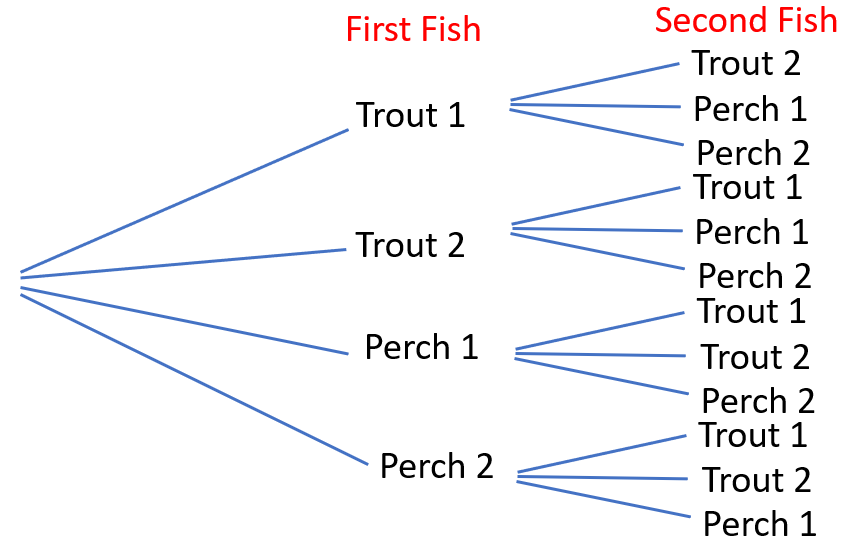
- Tree Diagram
- Be aware of the tendency of some students to regard selection of a trout (or a perch) as a single outcome. There are two fish available so selection of a single trout (or a perch) on the first catch can occur in two ways. Notice that the tree diagram and table include the same combination of two fish twice. The actual number of possible outcomes is twelve if order matters (permutations), and six if order is regarded as unimportant (combinations)
- Whatever representation students select, draw their attention to the set of all possible outcomes.
How many of those outcomes result in a trout and perch combination? (8 out of 12 or 4 out of 6)
Can we express the probability of a mix, as a number? (2/3 or about 67%)
What are the probabilities of two trout and two perch being caught? (1/6 each)
What do the probabilities add up to? (2/3 + 1/6 + 1/6 =1 or 100%)
How is this situation different from the two-child family situation? - Draw out the idea that the outcomes for the second fish are affected by which fish is caught first. In probability we say that the outcomes are dependent, one is affected by the other.
- Pose the following investigation:
Try changing the fish in the lake using Copymaster 2.
Create different mixes of trout and perch in the lake.
What mix gives a probability of ½ that the two fish caught are the same?
What mix gives a probability of 4/10 that the two fish caught are the same?
Try different mixes and work out the probabilities. - Look for students to:
- Investigate different mixes of trout and perch.
- Create models for all the possible outcomes.
- Work out the probabilities of the events (Two trout, two perch, trout and perch).
- Recognise the probability of getting the same fish combination. increased if the fraction of one species in the lake is increased, e.g. T1, T2, T3, P1 and P2 gives a 4/10 chance that the two fish are the same.
Session Four
In this session, students explore a situation in which the probability of each outcome is not equal. To solve the problem, students need to adjust their method of finding all the possible outcomes to balance the different likelihoods.
- Begin with the scenario on Slides One and Two of PowerPoint 2.
What fraction of the time are the lights on each colour?
1/2 on red, 1/3 on green, and 1/6 on orange. - Progress to Slide Three.
How might we simulate Luciana travelling through two sets of traffic lights?
Students might suggest creating a spinner and spinning twice. There are other ways to simulate traffic lights, such as using a standard dice:
1-3 represents a ‘stop’ signal, 4-5 represents a ‘go’ signal, and 6 represents a ‘lights changing’ signal.
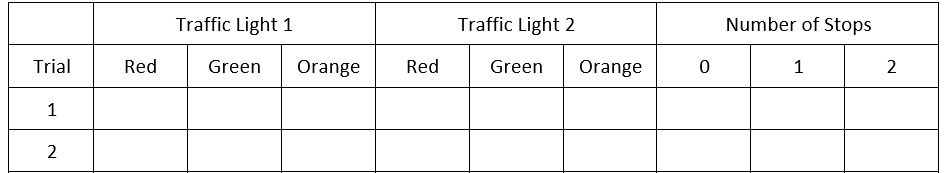
Talk about how you will organise the data you get from your simulation trials. - Let students discuss data collation in pairs. Most students will suggest a table or tally chart. You might decide on a data collection table similar to this (Copymaster 3):
- Model setting up the traffic light spinner using a Spinner. Note that Orange is regarded as a stop because that is what the law expects.
What events might occur when Luciana goes through two sets of lights?
(Apart from saying she might have a crash, students might suggest that she stops zero, one or two times)
Which event do you think is most likely? Why?
Given that Luciana must stop 4/6 or 2/3 of the time at a given set of lights, students should forecast that there will be a lot of stopping. - Provide one recording sheet between two students, and ask your students to carry out 16 trials. Collate the results using a spreadsheet.
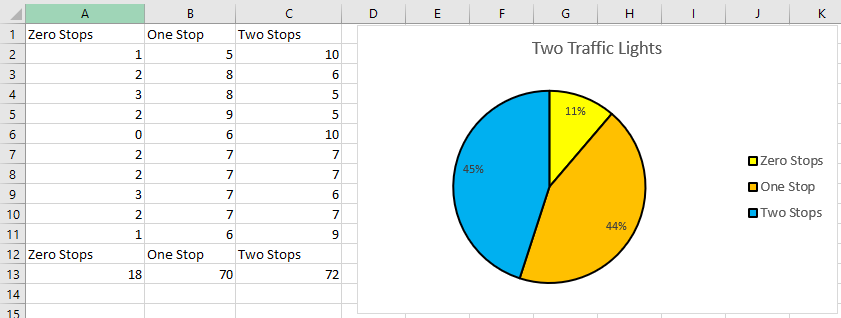
What do you notice?
(The fractions for two stops and one stop are similar. Theoretically both probabilities are the same at p = 4/9.)
Luciana gets through both sets of lights only 11% of the time. What fraction is that? (11/100 or about 1/9) - Discuss: Why do these probabilities happen?
Expect students to conjecture that there is more chance of having to stop at a set of lights, so both options, stopping once, or twice, are more common. - Present this table to the students (Slide Four of PowerPoint 2):
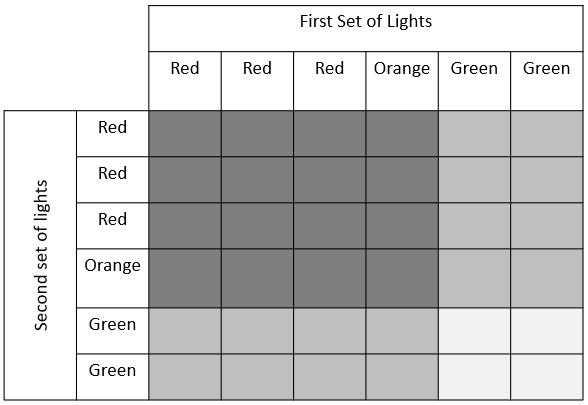
What does this table show?
What does the different shading of areas represent? (Dark grey is the ‘stop at both lights’ area, mid-grey is the ‘stop at one light’ area, and light grey is the ‘no stop’ area)
Which area is the greatest? (Dark and mid-grey have the same area, 16/36)
What do the areas tell you about the chances of stopping? - If students have difficulty interpreting the areas, use Slide Five that shows the much simpler situation of two child families. Students should recall that there was a 1/2 chance of a mixed gender family, and 1/4 chances of both children being of the same gender. Prior experience will support students to recognise that areas can represent the probabilities.
- Introduce the problem on Slide Six of PowerPoint 2. Ask students to work on the task in pairs. Roam the room. Look for:
- Do your students recognise the fractions for probabilities? (1/2 orange, 1/4 green, 1/4 red)
- Do your students use diagrams to work out the probabilities of no stops, one stop and two stops?
- Do they conclude that Luciana might be worse off, unless she is able to sneak through some lights on orange?
- Gather the class and discuss strategies that students used. Slide Seven shows a table of the probabilities. Areas show that Luciana has 1/16 chance of getting through both lights without stopping and 6/16 or 3/8 chance of having to stop at one light. Those fractions are smaller than the 1/9 and 16/36 or 4/9 probabilities for her previous route.
Session Five
In this lesson we conclude the unit with a game that involves probability.
- Introduce the Horse Race game (Copymaster 4) and have three students play a demonstration game for the class. The gameboard explains the rules. you will need the gameboard, two standard dice, and two counters of one colour each (their racing colour). You could adapt this game by creating a blank board from a grid. Students could be challenged to create their own version that incorporates their previous learning about native animals (e.g. mudfish).
- Put the class into groups of three and have them play five games each.
- While students are playing, roam the room. Look for the following:
- Do students notice that the distances horses need to gallop are different? For example, Horse One must travel 11 steps but horse Five only needs to travel three steps.
Does that seem fair? - Do students notice that differences of zero, one and two occur frequently but differences of three, four and five are less frequent?
- Do they notice that a difference of six is impossible?
- Do students notice that the distances horses need to gallop are different? For example, Horse One must travel 11 steps but horse Five only needs to travel three steps.
- After five games for each trio, gather the class to discuss their observations.
Which horse has the best chance of winning? Why?
Students should comment that the horses that have the furthest to go move more often and the horses with the least distance to go move least often.
Why do some horses move more often than others?
How could we find all the possible outcomes, when two dice are rolled, and we find the difference? - Invite students to work out the sample space with a partner, using whatever method they like.
Remember that we have used tree diagrams, tables, and networks before in this unit.
Are those methods useful here too? - Allow students some time to develop a theoretical model. Gather the class to share their thoughts.
Is 1 on the first dice and 5 on the second dice the same outcome as 5 on the first dice and 1 on the second dice? (No. They are different outcomes, a bit like Trout 1 and Perch 2 being different to Trout 2 and Perch 1)
How many different outcomes are there? (36 possible outcomes) - Show Slides One and Two of PowerPoint 3. The tree diagram shows how all 36 possible outcomes occur.
How many outcomes give the event of Horse Zero moving? (Six, (1,1), (2, 2), (3, 3), (4, 4), (5, 5) and (6, 6).
The table shows the differences produced from the set of outcomes.
What patterns can you see in the table? (Students might note the diagonal arrangement of cells with the same differences)
Which horse has the best chance of moving? How do you know?
Can you find the probability of Horse One moving on a single throw? (10/36 ≈ 28%) - Discuss the probability of other horses moving on a single throw.
Is the game fair? Does each horse have an equal chance of winning the race? Students might match up the probability of each horse moving on a single throw and the number of steps the horse needs to win.
Horse 0 1 2 3 4 5 6 Steps to win 6 11 9 7 5 3 2 Probability of moving on one throw 6/36 10/36 8/36 6/36 4/36 2/36 0/36 The table shows that the distances balance the probabilities well except for Horse Six that has no chance of moving.
- Develop a Horse Race game in which the dice numbers are either added or multiplied. Make the game as fair as possible for the horses.
Assessment
Evaluate students’ understanding of probability using the multiplication basic facts game called Multi-Bet. You will need two dice labelled 4, 5, 6, 7, 8, 9, counters, and a game board for each group of players. In this scenario the students are placed in the shoes of Risky Betts, the Casino owner, who has to determine the payouts for the game.
- Introduce Multi-Bet to the class:
Each player starts with ten counters (their loot!).
They place bets in the following way:
The winning number is determined by tossing the two dice and multiplying the numbers that show (e.g. 4 x 6 = 24).
If the winning number is not in those selected by a player, then the casino takes all the counters.
If the winning number is one of those chosen by some students, then the casino must pay out. How much should the Casino pay out for each type of bet?
The odds must be enticing to the players yet ensure in the long run that the casino makes a profit. - Once they have allocated odds such as 2:1, which means that $2.00 is paid out for every dollar placed, students can trial the game to see how their odds work in practice.
Note that there are twenty products on the board in total so that a bet covering four numbers has a four out of twenty (4/20 = 1/5) chance of being successful. The casino will want to offer odds of less than 5:1 if they are to make money in the long run. - As a means of assessing their progress in meeting the achievement objectives for this unit, ask the students to record the reasoning they used to decide how they allocated odds.
Some students may note that there are more ways for some numbers to occur than for others. For example, thirty-six can occur in three ways (4,9), (6,6), and (9,4), whereas forty-nine can only occur in one way (7,7). - Has the board been designed to separate numbers that have a higher chance of occurring? Could you design the board better?
- How do the varying probabilities affect the odds that the Casino should pay out?
Teachers: Provide Copymaster 5 to each child for them to take home.
Dear parents and whānau,
This week in maths we have been exploring probability in interesting ways. Probability is how we measure the likelihood of an event occurring.
Here is a problem to solve with your child.
Each time you buy a meal at Buns Burgers you get a card drawn from the Free Burger Box. The card will show the left, centre, or right side of a hamburger. When you have collected three cards that make a whole hamburger you can exchange it for the real thing!
Assuming that Buns Burgers put the same number of each card in their Free Burger Box to start with, and each time you get a card it is purely by chance (random), how many meals will you need to buy to get a free hamburger?
Enjoy investigating this probability problem with your child. You might both be surprised.