This is a level 5 statistics activity from the Figure It Out series.
A PDF of the student activity is included.
Click on the image to enlarge it. Click again to close. Download PDF (545 KB)
construct a bar graph on a computer
interpret data from a graph
evaluate a hypothesis from the data
plan an investigation
collect and display data
FIO, Level 4+, Statistics, Book Two, Walking Tall, page 8
A computer
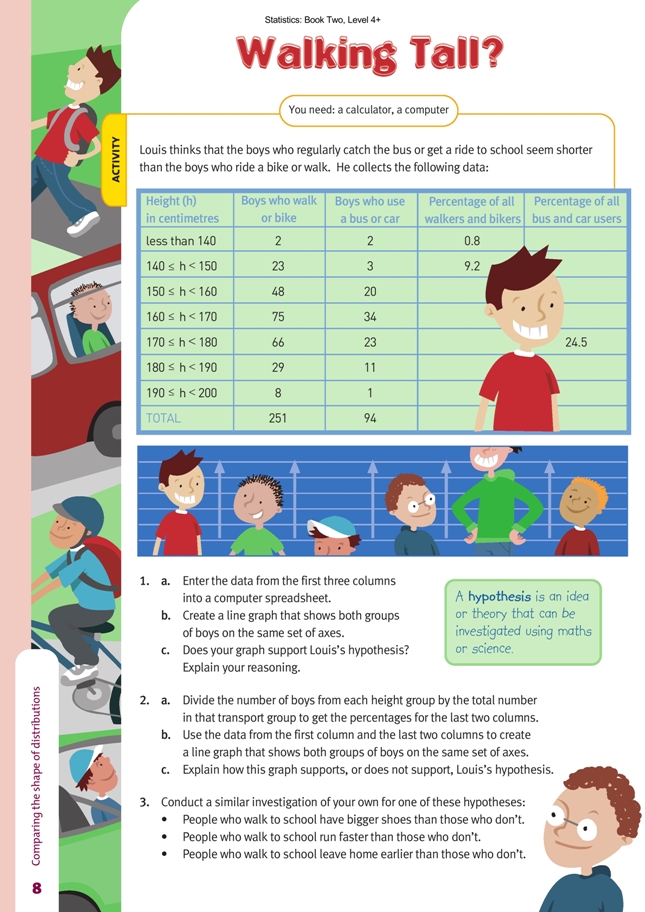
In this activity, students investigate a hypothesis by comparing data obtained from two different groups. They learn that as a general principle, when comparing data from samples of different sizes, they should use percentages rather than raw data.
When they look at the graph they have created for question 1b, your students should recognise that it is difficult to compare the two sets of data because the number of students in each group is very different. When they convert the frequencies in each interval to percentages and graph these percentages (in questions 2a–b), they can make comparisons more easily.
To do question 2, the students need to extend their spreadsheet and create a graph using columns 1, 4, and 5. Note that the values given in the students’ book have been rounded to 1 decimal place, which is fairly standard for percentages. To do this in the spreadsheet, select the cells that contain the numbers to be rounded, click on Format on the menu bar, choose Cells, then the Number tab, and finally, select “Number”
from the list of alternatives. Change the number in the small “Decimal places” window to 1.
Encourage your students to use a formula to convert the raw data to percentages. The following spreadsheet shows how this can be done using =B2/B$9*100. Note the “$” that has been inserted into the B9 cell reference. This lets the program know that the value found in cell B9 (in this case, the total number of boys who walk or bike) is a constant (that is, it remains the same in all calculations using this formula).
Use the cursor to grab the bottom right-hand corner of cell D2 and drag it down the next 7 lines. Release the mouse button, and the maths is done! Use a similar process to complete the last column.
If you want to select cells from non-adjacent columns (which can be important when graphing just part of the data in a spreadsheet), select the first group of cells you need, hold down the CTRL key (or the Apple key, if using a Macintosh) and select whatever other cells are required.
Question 3 may be the first time that your students have encountered the use of a hypothesis as the basis for a statistical investigation, so discuss the concept with them. When developing a hypothesis or framing a question, they should think about the kind of data they would need to collect in order to prove or disprove it and how they would use that data to reach a conclusion. The following is a useful framework for an
investigation.
1. Clarify the hypothesis or question. Ask: What is the investigation really about? Can I break it into steps?
What information do I already have, and what further information do I need?
2. Devise a strategy for the investigation. Ask: Where can I find the data I need? How will I gather it? What resources or equipment do I need?
3. Carry out the plan. Collect data, make calculations, and create suitable graphs.
4. Draw conclusions. Analyse the calculations and graphs, outline the findings, and give an answer or conclusion to the investigation.
5. Report back. This can be done in verbal or written form and may include tables, charts, and displays.
6. Evaluate by asking: Have I investigated the problem as thoroughly as I could? What problems did I encounter, and how did I overcome them? What would I do differently next time?
Answers to Activity
1. a. Practical activity
b.
c. No. Both lines rise and fall at the same points, so the two distributions are very similar. The walk and bike line goes higher than the bus and car line only because there are more students in this group.
2. a.
b.
c. Answers will vary but may include these points:
• There is a very similar percentage of tall boys in both groups.
• A slightly smaller percentage of the boys who are 170 cm or taller get a ride to school.
• Of the short boys (those less than 160 cm), a slightly higher percentage is in the group that walks or bikes.
• The sample is probably too small to prove much.
3. Investigations and results will vary.