This is a level (3+ to 4+) mathematics in science contexts activity from the Figure It Out series.
A PDF of the student activity is included.
Click on the image to enlarge it. Click again to close. Download PDF (1055 KB)
Students will:
- convert between watts (W) and joules (J)
- measure and record category data for 2 variables (the dependent variable is boiling time; the independent variable is volume of water)
- calculate energy consumption of appliances based on usage time estimates.
Students should discover that:
- small changes in usage patterns can have a big impact on energy consumption.
a cup
a computer spreadsheet or a calculator and graph paper
water
an electric jug
the wattage table for Activity Three (see copymaster)
a classmate
FIO, Energy, Levels 3+-4+, Using Electricity, pages 22 - 24
Preparation and points to note
This activity brings together themes from previous activities in the book: food energy* values, unit
conversions, relationships and trends in experimental data, rates, energy usage, and energy conservation. Make sure the students have had some exposure to joules as a measure of energy prior to starting the activity, and as they work, link ideas back to the related ideas in Tramping against Gravity, Wind Power, and Food Energy.
Boiling water and using electrical appliances near water is dangerous. While a jug is a common kitchen appliance, not all students will understand the potential hazards, particularly the risk of scalding by steam. Set very clear rules concerning how the jug(s) should be used. Make sure that no one lifts the lid while the jug is boiling or immediately after it has been switched off. Check that the jugs you use are in good order and that the cords are not frayed in any way. Also check whether the jug has an exposed heating coil. If it does have a coil, it is very important that the students don’t attempt to boil very small amounts of water that won’t completely cover the coil.
Much of the science language and concepts in this activity will be relatively new to students: exposure to a rich range of language strengthens the key competency of using languages, symbols, and texts.
Points of Entry: Mathematics
These activities look at energy usage in three different ways: converting between different measures of energy, measuring the energy use of an electric jug, and estimating the relative energy usage of different appliances. (A useful New Zealand website is www.pmb.co.nz/power_usage.htm
An American one is www.energysavers.gov/your_home/appliances/index.cfm/mytopic=10040)
Activity One requires the students to think carefully about different units and to use a known equivalence (see the energy character’s speech box) such as 1 kWh = 3 600 kJ as a “bridge” between them. For example, in question 1, the students need to be able to say “1 kilowatt-hour equals 3 600 kilojoules, so 5 kilowatt-hours must equal 5 times that number of kilojoules. That’s 5 x 3 600 = 18 000 kilojoules.”
Similarly, for question 2, the students need to use as the “bridge” the information that joules (J) = watts (W) x time in seconds. 2 hours is 2 x 60 x 60 = 7 200 seconds. So the 60 W bulb uses 60 x 7 200 = 432 000 J.
Check that the students can relate the different units to real life. For example, an electricity bill is a measure of how much power has been used over a set period of time because appliances continue to draw power every second they are used. When talking about energy from food, we do not factor in time because it doesn’t matter how quickly or slowly we eat an apple, we get exactly the same number of joules from it.
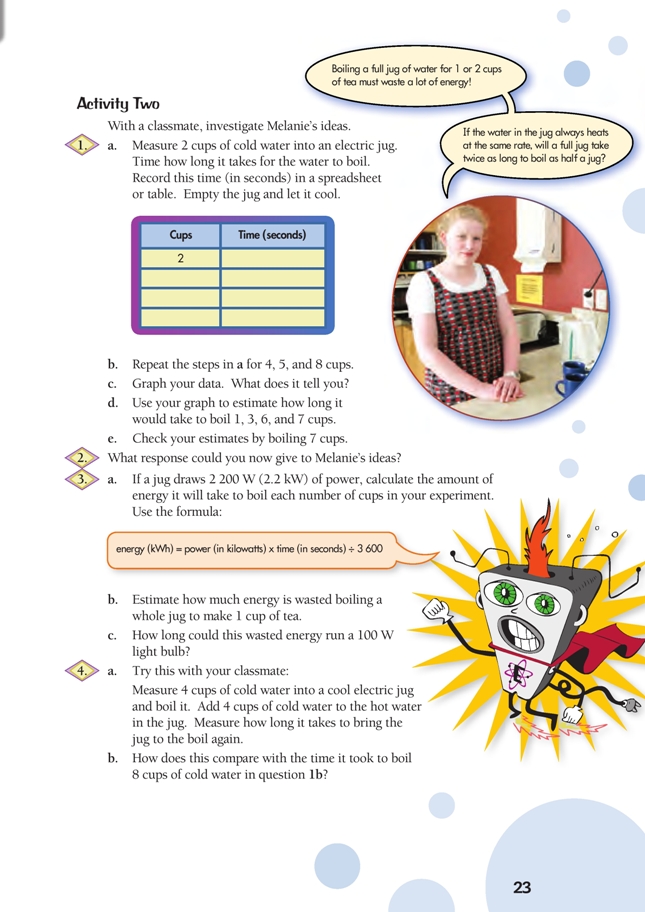
Activity Two involves boiling water in an electric jug. Make sure that the students focus on the trend instead of the individual data values. Jugs vary in size, shape, capacity, and power. So do household cups. It doesn’t matter what the capacities of the jug and cup are as long as each group uses the same jug and cup throughout the experiment. Different groups can use different equipment. If they do, results will vary but the trend should be very similar.
If your students have done other experiments in this book, they should be capable of identifying the
variables in this one: independent (those that we change), dependent (those that change as a result of our changes), and controlled (those that we deliberately keep the same). Remind them that, when graphing, the independent variable (cups of water) goes on the x-axis and the dependent variable (time) on the y-axis. If they enter their data in a spreadsheet, they can very easily produce a scatter plot similar to the one shown in the answers. To add a trend line, they should go Chart/Add Trendline. Alternatively, they could create a line graph.
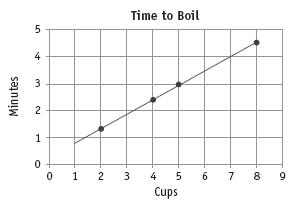
Discuss the shape of the graph and why it has that shape, especially in the context of question 2. The shape should approximate to a straight line. In other words, there is a linear relationship between amount of water and boiling time. This should not be surprising. Every cup of water requires exactly the same amount of energy to take it from tap temperature to boiling. So 2 cups require twice the energy of 1 cup. Interestingly, the graph in the answers shows that the first cup took a little longer than the other cups (the trend line does not go through [0,0]) to reach boiling point. The likely reason is that the metal jug absorbed some of the energy that would otherwise have gone into the water.
As with any statistical investigation, reinforce the elements of the statistical enquiry cycle: problem, plan, data, analysis, conclusion. Prompt the students to think about why they are asked to start each time with cold water (controlled trials).
For Activity Three, caution the students not to underestimate their energy use. And, as with any activity involving estimation, remind them that an estimate is different from a guess. The table provided includes a range of appliances for both summer and winter, and not all the items will apply to all students. The figures given are approximate only but are sufficient for the students to use for their estimates.
For information on fridge energy use, see
http://oee.nrcan.gc.ca/residential/business/manufacturers/search/refrigerator-search.cfm.
According to the Energy Efficiency and Conservation Authority (EECA.govt.nz), New Zealand households consumed 63 500 terajoules of energy in 2007, which averages to about 40 million kJ or 11 000 kWh per household per year. A typical student’s consumption is therefore likely to be in the order of 30–40 kWh per week. See www.physics.otago.ac.nz/eman/hew/ehome/energyuse.html for more detailed information.
Points of Entry: Science
Activity One is designed to encourage the students to discuss the units of electrical energy and what they actually mean in everyday language and contexts. The class could find out what the school power bill was for the previous month and how the school usage in summer compares with that in winter. The students could interview the principal about power saving ideas in the school. They could then design a power-saving campaign and monitor the school’s power usage over a month. Some electricity suppliers produce usage graphs for the previous 3 months. Such graphs are a further potentially useful source of data.
Activity Two raises an important experimental issue: how can you judge exactly when the water starts boiling – especially when the lid is on the jug (as it must be). Make sure that the students agree what will signal when the water reaches boiling point and it’s time to stop the timer. A good signal is the automatic cut-off switch on the kettle. When the light or switch trips, stop the timer. However, if the jug being used doesn’t have a prompt or sensitive cut off (that is, continues boiling even after the water reaches boiling point), you could do a class experiment to establish the boiling point. Depending on the jug, the students are likely to fi nd that sound is their best clue. In many jugs, as the water nears boiling point, the noise quietens and turns to a low growl and the splashing of bubbling water can be heard.
Ask the students to think about what happens when a liquid boils. Is this a physical or chemical change? The students should understand that each liquid has its own particular boiling point and that when it boils, it changes from a liquid to a gaseous state. To do this, the molecules need to gain energy, which is provided in the form of heat. Scientists view temperature as a measure of the average internal energy of a system. It takes more energy to boil a saucepan of water than a cup of water.
Possible misconceptions that you may want to clarify with your students:
- All electrical appliances use the same amount of power.
- Silver jugs heat up faster than plastic ones because they are made of metal, which is a better conductor.
- Water boils when the jug clicks off (some automatic cut-off switches are not sensitive, and the water may continue boiling after it has reached boiling point).
Given that warm or hot water in a jug boils more rapidly than cold, you could ask your students to think about whether it is a good idea to fi ll the jug from the hot tap. (It isn’t. In most homes, hot water has to travel some distance from the cylinder or the on-demand unit. 3 m of standard 20 mm diameter water pipe contains nearly 1 L of water. So, if the source of the water is 6 m from the kitchen, you have to fill the pipe with nearly 2 L of hot water before any reaches you at the tap. So, to boil 1 L from the hot tap, you had to heat 3 L in the tank. But you still need to use further energy to heat the hot water in the jug to boiling point – for possibly 1 cup of boiling water!
Activity Three invites students to look at energy use in the home. Find out what they already know: Do you know how much your family spends on electricity? Parents or caregivers may be able to show them a recent power account. Ask Do you have any idea which of your activities contribute most to household electricity use? Electrical energy is versatile, clean, efficient, and can be moved from place to place with relative ease, but on the whole, we are incredibly wasteful of it as a resource. Encourage your students to investigate this issue in more detail. They have a lot of information at their fingertips at home. Almost all electrical appliances have the power consumption (in watts or kilowatts) marked on them, and anyone can read the electricity meters on the switchboard. You could challenge the students to investigate or monitor some aspect of their household power usage for a period of time and then report back to the class as a whole.
Students can investigate further on age-appropriate websites such as:
www.sustainability.govt.nz
www.energywise.govt.nz
http://tonto.eia.doe.gov/kids/index.cfm
www.eere.energy.gov/kids
www.epa.gov/students
Answers
Activity One
1. 18 000 kJ. (1 kWh is 3 600 kJ, so 5 kWh is 5 x 3 600 = 18 000 kJ)
2. 432 000 J (432 kJ). (60 x 3 600 x 2 = 432 000)
3. a. 0.042 kWh. (150 kJ ÷ 3 600 kJ = 0.042 kWh)
b. 25 min. (A 100 W bulb uses 100 J each second (s) or 1 000 J [1 kJ] every 10 s. This equates to 150 kJ in 1 500 s or 1500 ÷ 60 = 25 min.)
4. Electricity bills are in kilowatt-hours (also called units) instead of joules because a joule (and even
a kilojoule) is a very small amount of energy. The average New Zealand household uses about
900 kWh of electricity per month, which is 3 240 000 000 J, or 3 240 000 kJ. Imagine finding numbers like these on the monthly power bill!
Activity Two
1. a.–e. Practical activity and graph. The following graph is actual data from an experiment using a 2200 W jug. The graph shows that boiling time is linear: for every extra cup of water that you put in the jug, you have to add about the same amount of time.
2. Boiling a full jug for 1 or 2 cups definitely wastes energy because you are heating water that you
don’t need. And it is true that a full jug takes about twice as long to boil as half a jug.
3. a. Answers will vary, depending on the results of your experiment. Here is the energy usage for the data in the graph:
| Cups | Seconds | 2.2 kWh x seconds ÷ 3 600 |
| 2 | 80 | 0.05 |
| 4 | 153 | 0.09 |
| 5 | 178 | 0.11 |
| 8 | 280 | 0.17 |
b. Answers will vary. The jug used to obtain the data in the graph took 0.17 kWh of power to boil 8 cups (a full jug) and just 0.03 kWh to boil 1 cup. This means 0.14 kWh (0.17 – 0.03) was wasted.
c. Answers will vary. Using the data from the graph above, 0.14 kWh is wasted. 0.14 kWh is 140 W. This is enough power to run a 100 W bulb for 1.4 hours (1 hour 24 minutes).
4. a.–b. Practical activity. Answers will vary, but you should find that the warm (half-hot, half-cold) water boils much faster than 8 cups of cold water. In fact, it shouldn’t take much more time to boil 4 hot + 4 cold than 4 cold. The hot water has already received a lot of energy and doesn’t require much more to bring it to the boil again. So it’s more efficient to reboil a jug containing warm
water than to empty it and use fresh cold water.
Activity Three
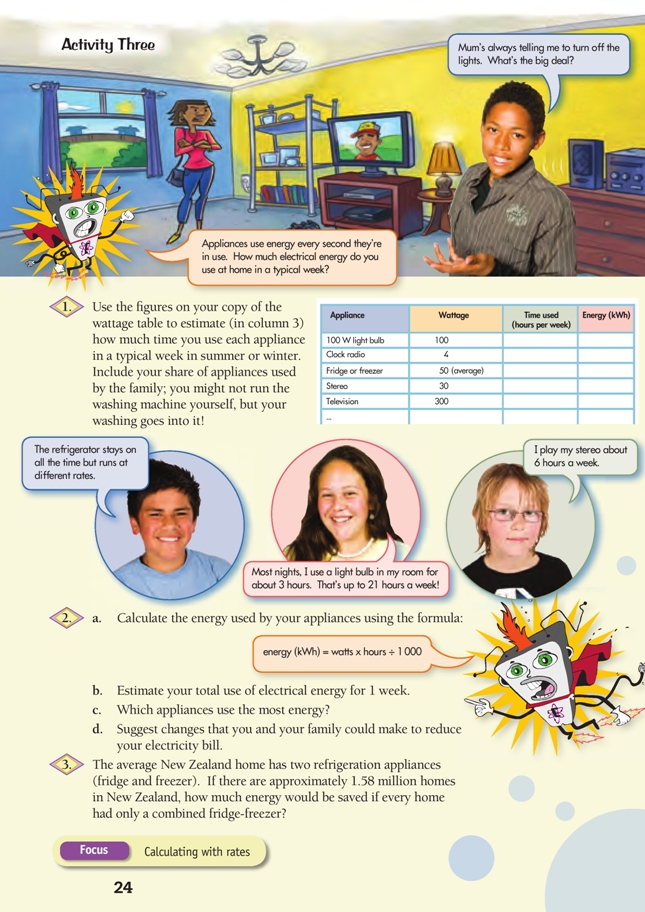
1. Tables will vary. Here is a sample set for some data, including their energy use for question 2a:
| Appliance | Wattage | Time used (hours per week) | Energy (kWh) |
| 100 W light bulb | 100 | 30 | 3 |
| Clock radio | 4 | 168 | 0.67 |
| Fridge or freezer | 50 (average)* | 1/4 of 24 x 7 = 84 | 2.1 |
| Stereo | 30 | 6 | 0.18 |
| Television | 300 | 6 | 1.8 |
| Hot-water heater | 5 500 | 1/2 hour shower x 7 = 3.5 | 19.25 |
2. a.–c. Answers and suggestions will vary. For the sample data above, weekly estimated energy
use is 27 kWh; the hot-water heater used by far the most energy. A lot depends on patterns of use and the particular appliance. For example, if you spend a long time looking into the fridge with the door open but take only quick, warmish showers, fridge energy use will be higher and water-heating
energy use lower.
* Note that the energy use of fridges and freezers fluctuates dramatically within a 24 hour period. These appliances have compressors that cycle on and off at intervals (you can hear them “kick in” shortly after you have had the door open) to maintain the required degree of cold (see the answer to
question 3).
d. Suggestions will vary. Possibilities could include: having showers rather than baths; reducing shower time (in many homes, this is the single greatest use of electricity); only boiling approximately the amount of water in the jug that you need (but covering the element!); putting on warmer clothes instead of switching on a heater; not using hot water when cold will do (including for washing
clothes); not using an air conditioner unnecessarily; setting the thermostat of a heat pump a little lower; not leaving lights on in unoccupied parts of the house; using energysaving bulbs in light fittings; and drying clothes on the line or on a clothes rack instead of in the dryer.
3. Estimates will vary. A suggested estimate is 700 million kWh.
The compressor in a modern fridge is typically rated 250–600 W, but it only runs at this rate intermittently. When the compressor is silent, a fridge uses a very small amount of electricitiy, typically 3–5 W. For this reason, the table provided suggests 50 W (0.05 kW) as an average rating. If a fridge is using 0.5 kW for 8 736 (24 x 7 x 52) hours per year, it will consume 437 kWh of electricity.
Using this figure, getting rid of the second appliance would save about 437 kWh per household per year. If there are 1.58 households, this equates to 437 x 1 580 000 = 690 460 000. As this figure is based on very rough data, a suggested estimate would be 700 million kWh.