This is a level 4 statistics activity from the Figure It Out series.
A PDF of the student activity is included.
Click on the image to enlarge it. Click again to close. Download PDF (621 KB)
describe a probability using fractions
Coins or Counters
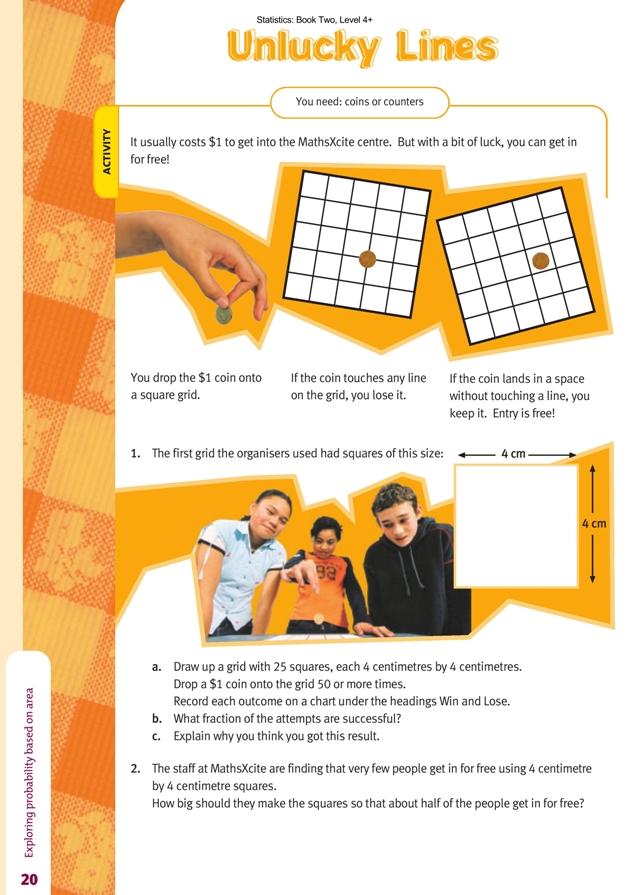
In this activity, students find an experimental estimate of the probability of a coin landing between the lines on a grid and then try and discover the theoretical basis for their results. As always with practical experiments involving probability, they should realise the importance of obtaining a large number of results (the larger the better).
Collating results from a number of students is a good way of getting a large body of results in a short space of time.
Students’ explanations for the results of this experiment (question 1c) will vary according to their level of mathematical understanding. They will need good reasoning skills to justify their explanations mathematically. A full explanation is given in the Answers.
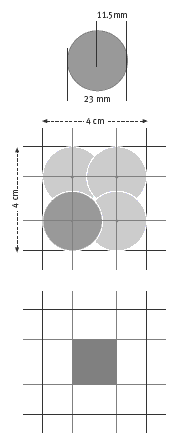
The students will probably want to use a trial-and-improvement approach to question 2. Starting in this way, they will soon realise that the mathematical solution is related to the area that can be occupied by a winning coin compared with the total area of each square in the grid. Once they realise that the winning area is defined by the locus of the centre of the coin, the question becomes a measurement problem as much as a
probability one. (See the diagram in the Answers.)
For your reference, this table shows how the probability changes as the size of the grid increases: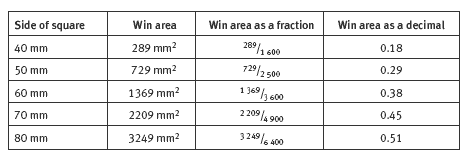
Note that, although the concept of locus is not mentioned in the achievement objectives, it is included as a suggested learning experience for Geometry, level 4.
Answers to Activities
1. a. Practical activity
b. Answers will vary, but it is likely that about 1/5 (0.2) of all attempts are successful.
c. The diameter of a $1 coin is 23 mm, so its centre is 11.5 mm (half of 23 mm) from its edge. This means that the centre of the coin can never be closer than 11.5 mm from the edge of the square, or it will touch. So no matter what size the squares of the grid are, there is always a “lose” area 11.5 mm wide along each side and a square “win” area is left in the middle. The diagram shows how this works for a grid with 4 cm squares:
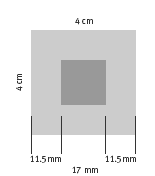
The total area of a 4 cm by 4 cm square is 40 x 40 = 1 600 mm2. Of this, only the 17 mm by 17 mm grey square in the middle is the “win” area. 17 x 17 = 289 mm2.
This means that the chances of the centre of the coin landing on the winning area are:
289/1 600 = 0.18, or 18%.
2. 80 mm x 80 mm, or very close to this. (78.5 mm, correct to the nearest 0.1 mm, will give a probability of 0.5.)