This is a level (3+ to 4+) mathematics in science contexts activity from the Figure It Out series.
A PDF of the student activity is included.
Click on the image to enlarge it. Click again to close. Download PDF (982 KB)
Students will:
- read elevation values off a contour map and a line graph
- calculate potential energy
- sketch a graph of potential energy.
Students should discover that:
- there is a relationship between potential energy, mass, and height gained
- a graph of potential energy looks the same as a graph of elevation, with a scale factor of about 10 x mass.
FIO, Energy, Levels 3+-4+, Tramping Against Gravity, pages 14 - 15
Henry's potential energy graph (see copymaster)
Preparation and points to note
Be careful not to confuse mass* and weight. Although weight is often used in everyday conversation to mean mass, mass and weight have specific and very different meanings. Mass is a measure of how much matter is in an object. Weight is the force of gravity acting on mass (in other words, a measure of how hard gravity is pulling on an object). Imagine taking a 1 kg object to the Moon. The object will have exactly the same mass there as here (it is the same object, after all), but because gravity on the Moon is about 1/6 of Earth’s gravity, it will weigh about 1/6 as much. For more information, see the teacher support material for Figure It Out, Forces, levels 2+–3+.
The activity provides an opportunity to focus on the key competency using languages, symbols, and texts because it encourages students to build new knowledge, find ways to describe their thinking, and use tables and graphs to display their findings.
Points of entry: Mathematics
In this activity, students interpret a map and a line graph, calculate gravitational potential energy using the equation E = 10 mh, for different masses and heights, and use the results to sketch a graph of potential energy.
[Note for teachers. The equation for potential energy is E = mgh, where m is mass, g is acceleration due to gravity, and h is height. Acceleration due to gravity (g) is actually 9.8 metres per second squared (9.8 m/s2) but has been rounded to 10 to keep it simple.]
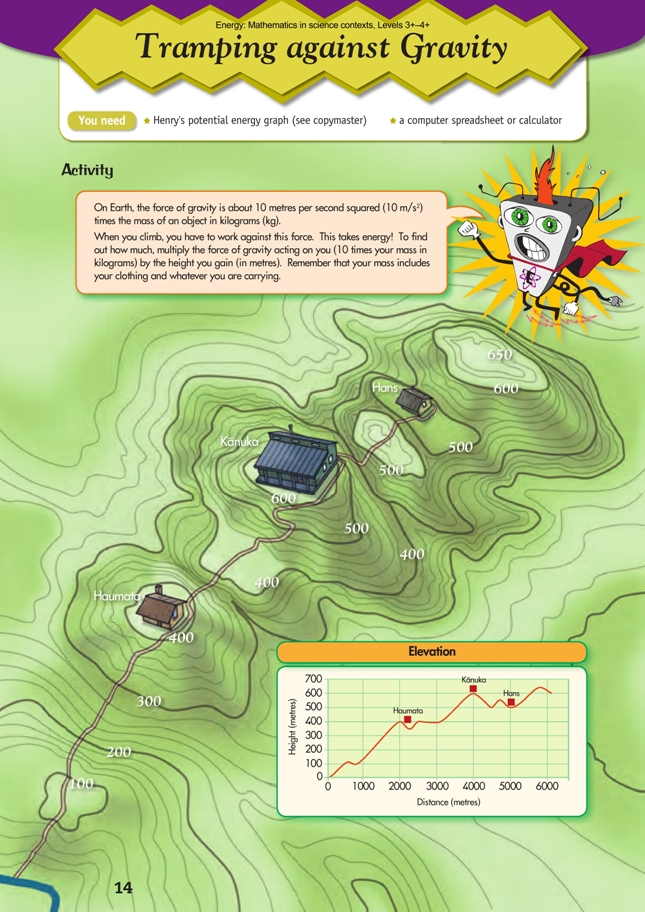
Contour maps can be difficult to interpret. Make sure that all students are able to relate the contours to elevation. “Walk” them along the track. Ask them to describe what is going on in terms of their height above sea level (elevation).
Ask the students to explain in their own words what the contour map and the line graph show and to explain how the information in the one relates to the information in the other. How does the elevation graph help you to understand how hard the tramp is? Why does the graph start at (0,0)? Why is this relevant? What do the numbers on the x and y axes refer to? As a class or in small groups, connect features on the contour map with points on the line graph, for example, the large fl at meadow at 400 m elevation between Haumata Hut and Kānuka Lodge or the small peak between Kānuka Lodge and Hans Hut.
Potential energy is always calculated from a reference point, in this case, height above sea level. If students struggle to calculate potential energy, illustrate with sample calculations. For example, at 100 m above sea level, Mukasa’s potential energy would be 10 x 77 kg x 100 m = 77 000 J, or 77 kJ.
The final part of the activity, which involves drawing a graph of potential energy, is highly conceptual. The x-axis scale is reversed from the elevation graph because the boys are tramping back down the trail to sea level. Specific data points will simplify the drawing, for example, ask the students to plot the calculated potential energy values for Henry at each hut and at the bottom. Discuss what happens at Kānuka Lodge when Henry puts on his pack (his mass increases, so his total potential energy increases.) From these few points, they should be able to see that the shape of the graph is roughly mirroring the shape of the elevation graph on the previous page.
Extension activities could include discussing the question of gradients (steepness of the climb). Ask: What is a negative gradient and where do you find one on the graph? How would you measure the gradient on the mountain? What do gradients have to do with the distance between contour lines on a map? (There is a difference in elevation of 20 m between any two contour lines. The closer the contour lines, the steeper the gradient.)
Points of entry: Science
Ask the students to think about what happens when people climb mountains. What does it feel like when climbing? Where do the trampers get their energy? Which of the three boys (in the activity) will require most energy? As they study the elevation graph, get them to discuss where the trampers will have to expend most energy. Ask: How will the terrain change as they climb higher? How might the weather, especially wind chill, affect their climb?
This activity focuses on work (the change in potential energy). Note that in this scenario, it’s only when gaining or losing height that the boys fight gravity or gain its assistance. Help the students to link the ideas of force, acceleration, mass, and energy. The acceleration due to gravity on all objects on Earth is about 10 metres per second squared (m/s2). This acceleration gives us weight, where the force of our weight (in newtons) is equal to 10 metres per second squared times our mass in kilograms. It’s this force that we fight against when we climb, which is why the energy used in climbing is 10 times our height times our mass. In equations, F = ma, where F is force, m is mass in kilograms, and a is the acceleration due to gravity (also known as g) and E = mgh or Fh, where h is height.
Answers
1. a. 400 m
b. 264 kJ. (Henry has climbed 400 m. His total mass with a pack on is 66 kg. 10 x 66 kg x 400 m = 264 000 J)
c. Rua. (All three boys climbed the same amount, and Rua [with his pack] lifted the greatest mass.)
2. a. 188 kJ. (Rua lifted a total of 94 kg: his body [65 kg], his pack [19 kg], and the 10 kg transferred from Mukasa. The height increase from Haumata Hut to Kānuka Lodge was 200 m. 10 x 94 kg x 200 m =188 000 J.)
b. 58 kJ. (Rua’s pack is now 29 kg. 10 x 29 kg x 200 m = 58 000 J.)
3. 173 kJ (descent). (Without their packs, Henry, Rua, and Mukasa have a total weight of 173 kg. They descend 100 m from Kānuka Lodge to Hans Hut. 10 x 173 kg x –100 m = –173 000 J.)
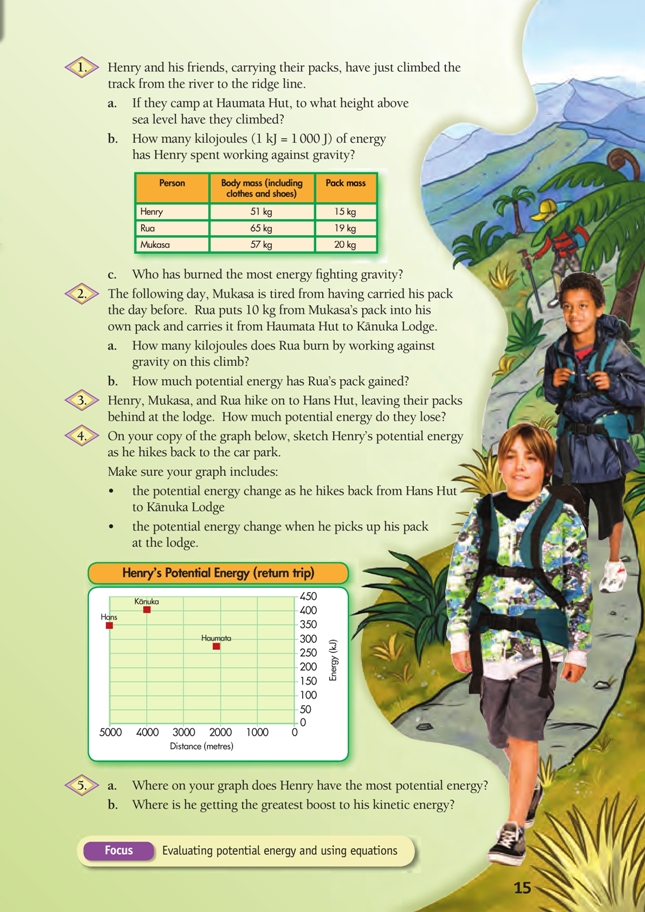
4. Your graph should be similar to this:
.jpg)
Henry’s potential energy at Hans Hut is 10 x 51 kg x 500 m = 255 kJ.
When he reaches Kānuka Lodge, his elevation has gone up by 100 m, so his potential energy has increased to 10 x 51 kg x 600 m = 306 kJ. Then he puts on his pack, increasing his potential energy
to 10 x 66 kg x 600 m = 396 kJ, as shown by the vertical increase in energy at Kànuka Lodge on the graph. As he descends, his potential energy goes down, reaching 10 x 66 kg x 400 m = 264 kJ at Haumata Hut, and 0 at sea level. Henry’s potential energy graph is similar in shape to his elevation
graph, but it is reversed along the horizontal (distance) axis because he is returning to the start of the track.
5. a. Kānuka Lodge (because that’s the point of greatest height x mass)
b. Henry gets the greatest boost when he is losing potential energy the fastest, in other words, on the steepest descent on the track (below Haumata Hut). (This is why it’s easier to run downhill.)