This is a level 2 statistics activity from the Figure It Out series.
A PDF of the student activity is included.
Click on the image to enlarge it. Click again to close. Download PDF (1250 KB)
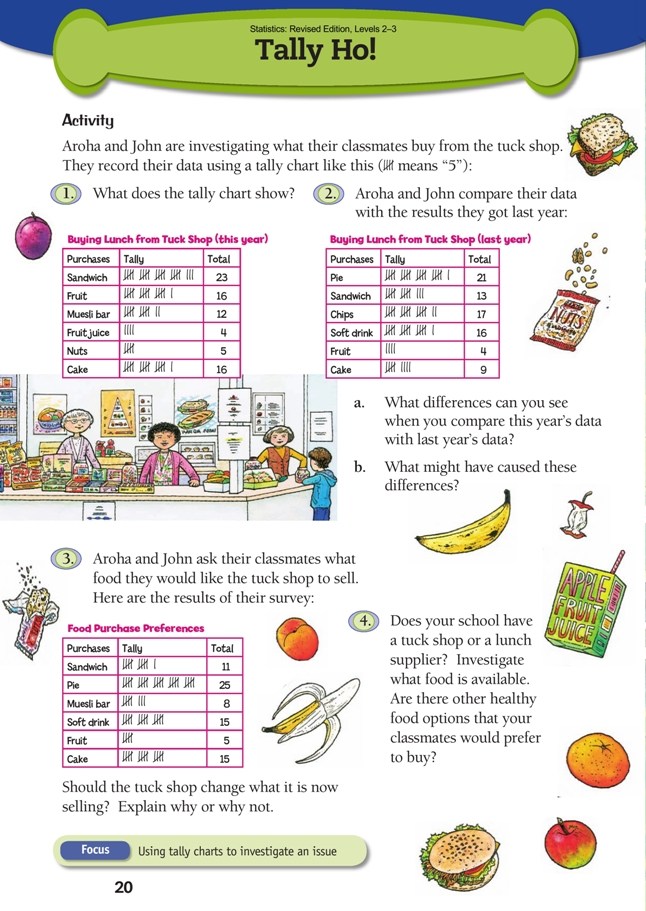
answer questions from a tally chart
compare two tally charts
This diagram shows the areas of Statistics involved in this activity.
The bottom half of the diagram represents the 5 stages of the PPDAC (Problem, Plan, Data, Analysis, Conclusion) statistics investigation cycle.
If students have not encountered tally marks, iceblock sticks provide an excellent visual model. Have the students lay down one stick for each item counted. When they get to the fifth item/count, they lay the stick across the others to make the group of 5. The convention of grouping tally marks in 5s facilitates skip-counting by 5s and 10s.
A tally chart normally sets data out in three columns: category, tally, and total (frequency).
For question 1, encourage the students to get beyond simple statements (“Four people brought fruit juice”) to statements that involve comparisons (see the Answers for suggestions).
Note also that, while students can say with validity that “sandwiches are the item most sold”, they can’t say “most of the students in our class buy sandwiches”.
Questions 2 and 3 allow plenty of scope for class discussion. The issues raised go beyond mathematics and statistics and could usefully be linked to cross-curricular studies involving food and nutrition and even economics.
Question 4 provides another opportunity for students to practise the statistical enquiry cycle.
Answers to Activity
1. Possible comments include:
• Sandwiches are the most popular item.
• Fruit and cake are equally popular.
• Fruit and cake options are the second most popular purchases.
• Few students buy nuts.
• Fruit juice is the least popular item.
2. a. Fruit was the least popular purchase last year, but it is the second most popular
purchase this year. Sandwiches were the fourth highest seller last year, but they are
the highest selling item this year. The two most popular purchases from last year (pies
and chips) do not appear in this year’s data.
b. Answers may vary. A likely explanation is that the school has been trying to promote healthier eating choices and is no longer selling pies, chips, and soft drink. Cake is not a healthy option but for some reason has been left on the menu and continues to sell well.
3. The data clearly indicates that the students would like the tuck shop to sell pies and soft drink. You could argue that pies would be a warm alternative in the winter months, or you may oppose pies and soft drink on the grounds that, even if the students want them, they are unhealthy and would tempt some people to
make non-healthy purchases.
4. Answers will vary.
Key Competencies
Tally Ho! can be used to develop these key competencies:
• thinking
• managing self
• relating to others