This is a level 3 statistics activity from the Figure It Out series.
A PDF of the student activity is included.
Click on the image to enlarge it. Click again to close. Download PDF (1798 KB)
use a table to find all possible outcomes
conduct a simple probability experiment
discuss probabilities based on experimental and theoretical results
This diagram shows the areas of Statistics involved in this activity.
The bottom half of the diagram represents the 5 stages of the PPDAC (Problem, Plan, Data, Analysis, Conclusion) statistics investigation cycle.
FIO, Level 3, Statistics Revised Edition, Superbeans, pages 20-21
A paperbag
Classmates
In these activities, students take “beans” from a bag and then compare what they get with what they expected to get.
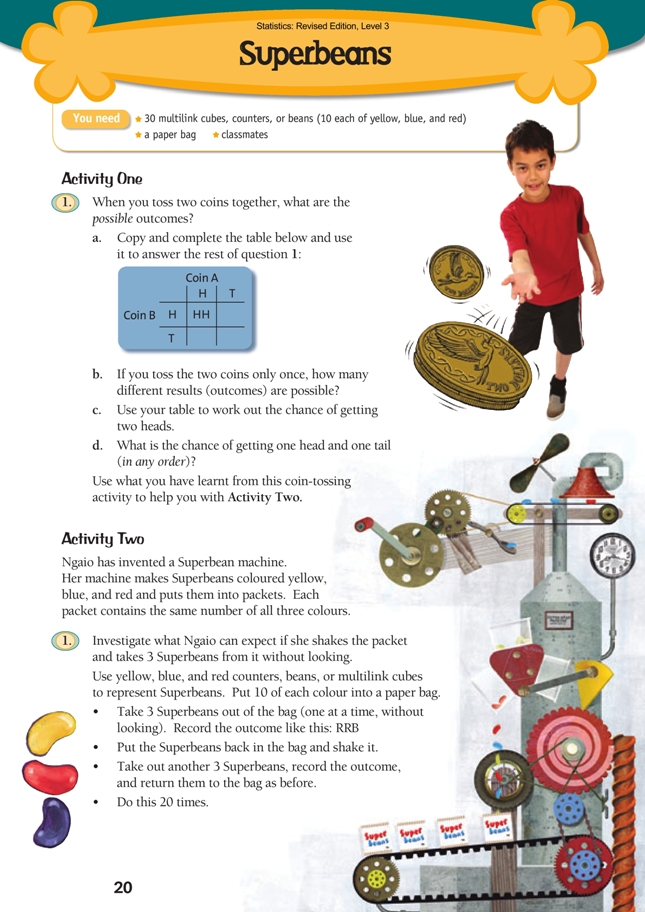
Activity One
The kind of table found in question 1 is often used as a convenient way of setting out the possible outcomes for a two-trial probability experiment. If your students have not filled in one before, they may need help to get started (using the HH already entered).
When completed, it should be clear that there are four possible outcomes: HH, TH, HT, and TT. A head and a tail are equally likely outcomes when a coin is tossed, so each of these four outcomes is also equally likely. This means, for example, that there is a 1 in 4 (1/4) probability of getting HH when two coins are tossed. Because two of the outcomes consist of a head and a tail, the probability of a head and a tail (ignoring order) is 2 out of 4, or 1/2.
These fractions (1/4 and 1/2) are both between 0 and 1, as are all probabilities. 0 means completely impossible; 1 means completely certain. All other outcomes lie somewhere on the continuum between them. This is an important probability concept.
Activity Two
Activity One was designed to help students understand that there may be more than one path to an outcome (both HT and TH qualify as “a head and a tail”). They need to use this knowledge in this second, considerably more complex, activity.
Question 1 explains how the Superbean simulation is to work and asks the students to do 20 trials, recording the outcomes in the shorthand introduced in Activity One.
In questions 2 and 3, the students collate and analyse their results. They may fi nd that no clear pattern emerges from the initial 20 trials. This is likely to change when they combine their outcomes with those of classmates to get a bigger data set (when it comes to number of trials, the bigger the better). What they are likely to find is that most outcomes contain two Superbeans of the same colour; much less common are those that consist of three different colours, and rarest of all are those in which all Superbeans are the same colour. Using the language of question 3b, two of the same colour is the “most likely” outcome and all the same colour is the “least likely” outcome.
In question 4, the students list all the possible outcomes for the 3-Superbeans experiment. They will have to do this systematically if they are to find them all. Challenge them to find a way of doing this. Once they have done so, they will be able to see that there are a total of 27 possible outcomes. 3 of these outcomes (RRR, YYY, and BBB) are same-colour, 6 are all-different, and the remaining 18 are two-the-same combinations. This information should go a long way towards explaining the experimental results obtained by the students in the earlier parts of this activity.
Note (for your information only)
The above explanation is correct as far as it goes. But it would not be correct to go on to say that the theoretical probability of getting (for example) a same-colour outcome is 3/27 = 1/9 . The reason for this is that once a Superbean has been removed from the bag, the probabilities change for the remaining Superbeans. We illustrate this with reference to RRR: To start with, the bag contains 30 Superbeans of which 10 are red, so the probability that the first Superbean is red is 10/30 . If the first Superbean removed from the bag is red, there are now 9 red Superbeans in a bag that contains 29 Superbeans, so the probability that the second Superbean is
red is 9/29 . Similarly, if the second Superbean is red, the probability that the third is also red is 8/28 . The probability that all three will be red is therefore 10/30 × 9/29 × 8/28 , which is rather less than 10/30 × 10/30 × 10/30 = 1/27 .
Extension
If you have a student or students in need of a challenge, you could suggest that they create a tree diagram (see following page) to show the possible outcomes for the 3-Superbeans experiment.
This can most easily be done using a computer drawing program.
Answers to Activities
Activity One
1. a..gif)
b. 4 outcomes (shaded)
c. 1 out of 4 or one-quarter (1/4)
d. 2 out of 4 or one-half (2/4 = 1/2)
Activity Two
1.–2. Practical activity. Results will vary. A possible statement for 2a is: “The three Superbeans were all of a different colour in 6 of the 20 trials.”
3. a.–b. Results and comments will vary. The bigger the data set, the more accurate
the patterns should be. Ngaio might expect 2 of the same colour when she
takes 3 Superbeans from her packet.
4. a. YYY, YYR, YRY, RYY, YYB, YBY, BYY, RRR, RRY, RYR, YRR, RRB, RBR, BRR, BBB, BBY, BYB, YBB, BBR, BRB, RBB, YRB, RBY, BRY, YBR, RYB, BYR
b. i. 3. (YYY, BBB, RRR)
ii. 6. (YRB, RBY, BRY, YBR, RYB, BYR)
iii. 18. (6 for yellow: YYR, YYB, BYY, RYY, YRY, YBY; and similar combinations for the other two colours)
c. The “least likely” possibility is that all 3 Superbeans are the same colour (only
3 of the 27 outcomes). The “most likely” outcome is that two Superbeans will be of
the same colour (18 out of 27 outcomes).
Key Competencies
Superbeans can be used to develop these key competencies:
• thinking
• using language, symbols, and texts.