This is a level 3 algebra activity from the Figure It Out theme series.
A PDF of the student activity is available.
Click on the image to enlarge it. Click again to close. Download PDF (490 KB)
show a linear relationship on a graph
interpret information from a graph
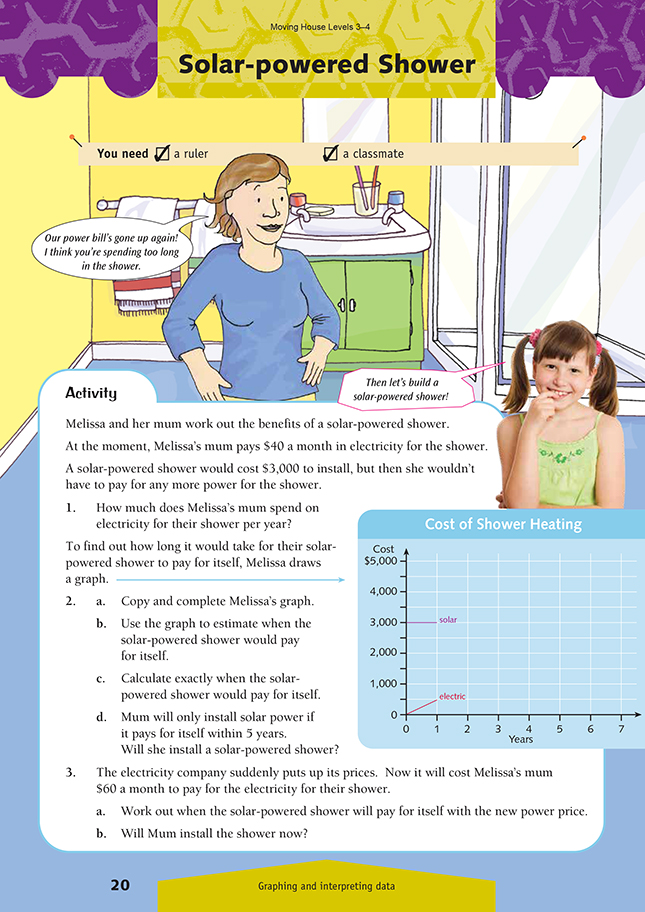
FIO, Levels 3-4, Theme: Moving House, Solar-powered Shower, page 20
A ruler
A classmate
This activity is a simple cost-benefit analysis: is it worth spending money now to save money in the future? Question 1 requires the students to find the cost per year ($40 × 12) of using electricity. This information is needed to complete the graph comparing solar power with electricity. Most students will find it easiest to plot the relative costs at the end of 2 years, 3 years, 4 years, and up to 7 years and join the dots. Check that they understand why the line representing the cost of solar power is horizontal and why the cost of electricity is shown by a sloping line. (Solar power involves
a one-off payment, but electricity has to be paid for each month.) The students could use a computer spreadsheet to produce a finished graph.
Question 2b can be answered from the graph by reading the number of years off the horizontal scale immediately below the point of intersection of the two lines. Ask the students what it means when two lines intersect on a graph. (Two lines always meet at a point unless they are parallel. At that point, the two lines share common values on both scales.) Here the intersection means that, at one moment in time, the cost of solar power and electricity will be the same. Will the two lines continue to be straight if the graph is extended beyond 7 years? Not necessarily. The solarpowered
system may need costly maintenance, and the cost of electricity may increase. But it is unlikely that the two lines will cross again, meaning that the solar-powered system will continue to save Melissa’s family money.
In question 2c, the students need to calculate how many monthly payments of $40 it will take before Melissa’s mum has spent the $3,000 needed for the solar shower. Discuss the relative merits of graphs and calculations. (Graphs are great for spotting trends, patterns, or special features of data, and for estimating values, but they don’t usually allow you to read off precise values. For exact answers, we need to do calculations using the raw data.)
Also discuss the benefits of having a formula for working out costs. (As a variable changes, it is easy to recalculate the total cost.) The answer to question 2c can be found using the formula: number of months = 3,000 ÷ cost per month of electricity.
For question 3, the students could add a third line to their graph, showing the new cost of electricity at $60 per month.
With the permission of their parents, the students could bring along an electricity account from home, and you could photocopy these in such a way that they don’t show the name or address of the family. These could then be used to investigate how consumers are charged for electricity. More able students could prepare a presentation on the actual cost of running appliances such as a light bulb, heater, and
computer. One way of doing this would be to set up a spreadsheet and graph the time in hours that each appliance would take to use $1 worth of electricity.
Links
This and the following activity could form part of a unit on Our Precious Resources.
Have the students consider possible options available to New Zealand power utilities or politicians for maintaining a reliable power supply through the winter months. After feedback and class discussion, students reach a consensus on preferred options, giving their reasons.
Suggested achievement objectives are:
Social Studies
• how and why people manage resources (Resources and Economic Activities, level 3)
• how and why people view and use resources differently and the consequences of this (Resources and Economic Activities, level 4)
• make decisions about possible social action (Social Studies Processes, Social Decision Making, levels 3-4)
Answers to Activities
1. $480
2. a.
b. In just over 6 years
c. 6.25 years (75 months or 6 years and 3 months)
d. No, she won’t install a solar-powered shower.
3. a. After 4.17 years (3000/60 = 50 months or 4 years and 2 months)
b. Yes, she will, because 50 months is less than 5 years.