This is a level 3 statistics activity from the Figure It Out series.
A PDF of the student activity is included.
Click on the image to enlarge it. Click again to close. Download PDF (1661 KB)
record results of a probability experiment on a tally chart
discuss experimental and theoretical probabilities
This diagram shows the areas of Statistics involved in this activity.
The bottom half of the diagram represents the 5 stages of the PPDAC (Problem, Plan, Data, Analysis, Conclusion) statistics investigation cycle.
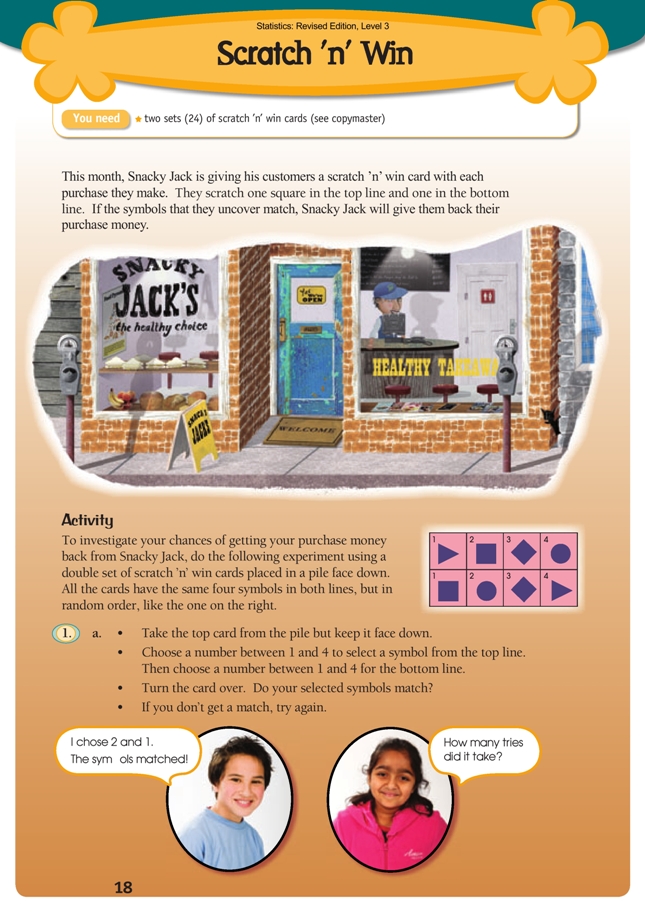
Two sets (24) of scratch 'n' win cards (see Copymaster)
In this activity, the students carry out a simple probability (or chance) experiment a number of times and make deductions based on the outcomes they obtain. Some advance preparation is involved (photocopying) as each pair of students needs a double set of the copymaster cards.
The activity is designed to help students develop their understandings experientially, so all they should need by way of introduction is a clear understanding of what they are to do. There are two initial experiments (questions 1a and 1b). These will give you the opportunity to make sure that everyone knows what to do and should demonstrate to students that the outcome of a trial is very variable.
Following the initial experiment, the students carry out a series of 20 further experiments, recording the outcomes in a table.
For question 1c, challenge your students to get beyond “pretty difficult” for an answer and use the statistics in their tally chart to express the probability of a match as a number or a ratio. This number is the experimental estimate of the probability of obtaining a match. The number they come up with is likely to be near 1/4 because, whatever fi rst symbol is selected, there are only 4 to choose from for the second symbol. (Because all four symbols have an equal chance of being picked, the
theoretical probability of a match is said to be 1/4.) By pooling their results, the students should obtain further confi rmation that the probability of a match is indeed 1 in 4.
The answer to question 1e is, of course, that no number of trials will guarantee a match. While probability can predict and explain patterns, it can never guarantee the outcome of a trial or the result of an experiment. In this case, the probability of a match is 1/4 , but it is possible that 100 or even 1000 trials might not produce one – very unlikely, but nevertheless possible.
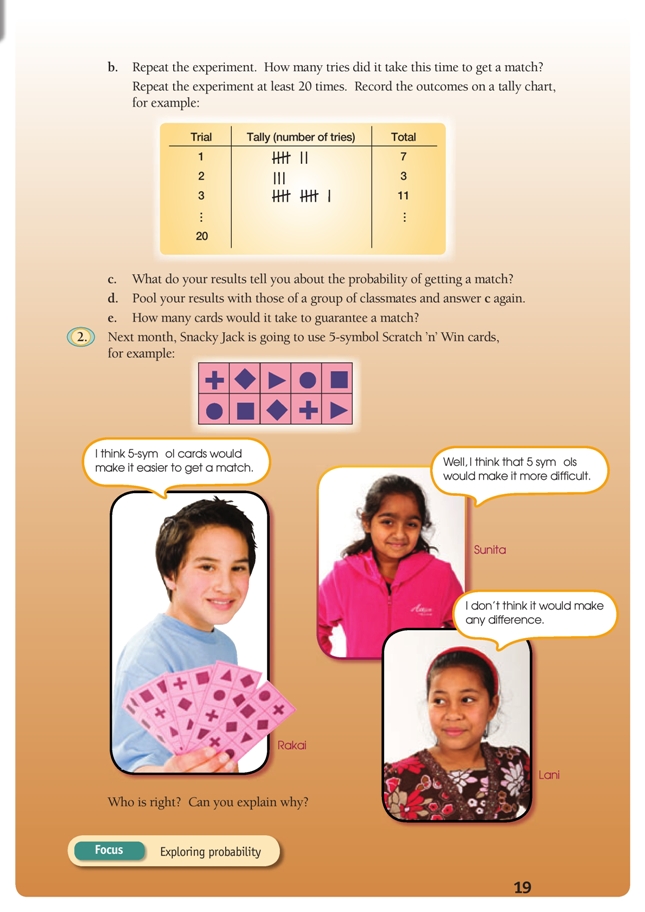
Question 2 alters a key variable (the number of symbols on a card) and invites the students to predict how this change will affect the probability of a match. This should help them generalise their findings from question 1.
As an extension to this activity, you could challenge your students to predict what the probability would be of “scratching” two specified symbols (two crosses, for example). (For the 4-symbol card, there is only a 1 in 4 probability of picking the cross in the top row and then only a 1 in 4 probability of picking the cross in the bottom row. So the probability of picking both crosses is “a quarter of a quarter” or 1/16 .)
Note that the 4-symbol experiment could equally well be modelled by a pair of 4-sided dice and 6-symbol cards by a pair of regular 6-sided dice.
Answers to Activity
1. a.–d. Practical activity. Results will vary. But you will probably decide that it’s not easy to get a win! If you tried a large number of scratch ’n’ wins, you would fi nd that
about one-quarter would be “wins”.
e. It’s not possible to specify a set number to guarantee a match. The result depends
on probability, so any card can deliver, or not deliver, a win.
2. Sunita is right. With a 4-symbol card, the probability of choosing matching symbols is 1 in 4. With a 5-symbol card, the probability is 1 in 5.
Key Competencies
Scratch ’n’ Win can be used to develop these key competencies:
• thinking
• using language, symbols, and texts.