This is a level (2+ to 3+) mathematics in science contexts activity from the Figure It Out series.
A PDF of the student activity is included.
Click on the image to enlarge it. Click again to close. Download PDF (1605 KB)
Students will:
- gather, sort, and display category, whole-number,and simple time-series data and communicate their findings through graphs
- estimate whole-school data.
Students should discover that:
- different representations suit different types of data
- sample data can be used to make predictions about the whole
- statistics can mislead if important variables are ignored.
protective gloves (if handling rubbish)
a computer spreadsheet/graphing program
FIO, Sustainability, Levels 2+-3+, Is Rubbish A Problem?, pages 4 - 5
Preparation and points to note
Think through the safety and hygiene aspects of handling rubbish: disposable gloves are likely to be needed.
The students will need access to suitable scales if they are to quantify rubbish by mass. To gather data for the in-class study, it will be simplest if the bins used are a standard size.
If possible, have the students use a computer spreadsheet for the data collation. This will facilitate graphing.
You could focus on the key competency relating to others here because the students need to be open to each other’s ideas and able to involve others, including adults, when doing their research.
Note that estimating is not the same as guessing. An estimate is a number arrived at by calculation and based on certain assumptions. When estimating how much rubbish is likely to be generated over time, the students have to make some assumptions and then do some calculations. In this case, when making assumptions, they should think about seasonality and other possible causes of variation. For example, in the winter, students will probably have less fresh fruit and more packaged goods in their lunches.
Points of entry: Mathematics
Students at this level are used to counting and to measuring using informal and formal units. But in this activity, they are challenged to fi nd ways of quantifying something that is awkward to handle and for which there is no obvious or convenient method.
Ask the students to brainstorm the options and to categorise them. All will fall into one of these three
categories: counting, weighing, measuring by volume. Have them debate the advantages and disadvantages of each category before the preferred option is chosen and a methodology refi ned. Ask How precisely will we do this?
This is a good activity for teaching or reinforcing the fundamental difference between counting and measuring: measuring always requires a device and a unit of measurement (for example, measuring jug and litre, ruler and centimetre, scales and gram, bin and binful); counting does not. (Discuss with your students why “hill” as in “5 hills” or “paper” as in “19 pieces of paper” are not units of measurement.) If the students decide to measure the amount of rubbish (for example, by volume, mass, or type), they will need to decide what measuring device and unit to use.
Particularly given the amount of work involved in the data gathering, encourage your students to extract as much information from it as possible. If all they do is weigh a week’s rubbish and multiply it by 40 to estimate the rubbish produced in a school year, what they learn will be limited. Challenge them to also collect data that will enable them to estimate how much of the rubbish they generate could be easily recycled. They could also work out whether most of the rubbish is being generated by only some people in the school community or how much of the rubbish is packaging.
The students should make full use of the statistical enquiry cycle, beginning with experimental design and working through to drawing conclusions from graphs. Make explicit the elements of the enquiry cycle (problem, plan, data gathering, analysis, conclusion) so that the students see the framework for a valid statistical study. If they do this, they will see the reason behind every part of the investigation. When they reach the end, they should have “stories to tell” and ideas for further investigation. Drawing graphs is not an end in itself. Encourage the students to use different types of data and/or representations and to use the comparisons between groups as a way of evaluating if improvements are possible in their own graphs.
Points of entry: Science
Discuss cause and effect and how the students’ data can help them determine strategies for reducing rubbish. Ask them to think about whether there are fixed as well as variable effects; in other words, some of the school rubbish may be constant and outside the students’ control.
Test the students’ experimental investigation designs against the scientific method: Are your measurements meaningful? Are your conclusions practical? For example, students could make less rubbish by not eating lunch at all, but the negative effects of skipping lunch make this a poor strategy.
Challenge the students to justify their results by showing evidence that their estimates or conclusions are reasonable. Ask How could you test your conclusions?
Answers
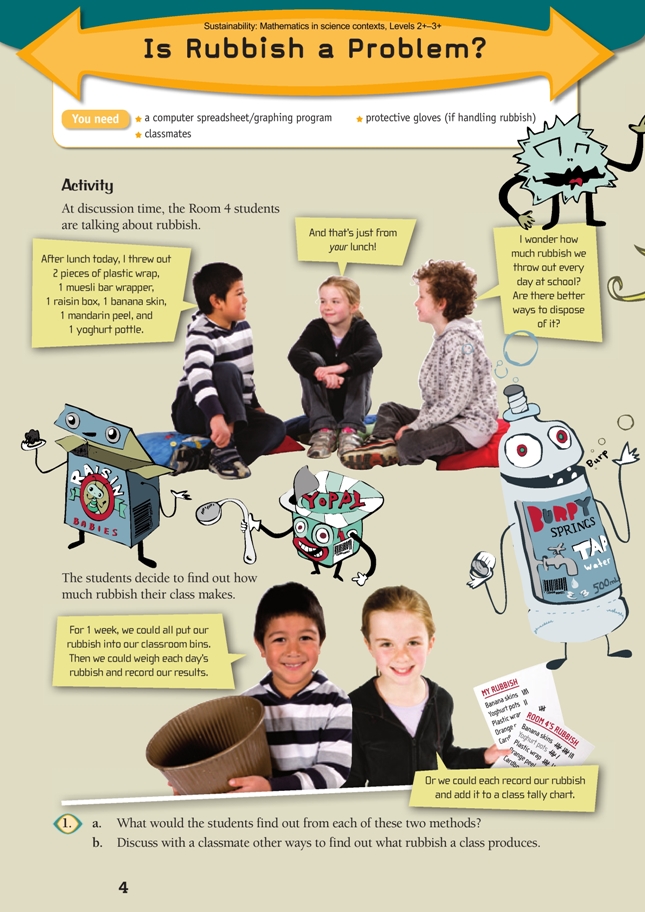
1. a. Weighing the rubbish would show the total mass for each day but not what was being thrown away. A tally chart would show the number of items of each type of rubbish – but only if everyone remembered to record everything.
b. Suggestions will vary. For example, you could put all the paper into one bag, all the food scraps into another, and so on, and then weigh them.
2. a. Investigations will vary but should be based on the statistical enquiry cycle: problem, plan, data, analysis, conclusion.
b–c. One graph can’t show everything, and different groups may have focused on different features of the data, so graphs and the stories that the graphs tell will differ.
d. Discussion and ideas will vary. There is unlikely to be a “best way” of graphing the data. Rubbish could be graphed on a single bar chart, as a series of 1-day charts, or as a time-series graph. A pie chart will show how big a “share” of the total each type of rubbish has, but it won’t tell the reader anything about the amount.
e. Answers will vary. They should be based on the approximate number of weeks in a school
year. (Not much rubbish is generated in the holidays!)
3. Answers will vary. A reasonable method would be to multiply the amount of rubbish 1 class
makes for the year by the number of classes.
4. There will be rubbish in the staffroom. There will also be offi ce and administration waste,
such as photocopy paper, cardboard boxes, and broken or outdated equipment. Bins around
the school grounds will contain mostly food and food wrappings. For these bins, you may decide
to analyse several and use this information to estimate a total. (Your caretaker may be able to
provide you with some useful data.) Your school may also have recycling bins that need to be
taken into account.
5. Graphs and accuracy of estimates will vary. Test your estimate by asking the caretaker how much
waste they dispose of.