These are level 3 statistics problems from the Figure It Out series.
A PDF of the student activity is included.
Click on the image to enlarge it. Click again to close. Download PDF (253 KB)
find outcomes using diagrams (Problems 1, 3 and 4)
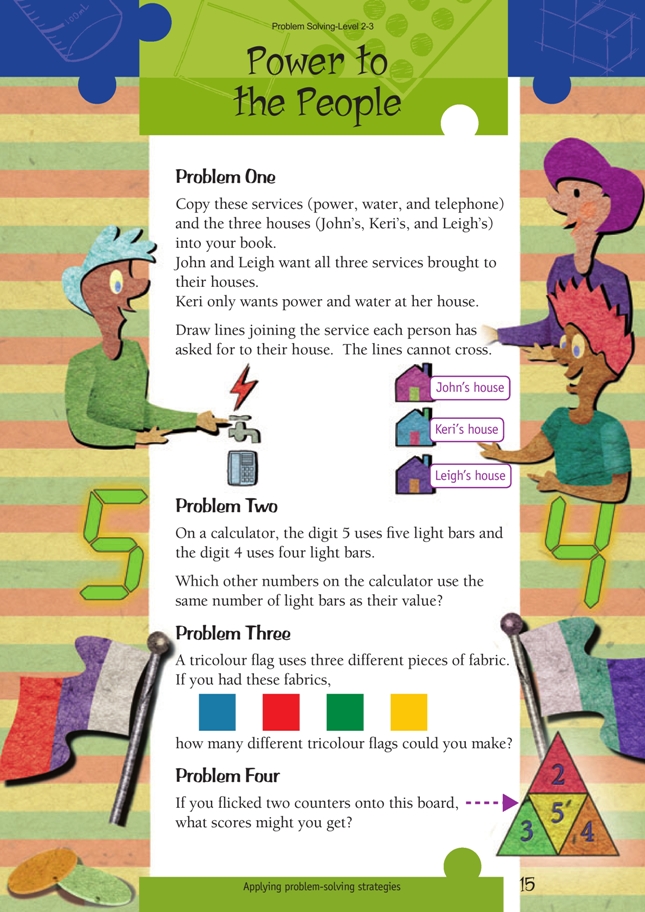
Problem One
Students will need to experiment with the different places that the service lines can go. For example:
See the Answers section for a possible solution.
A table is a good way to check that all required connections have been made.
If students find the problem difficult, simplify it by having two people and two services and then two people and three services.
Problem Two
Students will need to systematically check the number of light bars needed for each digit:
Six is the only other digit that uses as many light bars as its name.
There are other challenges that can be posed involving light bars. For example:
“How many two-digit numbers are made with 10 light bars?”
Problem Three
This is another combinations problem identical in nature to Problem One on page 6. The solution can be worked out with a tree diagram or organised list:
As an extension, increasing the number of colours to five increases the number of different possible colour combinations for the flags to 5 x 4 x 3 = 60. This assumes that each flag must contain three different colours.
Problem Four
A table is a good way to solve this combinations problem. Assuming that both the coins land, the solution can be found in this way:
So the scores could be one of the whole numbers 4 to 10.
Students might want to make the board and trial which score is most or least likely. The table shows that students are most likely to score seven and are least likely to score four or 10.
Answers to Problems
1. One solution is:
2. The digit 6
3. 24
4. Any of the whole numbers from 4 to 10