The purpose of this activity is to engage students in solving a probability problem using both theoretical and experimental (modelling) methods.
This activity assumes the students have experience in the following areas:
- Calculating with fractions and decimals.
- Using fractions, decimals, and percentages to represent proportions.
- Designing and conducting simulations to estimate probabilities.
- Calculate expected values from given probabilities.
The problem is sufficiently open ended to allow the students freedom of choice in their approach. It may be scaffolded with guidance that leads to a solution, and/or the students might be given the opportunity to solve the problem independently.The example responses at the end of the resource give an indication of the kind of response to expect from students who approach the problem in particular ways.

At the local hockey grounds, there are four fields, with one of the four being brand new artificial turf. The allocation of fields to play on for the draw in a ten round competition is random.
How many games would a team expect to play on the new turf?
Use random numbers to set up a simulation of this problem. Comment on the results of your simulation.
The following prompts illustrate how this activity can be structured around the phases of the Statistical Enquiry Cycle.
Problem
The problem section is about what data to collect and who to collect it from and why it’s important.
- What is my investigation question?
- What would an answer to my question be? (Students need to recognise that the answer is a probability estimate.)
- How would my answer be expressed? (Fractions, decimals and percentages are used to represent probabilities.)
- What evidence will be needed? (Probabilities can be found theoretically using models of all the possible outcomes, or experimentally by caarying out a simulation.)
Plan
The planning section is about how students will gather the data.
- How will I go about answering this question? (Simulation is required but theoretical models could also be used to confirm the estimate.)
- What will I need to know? (The fraction of all sausages that are correctly cooked.)
- How will I find the data that I need? Is the data already available somewhere or will I need to collect it?
- How many trials will I need to get a reliable estimate by simulation? (Students should know that small numbers of trials give unreliable results.)
- When I collect data, how will I measure the probability? (A fraction less than one will be used.)
- How will I guard against bias?
- What tools might be useful? (Students might use manual methods, like counters, or use the Scrambler plugin on CODAP.)
Data
The data section is concerned with how the data is managed and organised.
- What format will I use to organise my data as I gather it, or retrieve it? (Some form of frquency table or tally chart is a useful format.)
- How will I know when my sample size is large enough? (The proportions (fractions) of turf games will stabilise as sample size increases.)
- What digital or written tools will help my organise my data? (Digital platforms like CODAP and Excel can create displays as data is collected.)
- How could I calculate the theoretical probability? (Students are given fractions for the likelihoods of turf and non-turf games.)
Analysis
The analysis section is about exploring the data and reasoning with it.
- Have I reflected back on my question so I am clear what I am trying to find out?
- Have I carried out enough trials?
- What displays have been most useful? Why?
- Do my results give a reasonable estimation?
- What variation can I see in my data? What might be the causes of that variation?
- Can I make preliminary statements about my findings, starting with “I noticed that...”
- Am I developing ideas about what the answer to my question might be?
Conclusion
The conclusion section is about answering the question in the problem section and providing reasons based on their analysis.
- Have I answered my original question? If not, why not?
- How might I convince someone else I have answered the question?
- Do the experimental and theoretical results agree? Is that what I expected?
- Do I say about the limitations of what I have found out? What can I say and what can’t I say?
- What strategies and tools proved the most useful in my inquiry?
- What other things have I learned and what further questions do I have?
Examples of work
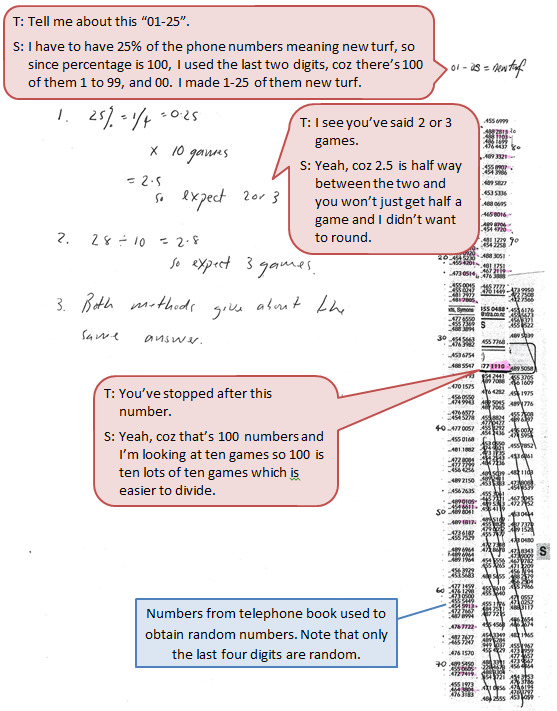
Work sample 1
The student uses the provided fraction information to set up and run a valid, simple probability simulation, with guidance. They compare the experimental estimate with the theoretical value of the probability.
Click on the image to enlarge it. Click again to close. 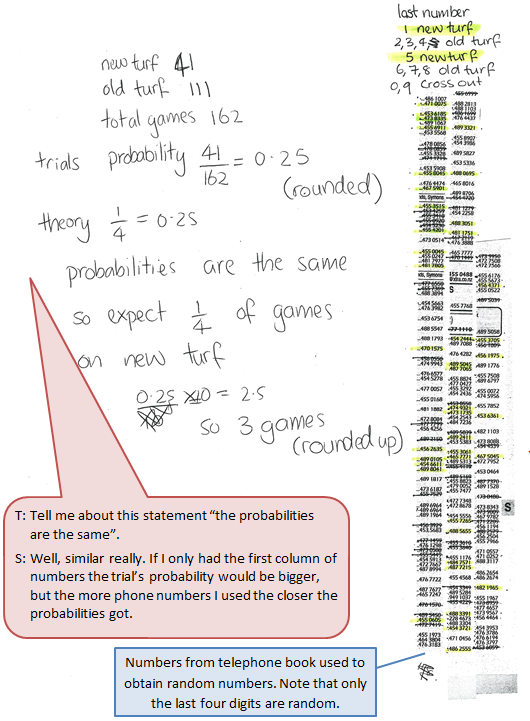
Work sample 1
The student runs a probability simulation using random numbers, and calculates a theoretical probability, to find a probability. They compare the results of the two methods.
Click on the image to enlarge it. Click again to close.