This is a level 5 and 6 number activity from the Figure It Out theme series.
A PDF of the student activity is included.
Click on the image to enlarge it. Click again to close. Download PDF (625 KB)
write large numbers in standard form
extrapolate information from an exponential graph
interpret (by interpolation) information froma exponential graph
FIO, Levels 4-4+, Theme: Disasters Strike!, Moving and Shaking, page 4-5
A classmate
In this activity, students use the Richter scale and tonnes of TNT to investigate the energy released in earthquakes.
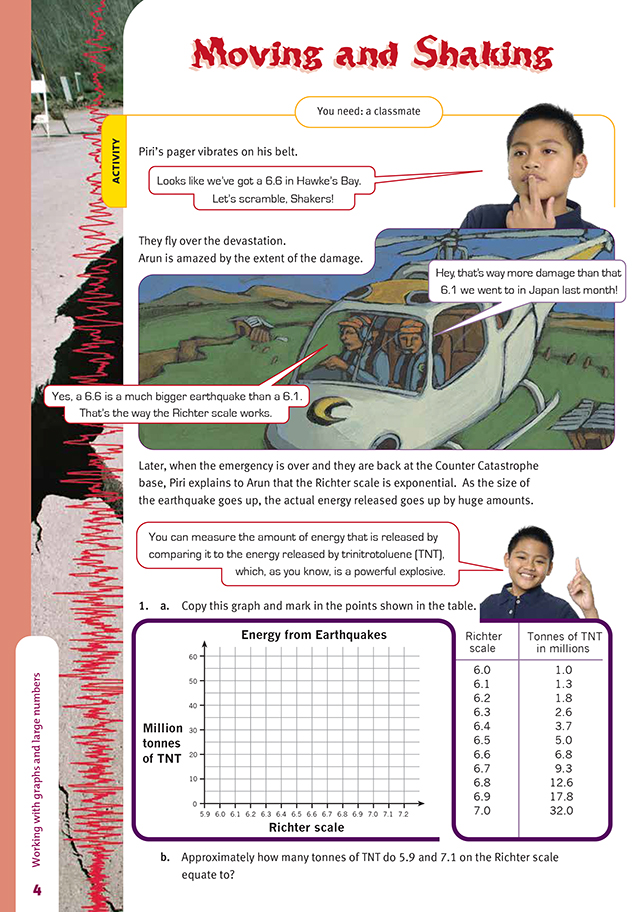
In question 1, to find how many tonnes of TNT are required to simulate 5.9 and 7.1 on the Richter scale, we have to look beyond the boundaries of the given data. These values can be approximated by using the graph to extrapolate the required information. Another way of expressing this would be to “obtain an approximate
reading by studying the trend of the graph beyond the given data”. To do this, we extend the graph beyond its plotted boundaries, following the trend of the line or curve. An extrapolation from the Richter scale graph is shown in the Answers. The students could extend the line on their own graphs and use it to read an
approximate value off the vertical axis for 7.1.
To find the TNT equivalent of the Napier earthquake, a process known as interpolation is applied to a graph of the data already provided or extrapolated. Simply put, interpolation is the process of estimating values that lie between given points on the graph. This is shown in the diagram below.
For 5.9, which is difficult to read off the graph, they need to keep in mind that it has to be less than 1 million, the value given for 6.0 on the student page. As suggested in the Answers, if the students calculate the differences between the tonnes of TNT, they should see a decreasing pattern (… 1.1, 0.8, 0.5, 0.3). So, the next lowest rating on the Richter scale, 5.9, should be about 0.2 less than the 1.0 million tonnes for 6.0, that is, about 800 000 tonnes.
An excellent website on New Zealand earthquakes is www.gns.cri.nz
For detailed information on the Napier earthquake, try
www.library.christchurch.org.nz/Childrens/NZDisasters/Napier.asp
For more information on the Richter scale, see https://en.wikipedia.org/wiki/Richter_magnitude_scale
Cross-curricular links
Social Studies and Health and Education
The students could create a timeline of major disasters within New Zealand’s history. Each student could identify a disaster for which they carry out detailed research. Their study needs to include the effects that the disaster had on the people at the time and ways in which it changed their lives. Using the underlying concept of hauora, from the health and physical education curriculum, the students could list the impacts
under the four headings: physical, mental and emotional, social, and spiritual well-being.
Achievement Objectives
Social Studies
Demonstrate knowledge and understandings of:
• causes and effects of events that have shaped the lives of a group of people (Time, Continuity, and Change, level 4)
• how and why people experience events in different ways (Time, Continuity, and Change, level 4)
Health and Physical Education
• identify the effects of changing situations, roles, and responsibilities on relationships and describe appropriate responses (Relationships with Other People, level 4)
Science
The students could investigate how our landscape’s behaviour in an earthquake is determined by its geological structure.
Achievement Objectives
• collect and use evidence from landforms, rocks, fossils, and library research to describe the geological history of the local area (Planet Earth and Beyond, level 4)
• investigate and describe processes which change the Earth’s surface over time at local and global levels (Planet Earth and Beyond, level 5)
See also: Building Science Concepts Book 40.
Answers to Activities
Note: The dotted line shows how the line could be extended to show higher and lower values.
b. Approximately 800 000 tonnes for 5.9 on the Richter scale. (This cannot be read off the graph, but it has to be less than 1 million (see 6.0 on the table in the student book). The differences between the figures in the table also point to approximately 800 000. Answers between 700 000 and 900 000 are acceptable.)
Approximately 45 million tonnes for 7.1 on the Richter scale. (Answers between 40 and 50 million are acceptable.)
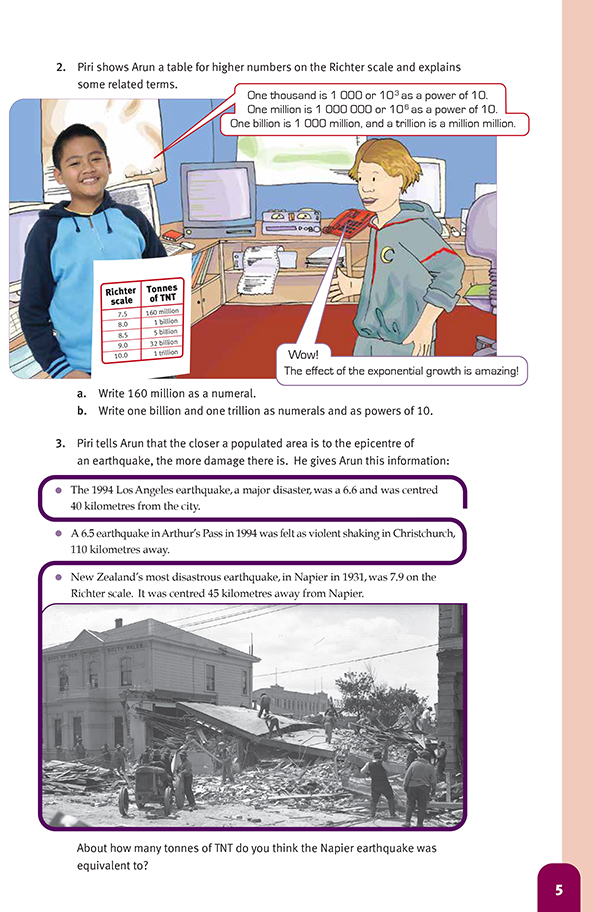
2. a. 160 000 000
b. One billion is 1 000 000 000 or 109. One trillion is 1 000 000 000 000 or 1012.
(This is the United States version, which is uniformly accepted these days.)
3. Approximately 700 million tonnes of TNT. (Answers between 500 and 900 million tonnes are acceptable.) A graph that could be used to estimate this is: