This is a level 3 number activity from the Figure It Out series. It relates to Stage 6 of the Number Framework.
A PDF of the student activity is included.
Click on the image to enlarge it. Click again to close. Download PDF (302 KB)
convert simple fractions to tenths and hundredths
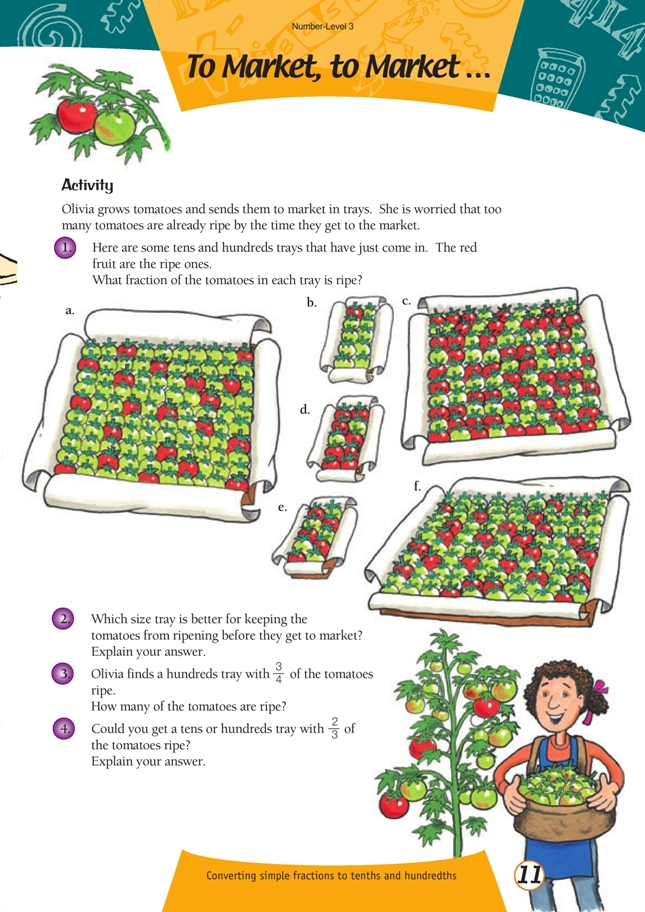
FIO, Level 3, Number, Book 1, To Market, to Market... page 11
Questions 2 and 4 provide opportunities for the mathematical processes achievement objectives listed above. You may decide to select one or two of them for particular attention. Interpreting information and results in context would be the objective to focus on when you ask students to think logically in question 2.
This activity provides a context for converting simple fractions to tenths and hundredths.
Question 2 has the potential for some rich involvement in mathematical processes because it is open-ended and presents a number of variations. Students may choose tray b as the best kind because only 1/10 of this tray is ripe and that is less than the others. Challenge this response with the question “Is this type of tray always the best?” Students may then look more carefully at the two types of tray being compared.
Students could draw a chart that converts fractions to percentages:
Overall, the hundreds tray is better. Students could explain this in a number of ways. They may see that tray c matches tray e and that tray a is 10 percent worse than tray b. But tray f is 55 percent better than tray d, so the hundreds tray must be better. Students could average the ripeness. The hundreds trays have an average ripeness of approximately 32 percent, and the tens trays have an average ripeness of approximately 47 percent.
In question 3, work as a class to make a chart showing some of the different arrangements for three-quarters ripeness.
For further investigation, see “One Bad Banana” in Connected 2 2000.
Answers to Activity
1. a. 20/100 (1/5)
b. 1/10
c. 50/100 (1/2)
d. 8/10 (4/5)
e. 5/10 (1/2)
f. 25/100 (1/4)
2. Answers will vary. The 1/10 ripe in one of the tens trays must be balanced against the 5/10 and 8/10 ripe in the other 2 tens trays. 14/30 (47%) of the tomatoes in the 3 tens trays are ripe, and 95/300 (32%) in the hundreds trays are ripe. This
could mean that, on average, fewer tomatoes in the hundreds trays will ripen before they get to market. Alternatively, you could say that there is not enough evidence to decide either way.
3. 75
4. No, because neither 10 nor 100 is evenly divisible by 3