The purpose of this unit of two lessons is to develop relational thinking through the exploration and expression of the relationship between two related number patterns.
- Recognise relationships between two number sets.
- Use a ‘mapping diagram’ to show a number relationship.
- Understand the connection between the coordinate systems of maps and graphs.
- Identify a situation in which there is a unique relationship between two data sets.
- Transfer mapped values onto a graph (an xy coordinate system).
- Explain a simple relationship graph with reference to mapped values.
In mathematics, a function is the relationship between two number sets, often referred to as inputs and outputs. What characterises this relationship is that one ‘input’ is paired with one single ‘output’.
Through exploring functional relationships, students are introduced to ways of expressing these relationships, including function diagrams (or machines), tables, graphs, equations, and ‘mapping’ diagrams. All of these provide a visual image of the relationship between two number sets. The early introduction of this enables students to show relationships between important elements in their lives, such as their relationship to other family members.
Students may also encounter this expression of a relationship in a pictorial mind map of ideas, where the relationship between one idea and another is depicted with an arrow or similar ‘mapped’ connection.
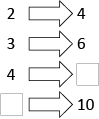
In relationship diagrams such as this:
2→4
3→6
4→8
5→10
This means one value is matched with, or mapped onto, one other value. In exploring the number relationships in these diagrams, students develop their understanding of a unique paired relationship between variables.
The mapping diagram is a clear visual representation of the special relationship that exists between the pairs of numbers, as demonstrated by arrows. When looking at the whole set of mapped values, students must consider the relationship that is common to all pairs. They should look for the ‘rule’ that explains what is happening between the numbers. This will explain how the variables in one set are related to the variables in the other set.
It is important for students to have opportunities to both interpret and create sets of mapped pairs. When students create their own diagrams for others to interpret, they must generate the values of the mapped pairs, thinking about the relationship that connects the numbers.
This exploration of mapped values is essential to a student’s understanding of coordinate pairs. As a student interprets and represents a situation on a relationship graph, they apply this understanding. Locating uniquely paired numbers on the (xy) coordinate system allows them to represent the relationship in another way. Students need opportunities to identify the connections between ‘mapped pairs’, ‘mapping’, coordinate systems and graphs that show relationships. These two lessons introduce these concepts.
Links to the Number Framework
Advanced counting (Stage 4)
Early additive (Stage 5)
Early multiplicative (Stage 6)
The learning opportunities in this unit can be differentiated by providing or removing support to students and varying the task requirements. Ways to support students include:
- providing opportunities for individual, grouped, and paired work
- strategically organising students into pairs and small groups in order to encourage peer learning, scaffolding, and extension
- working alongside individual students (or groups of students) who require further support with specific areas of knowledge or activities
- using technology to explore maps and number robots (e.g. what's my rule)
- using materials (e.g. cubes, shells, marbles) to support children and use a smaller difference, e.g., 10 and 1, 11 and 2, 12 and 3. Lay the items next to each other so the children can see the difference easily
- highlighting patterns and their connections using number expressions. For example, multiples of four or five.
The contexts for this unit can be adapted to suit the interests and experiences of your students. For example:
- Use a picture of a native tree with a seedling on the wall with Maori names for the parts (manga branch, kakano berry, rau leaf, kirirakau bark, tinana trunk).
- Use photos from students' cultures to use as photos for mapping, for example, aspects of tapa cloth.
Te reo Māori kupu such as tauira (pattern), ture (rule), and tatau (count) could be introduced in this unit and used throughout other mathematical learning.
- Copymaster 1
- Copymaster 2
- A large map of New Zealand with a grid overlay
- Blank grid paper
- Pieces of approximately 10cm x 10cm card for each pair of students
- Graphing paper
Session 1
Activity 1
- Begin by showing the students a picture of a tree and a seedling. Explain that the class will be investigating a relationship, over time, between the tree and the seedling.

Explain that the tree was planted on Arbor Day 20 years ago and that the seedling, that is just 1 year old, was planted this year on the same day, 5 June, which is also called World Environment Day.
Write the headings Tree and Seedling, and the ages of the trees, 20 and 1, beneath the picture. - Ask, how can we show what ages the tree and seedling will be each year as they get older?
Accept all suggestions but agree that a list or table could be created to show this. Have students write in the values for several consecutive years, beginning like this: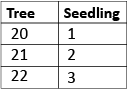
- Ask, what is happening to the numbers?
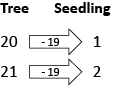
Accept suggestions (e.g. the numbers are increasing). Draw attention to the fact that both sets of numbers are increasing by one year, and that the seedling is always 19 years younger (or years less) than the tree. - Draw in a mapping arrow, on which is written -19. Explain that we say that we are ‘mapping’ one value onto one other special value, or showing the relationship between the pairs of numbers in each number set.
- Explore this relationship further with one or more of the following tasks:
- Writing in some larger values for the tree, such as 50, 63, 78. Have the children discuss and agree with a partner the relative ages of the ‘seedling’ (becoming tree, and share their strategies for calculating these.
- Writing in some larger values for the seedling such as 79, 85, 101. Discuss.
- Writing in some incorrect values such as Tree 63 Seedling 42; T100 S79; T109 S80.
- From the resulting discussion, highlight the fact that the -19 value is known as the common difference and that it is an unchanging amount, so these values are not correctly ‘mapped’. Emphasise that when we use arrows to map values in this way, we are showing the relationship between the values in two sets of numbers.
Activity 2
- Make paper and pencils available. Have students work in pairs to create their own diagram to show the relationship between the height of the trees, similar to the diagram the class has created for the trees’ age. They are to use arrows to map one value onto its paired value.
- Pose this scenario: The tree and the seedling grow taller each year by approximately the same amount, half a metre or 50 centimetres. This year the tree was 10 metres tall and the seedling was just half a metre tall.
- Have student pairs create and share their diagrams, discuss and resolve any differences. Emphasise that the arrow is telling us the relationship between the first and second sets of numbers. It tells us a rule that we can use to find the second number if we are given the first number. When we are adding or subtracting, the amount is known as the common difference (in this case - 9.5m).
Activity 3
- Have the students create a problem for another pair to solve. They should choose their own common difference.
Pose this scenario: As the trees grow taller, they also get wider, both by approximately the same amount. - Discuss whether they would be as wide as they are tall. Agree, no, probably not.
- Students should create their own relationship diagram showing at least five number values for both the tree and the seedling, they should not include the common difference in ‘mapping arrow’ as the other pair will add it in later.
For example: In the first year, the tree is 5 metres wide and the seedling is just 25cm wide.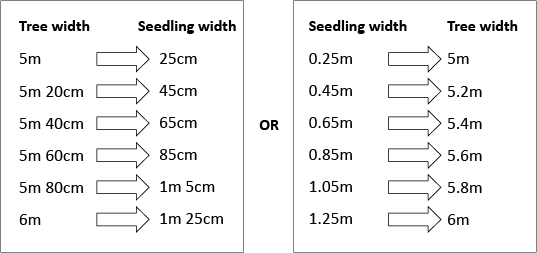
- Have them share their diagrams with another pair who is required to insert in pencil the arrows showing the relationship between the pairs of variables. (eg. –4 m 75 cm or +4.75)
- Use at least one diagram generated by the students and as a class, together answer the questions: Can there be more than one value for the seedling in any of the paired situations? (Answer: No, the number pairs are unique.)
- Make Copymaster 1 available for students to complete individually as they complete Activity 3 (above).
- Conclude the lesson by reviewing the tasks that have been completed. Have students explain what they have learned about mapping one value onto another and record their comments on a class chart, on a shared, digital document, or in a class modelling book.
Session 2
Activity 1
- Begin by reviewing the record of student learning created at the end of the last session. Revisit the context of mapping the values for the tree onto values for the seedling.
- Display a mapping diagram from the previous lesson.
Pose the question: Why do we use the word ‘mapping’ when we talk about the relationship between one value and one other value? Emphasise the importance of unique pairs. - Point out that when we use a map we also use unique pairs (the coordinate system).
- Display a simple NZ map (or a map of your local town, the world, another country etc.) with a grid overlay. Have several students demonstrate how they would describe the location of a specific place (eg. Wellington) on a NZ map.
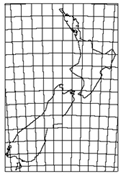
- Discuss the pairs of numbers (coordinates) that allow us to give a precise location.
Coordinates are a set of values that show an exact position. On a map, a pair of numbers show where a specific point is located: Identify several locations and record the coordinates. You could locate the places where your students come from, whakapapa to, or have been on holiday. - Explain that a graph is also known as a coordinate system.
Display a blank graph grid and mark a point on the grid.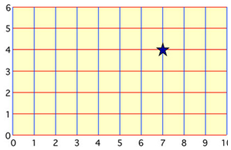
- Number the axes (ensuring the scale is located on the lines of the grid, not in the spaces) and read the location of the data point. (7,4).
- Point out that for consistency we give the numbers in a particular order (horizontal axis first).
We are ’mapping’ paired values. - Use the data from a mapping diagram from Copymaster 1. Together, plot these values onto the graph. Carefully model and discuss the process, drawing attention to the order in which the number pairs are graphed (horizontal axis first). Alternatively, you could provide students with blank grids and guide them through the process of graphing the numbers (perhaps in pairs) on their own grid.
Activity 2
- Explain to the students that they are going to make a ‘mapping puzzle’ for other class members to solve.
Show the students one of the pictures on Copymaster 2, or choose an image that is more relevant and interesting to your students. Consider how links might be made, through your selection of an image, to students' cultural backgrounds, interests, and to their current learning in another curriculum areas. - Together create a mapping diagram for the image (e.g. for the frangipani flower: petal pattern for one flower, two flowers, three flowers, etc.)
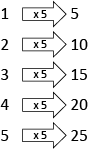
- Point out that this time the rule is x 5, multiplication, and we call this the common ratio. (Students do not need to remember this.)
- Together create a relationship graph from the data. Highlight the importance of considering how they will number the vertical (y) axis.
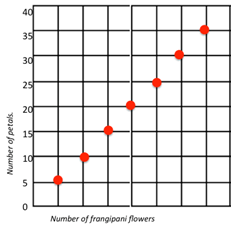
- Make the connection to ‘mapping’ pairs and coordinates on a map. Together look at the line of the data points. Emphasise that the graph shows that the relationship between the points is constant because the relationship rule, x 5, is the same for all pairs of numbers.
- Make one piece of card, (approximately 10cm x 10cm), the pictures in Copymaster 2, and one sheet of graph paper available to each student pair. Have student select a picture with their partner and create a mapping diagram for multiples of the item in picture. For example:
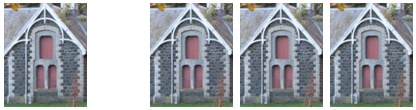
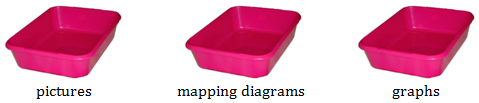
We can see one building with three windows. What if there were two buildings, three buildings, four buildings, etc.? - When their mapping diagram is complete, students should consider how they will number the vertical (y) axis on their graph. Have them complete their graph. You might model this process again for the whole class, or hold a guided session with some students. Have 3 separate trays available for students to place each of their items in when they are complete. One all students have placed their mapping diagrams in the appropriate tray, mix up the contents of each tray.
- Randomly distribute a picture, a diagram, and a graph to each student in the class. Have one student hold up a picture for the rest of the class to see. The other students need to check to see if they have the matching mapping diagram and graph. The two students who have these should show them and explain the relationship between the representations. The student with the picture confirms if they are correct. Continue till all pictures have been matched with their mapping diagrams and graphs. You could do this as a game of "I have, who has" or as an activity where everyone roams to find their matching pictures. This matching task could also be independently completed by students in small groups or individually.
- Conclude the session by discussing and recording on the class chart what students have learned about mapping values and about graphing these relationships between two data sets.
Dear families and whānau,
In class we have been mapping relationships between data sets and making relationship graphs. Talk about the two attached pictures with your child and have them explain what they have been doing. They will show you how to make a mapping diagram and a graph related to one of the pictures. Take your turn to complete the task with the other picture and ask your child for their feedback on your work.
Enjoy the challenge and the discussion.