This is a level 4 activity from the Figure It Out series.
A PDF of the student activity is included.
Click on the image to enlarge it. Click again to close. Download PDF (1239 KB)
Spatial-visualisation skills are important in many technical and scientific occupations. Reading, making, and using diagrams are good ways for students to develop these skills.
Statistical literacy is the ability to read and interpret data. Statistics provides the means to organise large amounts of data in such a way that it communicates meaning. Students need to be able to interpret and evaluate the statistical information they will encounter in everyday life.
In these activities, students interpret information in a table and connect it to the context. Students also use scale and proportional reasoning to solve problems.
FIO, Technology in Practice, Levels 3+-4+, Making Tracks, pages 8 - 9
Students can find it challenging to relate information in a diagram or a table to its real-life context, but being able to do this is an important skill.
Activity One
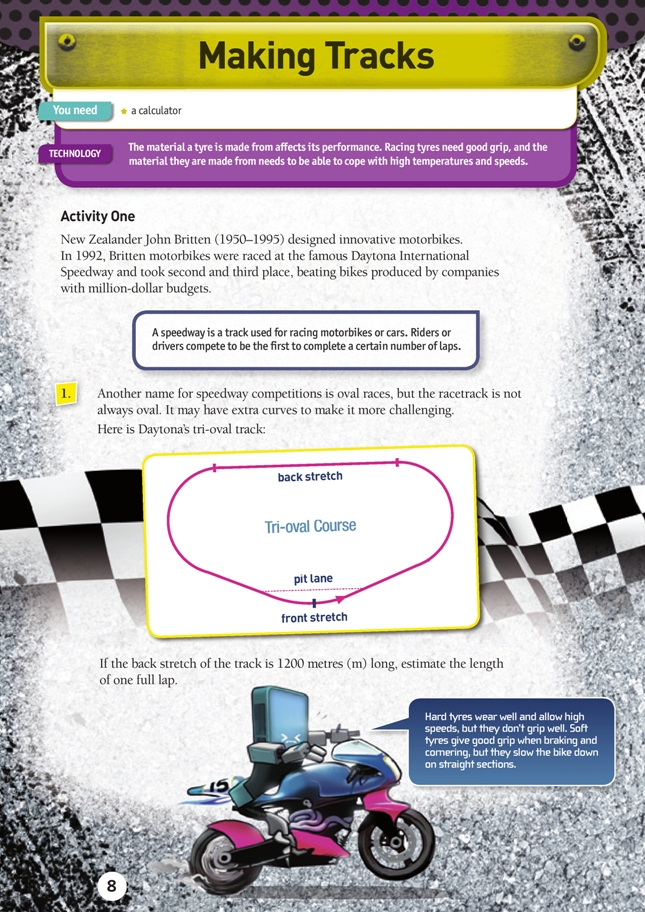
Measuring a curved object presents a challenge. Students could use a piece of string to compare the total length with the 1 200 m straight stretch. The total length is slightly more than 3 times the straight stretch. For a more precise answer, students could work out the scale of the diagram (1 cm represents 200 m). Wrapping a piece of string or a dressmaker’s tape around the tri-oval course diagram will give a result of 20 cm. 20 x 200 = 4 000 m.
Working with scale diagrams helps to develop proportional reasoning. Ask your students to share the strategies they used with the class.
Activity Two
Question 1 requires multiplicative thinking. To solve 4.025 x a = 644 km, students need to calculate 644 ÷ 4.025. They could also estimate the number of laps by using a halving strategy, for example, 640 ÷ 4 = 320 ÷ 2 = 160 ÷ 1 = 160.
Question 1b is more straightforward, requiring simple multiplication.
Question 2 can be used to discuss variation. Although most tyre changes take between 10 and 14 seconds, some will be faster or slower. We can’t put an upper limit on time spent in the pit because there are two unknowns: the greatest number of tyre changes and the duration of the longest tyre change.
Technology-related student activities
- Compare the various types of tyre available for either cars or bikes. Relate the features of the different tyres to the kind of vehicle or the driving/riding that they are intended for.
- Alter the performance of a toy car, measuring the distance it travels when released from the top of a ramp. For example, increase or decrease the car’s weight or change the surface of the track.
Exploring the technology-related context
Technologists need to understand the performance qualities of materials in order to produce goods that are fit for purpose. Manufacturers of high-performance products strive to achieve optimum design and material performance.
In motor racing, having the right tyres is essential. Weather and track conditions are an important consideration. A team using high-performing tyres will have a competitive advantage.
Answers
Activity One
1. Answers may vary, but the actual tri-oval course is 4 000 m long (4 km).
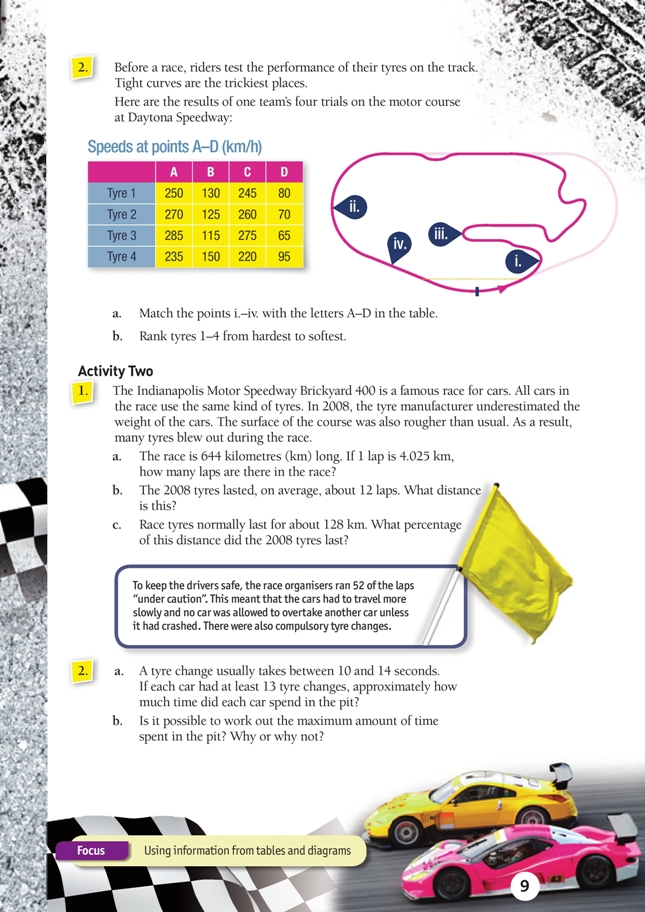
2. a. i. B
ii. C
iii. D
iv. A
b. The harder the compound, the faster the top speed and the slower the cornering. The most likely ranking, from hardest to softest, is: tyre 3, tyre 2, tyre 1, tyre 4.
Activity Two
1. a. 160 (644 ÷ 4.025)
b. About 48 km (12 x 4.025 = 48.3 km)
c. 48 ÷ 128 x 100 = 38%
2. a. 130–182 seconds, but it could have been more or even less.
b. No. Although we know that most tyre changes take 10–14 seconds, some might take longer. Also, each car had at least 13 tyre changes; some could have had far more.