This is a level 3 probability activity from the Figure It Out theme series.
Click on the image to enlarge it. Click again to close. Download PDF (335 KB)
find all possible combinations
use logic to solve problems
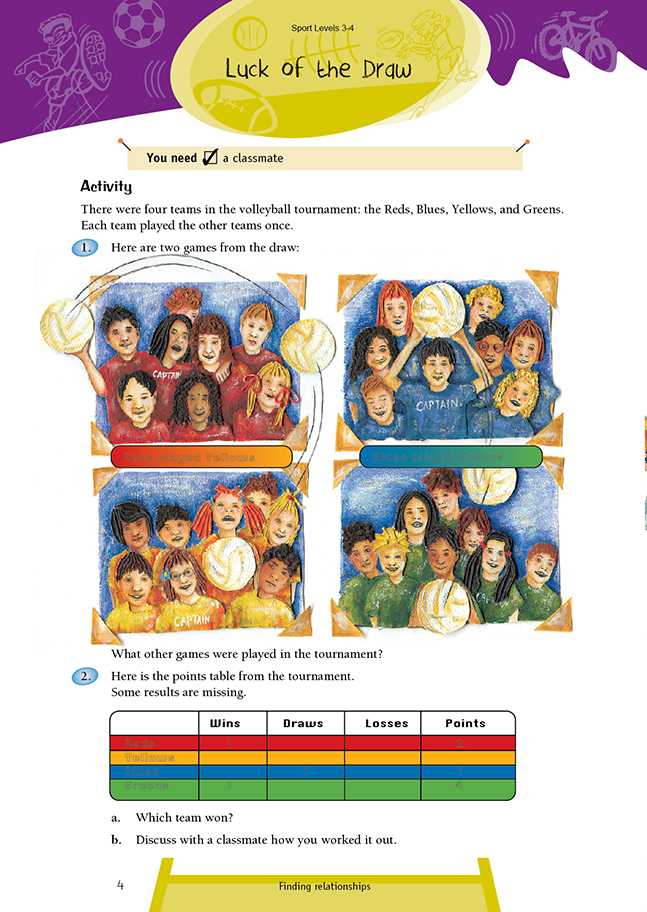
FIO, Levels 3-4, Theme: Sport, Luck of the Draw, page 4
A classmate
In this activity, students need to work systematically and use logic and reasoning to work out the tournament draw and who won, lost, and drew their games. To establish the games played in the tournament, the students might use a variety of strategies, including:
i. Making an organised list:
Reds versus Yellows
Blues
Greens
Yellows versus Blues
Greens
Blues versus Greens
ii. Drawing a diagram:
From question 1, the students will have realised that six games were played in all. To answer question 2, they will also need to work out how many points each team got for a win and for a draw. It is safe to assume that the teams got more for a win than a draw and more for a draw than a loss. In question 2b, the students discuss how they worked out the points table. A rationale for this is given in the Answers, although some students may have worked it out in other ways.
As a further challenge, the students may like to work out how many games are played in a fiveteam, round-robin competition. They may like to pose a similar problem to the one in this activity for their classmates to solve.
Answers to Activity
1. Reds vs Blues, Reds vs Greens; Yellows vs Blues, Yellows vs Greens
2. a. The Yellows, with 5 points
b. Answers will vary, but the completed table should look like this (the numbers in bold were already on the table):
You may have worked out the points like this:
The Blues had one draw and 1 point. The points system is unlikely to involve half points, so they must have had no wins and two losses. A draw is therefore worth 1 point. A win must be worth more than a draw. The Reds had one win and a
total of 2 points, so it seems logical to assume that a win is worth 2 points. (It also means that the Reds must have had no draws and two losses.)
For every loss by a team, there must be a corresponding win. The Reds and Blues had a total of four losses between them, but only two wins by the Reds and Greens are recorded. The Blues had no wins, as shown by their one point total. This means that the Yellows must have won two games. The total number of draws
must be even because two teams met each time.
The wins and losses account for four games, so the draws must account for the other two games.
The Greens had two draws and the Blues one, a total of three. Therefore, the Yellows’ other game must have been a draw. With two wins and one draw, the Yellows have a total of 5 points.