This is a level 2 and 3 statistics activity from the Figure It Out series.
A PDF of the student activity is included.
Click on the image to enlarge it. Click again to close. Download PDF (1833 KB)
answer questions from graphs
pose a question and plan an investigation
collect data
display and analyse data
communicate findings from an investigation
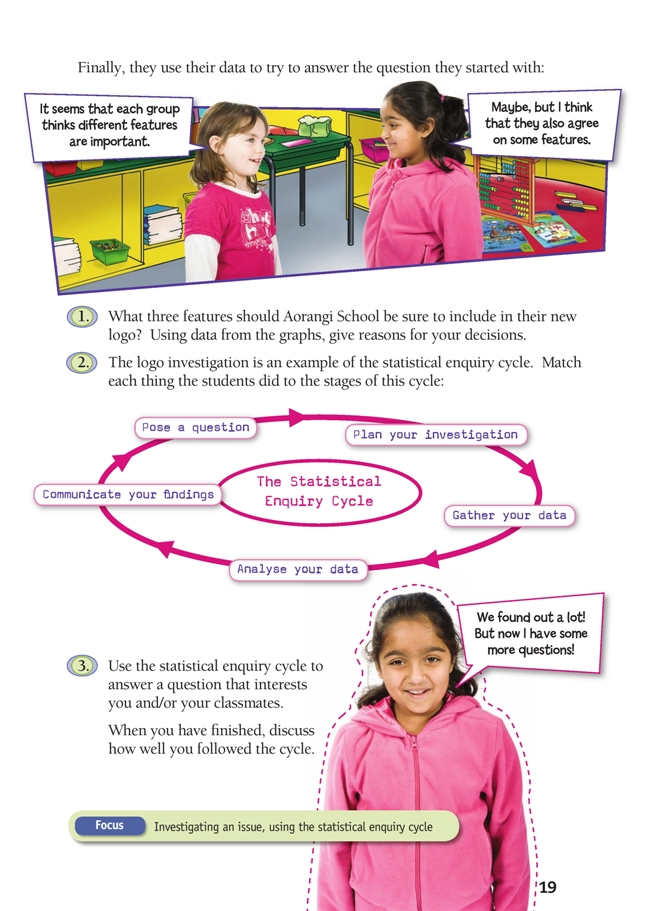
This diagram shows the areas of Statistics involved in this activity.
The bottom half of the diagram represents the 5 stages of the PPDAC (Problem, Plan, Data, Analysis, Conclusion) statistics investigation cycle.
This activity illustrates some of the diffi culties associated with drawing conclusions from different data sets in which the categories are not the same across all sets.
You could introduce the activity by asking your students what they can deduce about the students’ approach. It seems likely that:
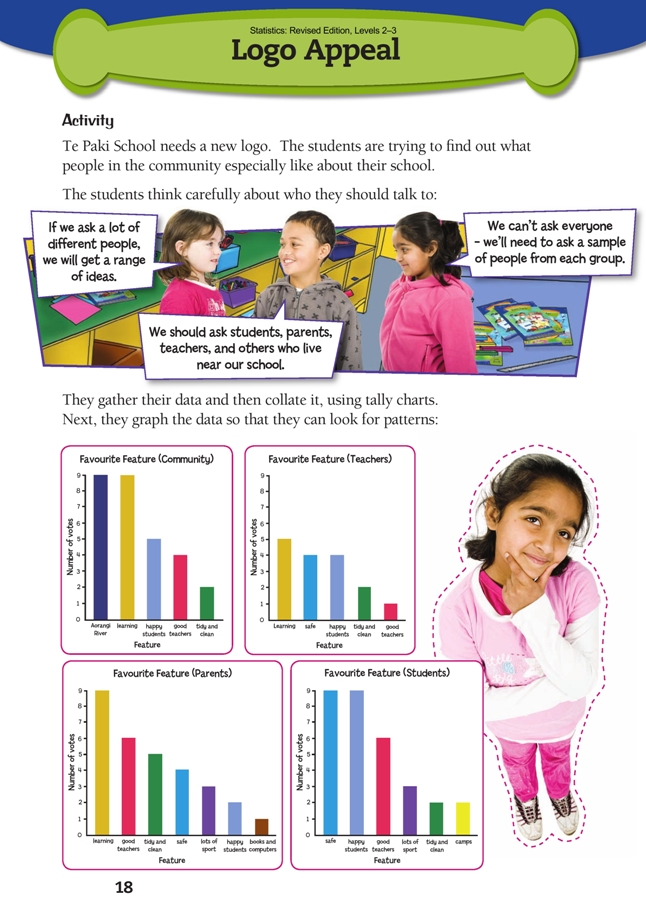
• their question was “What feature of our school is most important to you?” (or similar)
• they offered a range of options and asked each person to select just one (although each group votes for a slightly different range of features, they are all consistently named)
• they asked groups of about 30 students, parents, and other community members and half as many teachers.
For question 1, the features that the students think should be included in a logo will vary, depending on how they analyse the information and, perhaps, their own values. What is important is that they can support their recommendations from the data.
A possible aid to analysing the data is to enter the votes for each feature in a table:
The table reveals that:
• four features attracted the most votes: learning, happy students, good teachers, and safety.
Of these, learning and happy students received the most votes of all.
• the highest-polling feature, learning, received no votes from the students surveyed.
• there are only half as many votes by teachers as the other groups. This means that the voting system gives more weight to the views of the other three stakeholder groups.
• even if the teachers’ votes were doubled, this would not affect which features are the top four.
Two possible recommendations would be:
• learning, happy students, and good teachers (omitting safety on the grounds that students won’t be happy unless they are safe);
• happy students, good teachers, and safety (omitting learning on the grounds that students didn’t vote for this feature and/or if the school has good teachers, the students will be learning).
For question 2, refer to the Data Detective poster (see the introductory section) and the Answers.
For question 3, the students may need to check with you or a classmate to ensure that the question/issue they have selected is appropriate. The investigation needs to have a limited scope to ensure that the students can complete it.
Answers to Activity
1. Answers will vary. However, three out of the four groups surveyed ranked “learning” as their favourite or second favourite feature. Every group identified “happy students”, “good teachers”, and “tidy and clean” as favourite features (although with different rankings), so this could be a reason for including one
or more of them in the new logo.
2. Possible answers are:
• Pose a question (Problem):
The students asked “What should be included in the new Te Paki School logo?”
• Plan your investigation (Plan):
The students considered “Who do we ask?” (students, parents, teachers,
community)
• Gather your data (Data):
The students questioned samples of people from the groups identified in the
planning stage.
• Analyse your data (Analysis):
The students collated and graphed the data and looked for patterns in the data
(similarities and differences in the data from each sample).
• Communicate your fi ndings (Conclusion):
Based on their analysis of the data, the students might decide on recommendations
and report these to the principal and board of trustees. They might also have
more questions as a result of their enquiries (which would start the cycle again!).
3. Practical activity
Key Competencies
Logo Appeal can be used to develop these key competencies:
• managing self
• participating and contributing.