The purpose of this activity is to engage the students in a critical evaluation of a statistical investigation, commenting on the validity and relevance of the findings presented graphically, and of the conclusions drawn.
This activity assumes the students have experience in the following areas:
- Calculating sample statistics, such as median, mean, and Inter-quartile Range (IQR).
- Graphing data, with and without the support of digital technology.
- Investigating data-related questions by enacting the Statistical Enquiry Cycle (PPDAC).
- Evaluating statistical reports.
The problem is sufficiently open ended to allow the students freedom of choice in their approach. It may be scaffolded with guidance that leads to a solution, and/or the students might be given the opportunity to solve the problem independently.
The example responses at the end of the resource give an indication of the kind of response to expect from students who approach the problem in particular ways.

Task: This statistical report (included in downloadable file) on injury rates in various sports was prepared by a group of students for a school newsletter.
Evaluate the validity of their conclusions.
The following prompts illustrate how this activity can be structured around aspects of Statistical Literacy.
Data Source
The section is about the reliability of the data sources being used.
- Are the data provided relevant to the claim posed in the report? (The report provides data about ACC claims of teenagers who play different sports.)
- Are the data sources acknowledged and are these sources reliable? (The sources are given and are relaible organisations.)
Evidence for the claim
The section is about the validity of the data and how it is used to support the claim.
- Does the evidence provided justify the claim? (The report uses percentages of players getting injured rather than frequencies. This is a fairer way to calculate the injury rate. However the injury data and numbers of players are not from the same cohort, 15-19 year olds and seconday students playing sport.)
- Is evidence missing that would further validate the claim?
- Are there weknesses in the evidence presented, included other explanations for variations in the data?
Strength of the claim
The section is about the adequacy of the data and other factors than may have influenced the findings.
- Is the data adequate to support the conclusions? (This includes issues about the sampling, such as size and representativeness.)
- Are some factors ignored in the claim? (The work samples raise issues about ommission of other dangerous sports, players who play more than one sport, severity of the injuries, etc.).
- What further investigation is needed to support the claim?
Plan
The planning section is about how students will gather the data.
- How will I go about answering this question?
- What will I need to know?
- How will I find the data that I need? Is the data already available somewhere or will I need to collect it?
- Have I considered ethics so that people’s permission is given, their data is safeguarded, and my data gathering does no harm to them?
- If I need to collect data, how will I measure the characteristic?
- How will I make sure the measurement is as accurate as possible and ‘fairly’ measures the characteristic?
- If I need to construct a survey, have I checked that my questions are clear and not leading (unbiassed)? Have I trialled my questions on a few people first?
- What type of sample will I use? Can I justify why I chose that type of sample?
- How large will my sample be? Will my sample size be large enough, or do I need to increase or reduce it?
- How will I
- Can I predict possible answers to my question, even before I look at data?
- What might my answer look like?
Data
The data section is concerned with how the data is managed and organised.
- What format will I use to organise my data as I gather it, or retrieve it?
- How much time will it take to gather or retrieve my data? Have I got time to do it? Have my subjects got time to give me their data?
- What digital or written tools will help my organise my data? (Consider software and pencil and paper methods)
- How will I protect the data I gather or retrieve so it is safe?
- How will I protect the privacy of the subjects who are trusting me with their data?
- Is some data ‘dirty’ (untrustworthy)? How will I clean my data?
Analysis
The analysis section is about exploring the data and reasoning with it.
- Have I reflected back on my question so I am clear what I am trying to find out?
- Do I get ideas about patterns, differences, relationships and trends from just ‘eyeballing’ the table of data?
- Are my important variables categoric, discrete numeric, or continuous (measurements)?
- How can I display different sortings of my data to look for patterns, differences, relationships and trends?
- What tools will help me to display the data in different ways? What ways are appropriate to my data and help answer my question?
- How might I describe the distribution/s? What language might I use to describe what I see? (Symmetric/Assymmetric (Skewed), spike, trough, etc.)
- Are there differences among distributions in terms of centre, shape and spread? Which measures of those features should I use?
- What variation can I see in my data? What might be the causes of that variation?
- Can I make preliminary statements about my findings, starting with “I noticed that...”
- Am I developing ideas about what the answer to my question might be?
Conclusion
The conclusion section is about answering the question in the problem section and providing reasons based on their analysis.
- Have I answered my original question? If not, why not?
- How might I convince someone else I have answered the question?
- What displays best show what I have found out?
- Is my summary of findings clearly written so others can understand it?
- Have I used displays and measures to support my ideas?
- Do I go back to the context to suggest why the patterns, differences, relationships or trends occur?
- Do I say about the limitations of what I have found out? What can I say and what can’t I say?
- What strategies and tools proved the most useful in my inquiry?
- What other things have I learned and what further questions do I have?
Examples of work
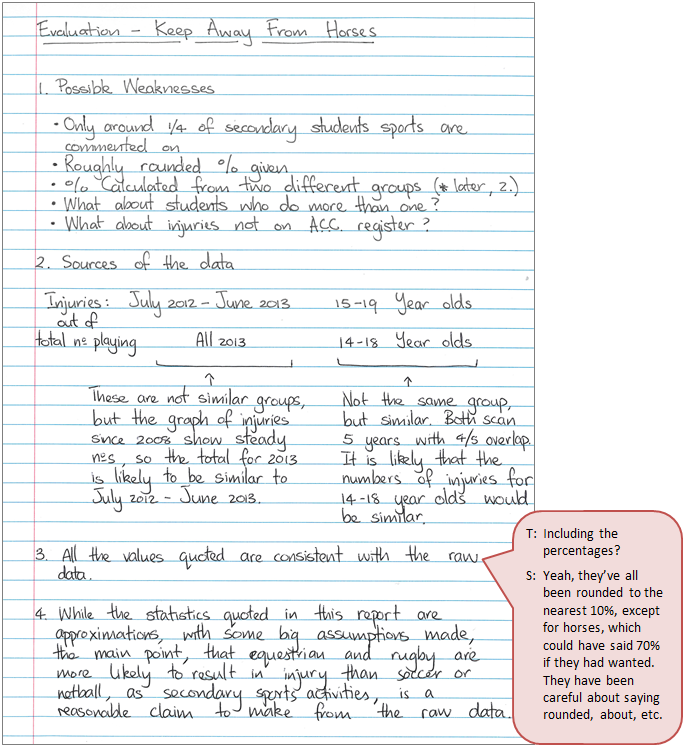
Work sample 1
The student calculates the relevant statistics to confirm the accuracy of the report and to comment on the validity of conclusions drawn.
Click on the image to enlarge it. Click again to close. 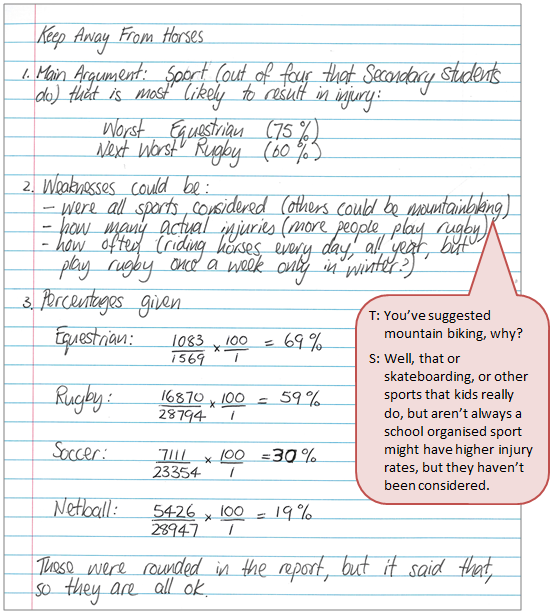
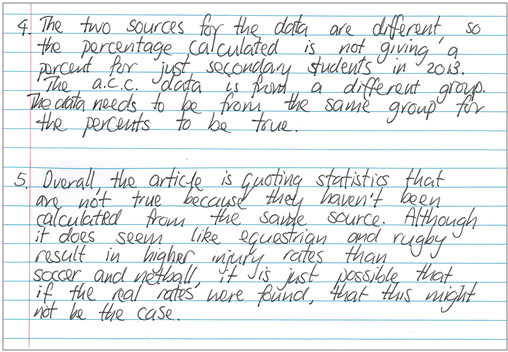
Work sample 2
The student comments on the validity of the conclusions, linking the relevance of the statistics calculated to the context of the investigation.
Click on the image to enlarge it. Click again to close.