This is a level 4 algebra strand activity from the Figure It Out series.
A PDF of the student activity is included.

Click on the image to enlarge it. Click again to close. Download PDF (260 KB)
construct a table and graph to interpret relationship
computer spreadsheet
FIO, Level 4, Algebra, Book Three, Holiday Pay, page 24
In this activity, the students first construct a table and then a graph to compare two offers of pay for selling CDs. It is expected that each day Jane will sell $600 worth of CDs. So, if Jane were to accept offer 1, each day she would get 10% of the difference between $300 and $600, that is, 10% of $300, which is $30. Offer
2 is very different. For sales of $600 on day 1, she would get 1% of the difference between $100 and $600, that is 1% of $500, or $5. On day 2, she would get 2% of $500, or $10, on day 3, she would get 3% of $500, or $15, and so on.
A table for students to complete by entering the results of their calculations is begun for them. Some students may instead want to use a computer spreadsheet for this purpose. The first spreadsheet below shows formulae for calculating the values shown in the second spreadsheet.
.gif)
Notice that by day 11, the pay for offer 2 has caught up with the pay for offer 1. The total pay for each offer is then $330. After day 11, the total pay for offer 2 quickly outstrips the pay for offer 1.
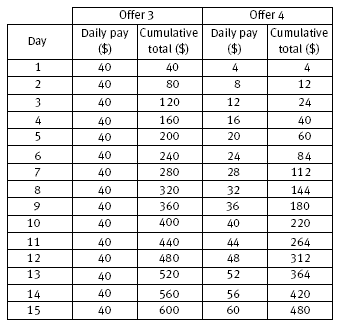
In question 3, the students investigate the effects of two further offers. For all offers, it is assumed that each day Jane would sell CDs worth a total of $600. If she were to accept offer 3, then each day she would get 10% of the difference between $200 and $600, that is, 10% of $400, which is $40. For offer 4, on day 1, she would get 1% of the difference between $200 and $600, that is 1% of $400, or $4, on day 2, she would get 2% of $400, or $8, on day 3, she would get 3% of $400, or $12, and so on.
The next spreadsheet shows the pay for all four offers for up to 4 weeks or 20 working days.
.gif)
The pay for each of the offers up to 15 days and also up to 20 days is highlighted. Notice that for 15 days, the pay is the same for offers 2 and 3 and that by day 19, the pay is the same under offers 3 and 4. However, by day 20, offer 2 is by far the best offer. It provides $1,050 for working 20 days and is $210 more than for offer 4, the next best offer.
While offers 2 and 4 provide more than the other two offers as time goes on, in the long term, they are unrealistic. The students may want to check this out. They will find, for example, that by day 250, that is, after 50 five-day weeks or about 1 year, the total pay will be as follows:
.gif)
Note that the total value of sales of $600 worth of CDs per day for 250 days is $150 000. Clearly, offer 2 would have the business operating at a loss. The same is likely for offer 4.
It may be argued, however, that offers 1 and 3 are also unrealistic because, in the long run, they may be much too low to attract employees to sell CDs. The students might find it interesting to use a spreadsheet to explore a range of more realistic offers.
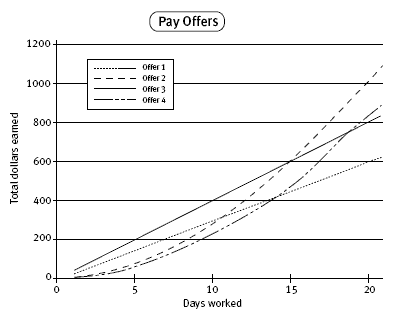
The students will find that the graphs for offers 1 and 3 are straight lines but the other graphs gradually curve upwards since the values for total pay increase exponentially. These curved graphs show that the total pay increases at a gradually increasing rate after each day. This is one reason that pay offers such as these are unsustainable in the long term.
Answers to Activity
1. a.
.gif)
b. See completed graph for question 3a below.
c. For 10 days, offer 1 is best. (Jane could make $300 with offer 1 and $275 with offer 2.)
d. For 11 days, Jane can make $330 with either offer.
2. For 3 weeks (15 days), offer 2 is best. Jane could make $600 with offer 2 and $450 with offer 1.
(The graph above has been extended to 20 days so that it can be used in 3b.)
Reports will vary, but the following points should be noted:
A comparison of all four offers shows that offers 2 and 3 would both give Jane the same pay for 15 days, and both are more than the other offers.
After 15 days, offer 1 would be $450, offers 2 and 3 would be $600, and offer 4 would be $480.
b.
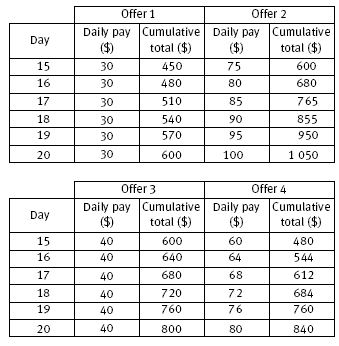
Jane is unlikely to be offered the choice of offer 2 for 4 weeks, as she would earn $450 in the fourth week.
It would take 19 days for offers 3 and 4 to be equal ($760), but in day 20, offer 4 would give $840 compared with $800 for offer 3. However, by day 18, Jane could make $855 from offer 2, which exceeds the best that she could make in 20 days from offer 4 ($840). By day 20, offer 2 would give $1,050 and offer 1 would give only $600.