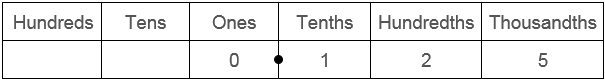
This unit supports students to understand the place value structure of decimals and to carry out addition and subtraction with decimal numbers to three places.
- Understand that decimals are a kind of fraction.
- Add and subtract decimals to three decimal places.
- Find decimal values for fractions through practical modelling.
The decimal system uses repeated, equal division into ten parts to create smaller units. Dividing one metre into ten equal parts creates deci-metres, a unit that is used in Europe but seldom in New Zealand. A decimetre is one tenth of a metre. If one decimetre is cut into ten equal parts, the parts are called centimetres. That is because 100 centimetres compose one metre (one tenth of one tenth equals one hundredth or 1/100). A height of 1.78 metres is a combination of 1 whole metre, 7 tenths of one metre, and 8 hundredths of one metre.
Decimal fractions underpin most of the units used in the Standard International (SI) system of measures. For example, one kilogram equals 1000 grams, so one gram is 0.001kg (one thousandth of a kilogram). One litre of water has a mass of one kilogram. Therefore, 1g is the mass of 0.001L (litre) of water, otherwise known as one millilitre. Milli is the Latin prefix for one thousandth.
There are subtle differences in the way decimals behave compared to whole numbers and reliance on whole number thinking is the key cognitive obstacle for students working with decimals. Ordering decimals is a good example. With whole numbers 7<81<657 but it is incorrect to order decimals by ‘longer is bigger’ strategies. 0.81 is greater than 0.7 but 0.657 is not greater than 0.81. Similarly, methods of calculation used with whole numbers must be changed to accommodate decimal fractions. For example, 7 + 28 = 35 but 0.7 + 0.28 ≠ 0.35. The decimal point needs to be thought of as a marker for the ones place, rather than as a ‘separator’ that keeps the whole numbers and fractions apart.
Two key concepts must be connected for students to understand decimals and how to operate on them. Whole number place value must be extended to tenths, hundredths, thousandths, and so on (following the structure of the base 10 system). This must include recognition that units are nested in other units, e.g. 2.35 has 23 tenths (23.5 tenths to be exact). Equivalent fractions are applied to compare decimals by size, e.g. 0.81 is composed of 8 tenths and 1 hundredth, since 8/10 = 80/100, 0.81 equals 81/100 (81 hundredths).
Students can be supported through the learning opportunities in this unit by differentiating the nature and complexity of the tasks, and by adapting the contexts. Ways to support students include:
- using physical objects to connect decimals, as numbers, with physical quantities. Length is used as the model in this unit though area models, such as decimats, and volume models, such as place value blocks, can also be used. The greater the number of dimensions of a model, the more abstract the representation is. Starting with length is a sensible first step
- directly modelling how the written representation of a decimal reflects the place value structure. Explicitly link the place of each digit with its fraction name, e.g. hundredths, and with the part of the physical model that digit refers to
- using calculators to confirm predictions about the results of adding and subtracting decimals. Where differences between predictions and outcomes occur, ask students to work out where their predictions went awry. This strategy helps to cause cognitive conflict and address common misconceptions
- encouraging students to work collaboratively (mahi tahi) in partnerships. Students need time to develop mathematical arguments and to rehearse those arguments with a peer is important for developing clarity and risk taking. Ensure students have chances to experience both tuakana and teina roles with their collaborative partner
- restricting the domain of numbers being investigated. Work with tenths initially to support students to see the connectedness of place values across the decimal point, and to rename decimals in ‘nested ways’, e.g. 1.4 equals 14 tenths. Progress as rapidly as possible to hundredths and thousandths.
- providing formats for recording that scaffold a process. Steps in addition and subtraction of decimals can be complicated, especially where renaming is involved.
- folding in and out of different levels of abstraction, i.e. materials, images (diagrams), equations. Use symbols as a means of connecting across situations. Thinking with patterns in equations, and reasoning about why patterns occur, is at the heart of mathematics.
The contexts for this unit are about lengths (heights). Most students find personal data interesting though caution is needed around using measurements such as body weight. Decimals occur through measurement. You might choose contexts that engage your students. For example, Census At School collected data about the weight of school bags, reaction times, and foot lengths. You might also look at populations of countries expressed as millions, e.g. 5.38 million, at distances of planets from the sun in astronomical units, at the number of gigabytes in movie downloads, or the areas of pieces of land in hectares or heights of different sportspeople. Choose contexts that engage your students' cultures and interests.
Te reo Māori vocabulary terms such as tau ā-ira (decimal number), ira ngahuru (decimal point), and uara tū (place value) could be introduced in this unit and used throughout other mathematical learning.
- Adding machine tape (metre long strips) or metre long straws (if available) and pipe cleaners for joining.
- Calculators
- Metre rulers
- Scissors
- Post-it notes
- Paper clips
- Pencils
- Copymaster 1
- Copymaster 2
- Copymaster 3
- PowerPoint 1
- PowerPoint 2
- PowerPoint 3
- PowerPoint 4
- PowerPoint 5
Session One
Students should work through Getting Partial to Fractions before starting this unit as the first activities rely on a length model developed in the earlier unit.
- Begin with PowerPoint 1. Slide One shows Scott Barrett who is 1.98 metres tall. Some students may know that this means 198 centimetres. You might measure the length horizontally with two metre rulers to establish that 1.98 metres is 2cm shorter than 2 metres. A student might lie beside the measure to see how tall Scott is compared to a young teenager.
- Slide Two shows how the length units in the metric system are derived. One metre is divided into ten equal parts (to form tenths) called decimetres. One decimetre is divided into ten equal parts (to form hundredths) called centimetres. One centimetre is divided into ten equal parts (to form thousandths) called millimetres. Ask predictive questions as you work through the slide, such as:
What will the next place to the right be? Explain why?
How many of this sized unit fit in one whole metre? What will the unit be called?
These derivations could also be modelled using decipipes. Many decipipe sets use equivalent measures i.e. one unit = 1 metre, one tenth unit = 1 decimetre, and one hundredth unit = 1 centimetre. - Provide the students with a 1 metre length of receipt machine tape and scissors. A better alternative, if available, is metre long straws which are sold at some dollar shops.
Use your folding skills to create decimetres. Label them as 0.1 (1 tenth) except for the last one. Make the decimetre lengths with the scissors.
Take the last decimetre and fold that into centimetres. Label them as 0.01 and cut them out. - Give the students time to create decimetres and centimetres. Challenge them to use the units and metre rulers to measure their own heights and express them as decimals of metres, e.g. 1.53m. Tell them to record their height on a post-it note, and stick the note to the whiteboard.
Watch for students to:- Recognise that they move to smaller units for greater precision: metres to decimetres to centimetres;
- Record the measure correctly as a decimal;
- Explain the meaning of each digit in the decimal, e.g. 1.62 has six in the tenths place and 2 in the hundredths place.
- Gather the class and look at the data. Choose heights at random and challenge two students to make the height on the floor using the created units or the decipipe equivalents. Other students can explain the meaning of the digits. You might ask the class who they think is the height you chose.
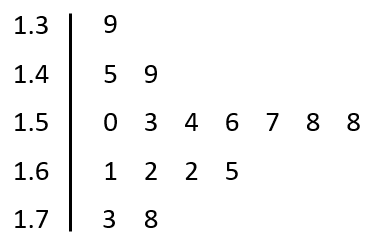
How might we sort these data? - Students might suggest ordering the decimals from smallest to largest. You might use the data to create a display. The post-it notes can be cut to form a stem and leaf plot.
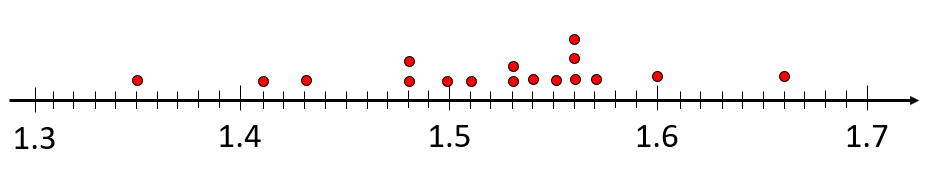
- Students might add their height to a dot plot. Online graphing packages and tools (e.g. Google Sheets, Microsoft Excel) allow you to load the data into a CSV (Comma Separated Variable) spreadsheet and import the file for graphing.
- Discuss the data displays, including:
- The shape of the distribution which should be roughly bell shaped (normal)
- Centre (Median as a measure of average)
- Meaning of decimals like 1.50 and 1.70 and how these numbers are usually not written with the right-hand zero (Why is the zero redundant? Presence of a zero indicates a degree of precision and rounding.)
- Put the students into collaborative groups of four. Set each group the challenge of representing the height of each person in their group in this way:
Make each height using metres, decimetres and centimetres, or the decipipe equivalents.
Record each height like this: 1.56m = 1 + 5 tenths + 6 hundredths.
Imagine that your group was joined ‘head to foot’ – What is your combined height? - Give the students adequate time to complete the task before gathering the class together. Look for students to:
- Correctly name the decimal fractions that make up a decimal number
- Recognise that ten hundredths combine to make one tenth, and ten tenths combine to make one (whole)
- Gather as a class and find the tallest team. The task requires each group to justify how they know their combined height is correct. The points above should emerge.
- Finish the session with the last two slides of PowerPoint 1.
The first challenge is to order the heights of four teenagers. Can your students correctly name the teenagers by looking at the place value structure of the decimals?
e.g. 1.8m is taller than 1.65m. By how much?
The second challenge has four aspects, including finding decimals with a given difference, and planning an ordering strategy. A key point is that ten hundredths combine to make one tenth, e.g. 1.57 + 3 hundredths = 1.6.
Session Two
In this session students explore addition and subtraction of decimals.
- Begin the session by building the height of the world’s tallest recorded man and woman and the world’s shortest recorded man and woman. Use the metres, decimetres and centimetres made in session one or decipipe equivalents.
- Use PowerPoint 2 to introduce the story of Robert Wadlow. Let students estimate Robert’s height using benchmarks in the photograph, such as the doorway or the poster frame.
How high is the doorway?
How tall is Robert? - Write 2.72m on the whiteboard. Ask students to explain what the digits mean, i.e. 2 metres, 7 decimetres (tenths), and 2 centimetres (hundredths). Mark Robert’s height on the floor.
Recall that Scott Barrett is 1.98m tall? How much taller is Robert than Scott? Compare Steven Adams' height of 2.11m with Scott and Robert - Make 1.98m and build onto the model until 2.72m is reached. Watch Slide Two of PowerPoint 2 to see how a length model can be used to show the difference. Ask your students to record the jumps on an empty number line and work out the total difference (0.02 + 0.72 = 0.74).
- Ask your students to work out the difference between their height and Robert’s height. Some students might need to use the decimetre and centimetre pieces from the previous session to support their calculations and check their answers. Encourage collaboration (mahi tahi) and the use of empty number lines to track calculations.
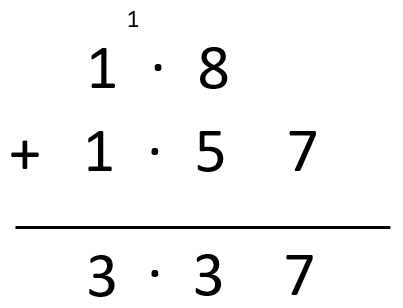
- Slide Three of PowerPoint 2 introduces addition of decimals through combining heights (or lengths). The addition modelled is 1.8 + 1.57 = 3.37m. Rufus’ comment illustrates a common difficulty when students treat the numbers to the right of the decimal point as a set of whole numbers, ignoring the place values of the digits.
Is Rufus correct? Explain.
Why does Barbara say the answer must be more than 3 metres?
How does she know?
What should the answer be? - Build the two heights of Rufus and Barbara using the metre, decimetre, and centimetre lengths. Discuss how the combined height can be found. There are two main approaches; jumping and standard place value. Jumping is illustrated on Slide Four of PowerPoint 2. Standard place value involves combining like units (ones, tenths, hundredths) and is the basis of the written algorithm. The strategy is illustrated on Slide Five. You might illustrate how the steps can be written as a vertical algorithm. When introducing these strategies, consider the part-whole strategies already used by your students when adding whole numbers. You may choose to focus on one strategy, and then introduce other strategies as needed. Whilst all students will benefit from understanding how to use a vertical algorithm, their continued success with this method will depend on their knowledge of place value. Therefore, these strategies may require significant modelling and additional teaching with whole numbers and decimals.
- Slides Six, Seven and Eight involve the addition of 1.72 + 1.79 = 3.51. The problem involves two lots of renaming, ten hundredths into one tenth, and ten tenths into one (whole). Work through the slides with your students asking them to predict what will happen as much as possible.
- Put your students into groups of three or four.
Your task is to work out some combined heights. First try all the pairs of people you have in your group, then try the whole group combined. Use the metre, decimetre, and centimetre strips, if you need. Record the answers you get using either a number line or written algorithm. - After a suitable time bring the class together.
When two heights are added what is the usual range for the sum?
Why is the sum usually 3.0 – 3.5 metres? (The average height of 11-13 year olds in New Zealand is about 1.6 metres) - For further practice students might work from Gentle Giants (Figure It Out, Link, Book 5, Page 18). Alternatively, you might look at the heights of other students, or of students favourite sportspeople. Graph the heights using a dot plot, and box and whisker. The median height of Year 7-9 students is about 1.59m.
Is the average different for males and females?
Session Three
In this session your students look at the two situations to which subtraction of decimals can be applied, partitioning (separating) and difference. The range of decimals is still constrained to hundredths.
- Show your students a Barbie Doll and Slide One of PowerPoint 3.
Compare the proportions of the Barbie doll with the normal proportions of a female. What do you notice? - Some students may have heard of controversy surrounding the proportions of the Barbie Doll. A lot of criticism focuses on how the Barbie doll proportions create unrealistic expectations around body image, e.g. long neck, narrow waist, leg length compared to body length. Many videos are available about the controversy including attempts to sell more realistically proportioned dolls.
Look at the diagram of normal proportions for men and women.
What do you notice? - The proportions of an adult female and male are based loosely around the length of the head. A full person is about eight times that length. The distance from top of head to navel is about three eighths of the full height. Students might detect other relationships.
- Look at Slides Two to Four of PowerPoint 3. Ask your students to estimate the measures first and state those measures in decimals of one metre.
What will the rest of Aisla/Barbie measure? Share your strategy.
Subtraction is the most obvious strategy since part of Aisla or Barbie is removed, leaving the rest. For example, 1.76 - 0.9 = 0.86m gives the length from Aisla’s hip to the top of her head. - Next, tell your students to imagine that the length from their navel to their head is removed (see Slide Six).
Measure the length from your navel to the top of your head, and subtract that length from your height. What will the difference tell you? Show your working and answers in decimals of one metre. - Let your students collaborate practically on the task in small groups. Only allow them to use the metre, decimetre, and centimetre pieces they created previously (or decipipe equivalents) to measure the navel to head length. The measures can be checked with a metre rule, and calculations with a calculator, later if necessary. Look for students to apply decimal place value:
- Do they record the measures in correct decimal notation that matches the units they use? e.g. Six decimetres (tenths) and seven centimetres (hundredths) is written as 0.67m.
- Do they subtract correctly to find the differences? e.g. 1.7 – 0.67 = 1.03
- After a suitable time, gather the class to highlight a few good examples from your observations. Ask your students to work through Copymaster 1 to demonstrate their ability to find differences with decimals.
Session Four
In this session students expand their knowledge of the decimal system to include thousandths. The need for smaller units is inspired by a need for more accuracy. Your students will need access to strips of paper that are exactly one metre long.
- Being by folding a single one-metre strip in half.
How long is one half?
Some will say 50cm which is correct. Write 50/100 and ask what the fraction is referring to. Note that one half and fifty one-hundredths are equivalent fractions. - Ask: How is one half written as a decimal?
Many students know that one half equals 0.5. Performing 1 ÷ 2 = 0.5 on a calculator confirms that.
What does the five mean? (five tenths) - Model aligning five decimetre pieces with one half of one metre. Record the finding like this:
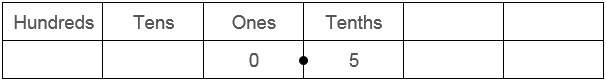
- Model folding one half in half to get quarters. If one half equals 0.5 then what is the decimal for one quarter?
How long is one quarter? - Some will say 25cm which is correct. Write 25/100 and ask what the fraction is referring to. Note that one quarter and twenty-five one-hundredths are equivalent fractions.
What is the decimal for one quarter? - Model aligning two decimetres and five centimetres to match the one quarter fold line.
If one quarter equals 0.25 then what is the decimal for three quarters? - Progress in the same way to eighths by folding quarters in half. The calculator gives 1 ÷ 8 = 0.125. Challenge your students to discuss in pairs why the decimal is that and what each digit, 1, 2, and 5, refers to. Students are likely to know that millimetres are also on a ruler. Millimetres are one thousandths of one metre.
- Record the decimal for one eighth like this:
- Expect students to align one decimetre, two centimetres and five millimetres with the one quarter fold. Note that millimetres are very small units so you might mark them onto a one centimetre length.
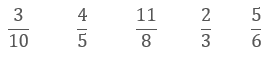
- Set the following challenge: By folding one metre strips and measuring with decimetres, centimetres and millimetres, work out what each of these fractions will be as decimals.
- Watch as your students collaborate (mahi tahi) in groups of two or three. Do they…?
- Correctly fold the one metre lengths into unit fractions, such as tenths and fifths;
- Anticipate how many tenths, hundredths or thousandths will be needed to make the unit fraction;
- Check their anticipation by considering how many times their prediction will fit into one, e.g. If 0.125 (125 thousandths) equals one eighth, then 8 x 125 should equal 1000;
- Use multiplication to anticipate what the decimal for the non-unit fraction will be, e.g. If 1/5 = 0.2 then 4/5 = 0.8 because 4 x 2 = 8;
- Recognise that 11/8 is greater than one;
- Notice that one third cannot be made exactly, even with thousandths, since 3 x 333= 999 not 1000.
- If groups finish early challenge the students to find the decimals for:

- Gather the class to discuss what they have found out, with a focus on the points above. Answers can be checked by measuring with decimetres, centimetres, and millimetres, and on a calculator using division, e.g. 4/5 = 4 ÷ 5 = 0.8. Students should notice that thirds, sixths and ninths produce recurring decimals. Sevenths also produce recurring decimals, but the element of repeat is harder to find, e.g. 1/7 = 0.142857142857142857
- PowerPoint 4 introduces things that might be measured in millimetres. Discuss how the scale in each picture can be used to estimate the measurement in millimetres then write that measurement in decimals of one metre, e.g. 45 millimetres can be written as 0.045m.
- Copymaster 2 contains problems of anticipating sequences with decimals. Let your students complete the Copymaster without a calculator first. Look to see if they:
- Anticipate further members of each sequence by adding on the increment;
- Notice when renaming between decimal places will occur;
- Explain why the length of decimals increases or decreases due to renaming.
Session Five
In this session students apply their knowledge of decimals to three places to solve addition and subtraction problems. They investigate rainfall patterns for different locations in New Zealand then play a game that involves addition and subtraction of decimals.
- Look at PowerPoint 5. Rainfall is measured in millimetres (thousandths of one metre). The rainfall for a location is the depth of water that lands on the surface area. Millimetres are used as they provide adequate precision and the numbers for a daily fall tend to be manageable whole numbers. On slide four annual average rainfall for many locations is given. Ask your students:
Is there any pattern to the rainfall in New Zealand? (East Coast tends to be drier than West Coast)
Which locations have the highest/lowest rainfall? - Take one location and use a ruler to work out the height of the rainfall. Wellington is a good choice at 1 215mm as that is more than one metre (1.215m).
How would Wellington’s annual rainfall be written in metres? - Ask your students to write each annual rainfall in metres. Take particular interest in how students deal with the rainfall of Blenheim (720 thousandths equals 0.72 metres).
- Pose these problems:
Add the rainfalls of Tauranga, Gisborne, and Napier. Give the answer in metres.
Hemi claims that the Eastern North Island gets nearly 3m of rain per year. Is he right? Explain. (It is not legitimate to add the rainfall of different locations). - Look for students to add the decimals correctly, with understanding of renaming place value units, e.g. 1.177 + 0.979 = 2.156m, 2.156 + 0.776 = 2.932m. Some students may add whole numbers of millimetres then convert the answer to metres. Students should realise that the depth of rainfall will be spread across the total land area so the ‘evened out’ rainfall for the region is closer to 1.0m per year.
- The mayor of Christchurch claims the title of “New Zealand’s driest city”.
“We get more than 10cm less rain than the next driest city, and half the rainfall of Auckland,” she says.
It’s all very confusing. Is she right? - Look for your students to identify Christchurch and Blenheim as the two driest locations on Slide Four. The difference in rainfall is 0.72 - 0.618 = 0.102m which is two millimetres more than 0.1 (one decimetre or ten centimetres). The difference between Auckland and Christchurch’s rainfall equals 1.211 – 0.618 = 0.593. Therefore, Christchurch has a little more than half the rainfall of Auckland.
Alexandra is not a city, but it gets only 0.335m of rain per year.
How much less rain does it get than Christchurch? - Challenge your students to calculate other differences between the rainfalls of locations on slide four of PowerPoint 5.
- Students may like to compare the difference in rainfall data from their home region or a place they whakapapa to with data from a region of Aotearoa they have iwi, hapū or whānau connections with.
- Next, introduce the Hare and Tortoise Race (Copymaster 3), a game for practising the addition and subtraction of decimals. Students need a photocopy of the track, a spinner sheet, a paper clip, and a pencil between two players.
- The paper clip makes the spinners. Bend one end of the paper clip out and anchor the other end loop with a pencil tip. Flick the paper clip to make it spin. Spinners need to be centred in each circle of the board.
- One player is the tortoise and the other player is the hare. Players take turns to spin a decimal for the other player. Both spinners give a combination of digit, e.g. 7, and fraction, e.g. tenths, that give the distance to travel, 7 tenths or 0.7. The non-spinning player adds that distance onto their existing destination to reach a new point. The addition should be recorded as a loop on the track sheet, with both the distance and the destination recorded as decimals of one metre.
- The only exception occurs if the spinner lands exactly on a line between sectors. In that case the spinning player nominates one of the fractions either side of the line, e.g. the spinner lands on the line between tenths and hundredths, and the spinning player chooses hundredths. In these situations, the distance is subtracted from the existing destination. The player goes backwards in the race.
- Both the hare and the tortoise start on zero. The first player to cross the finish at ten, wins the game.
Extras
For further development of decimal understanding students should attempt the four e-ako modules that cover addition and subtraction of decimals using a decimat model (AS4.10, AS4.20, AS4.30, AS4.40). That is best done over four days. Each module takes around 20 minutes to complete.
Create 2.8 and Decimal Lineup can be sent home as practice games for students to play with their family.
Dear family and whānau,
This week we have been exploring decimals and how to add and subtract those numbers. We will be measuring lengths in metres, including our heights and rainfalls for different towns.
During the unit we will learn that decimals behave differently to whole numbers when we add and subtract them. However, our knowledge of whole numbers will still come in very handy.