This is a level 3 statistics activity from the Figure It Out series.

Click on the image to enlarge it. Click again to close. Download PDF (267 KB)
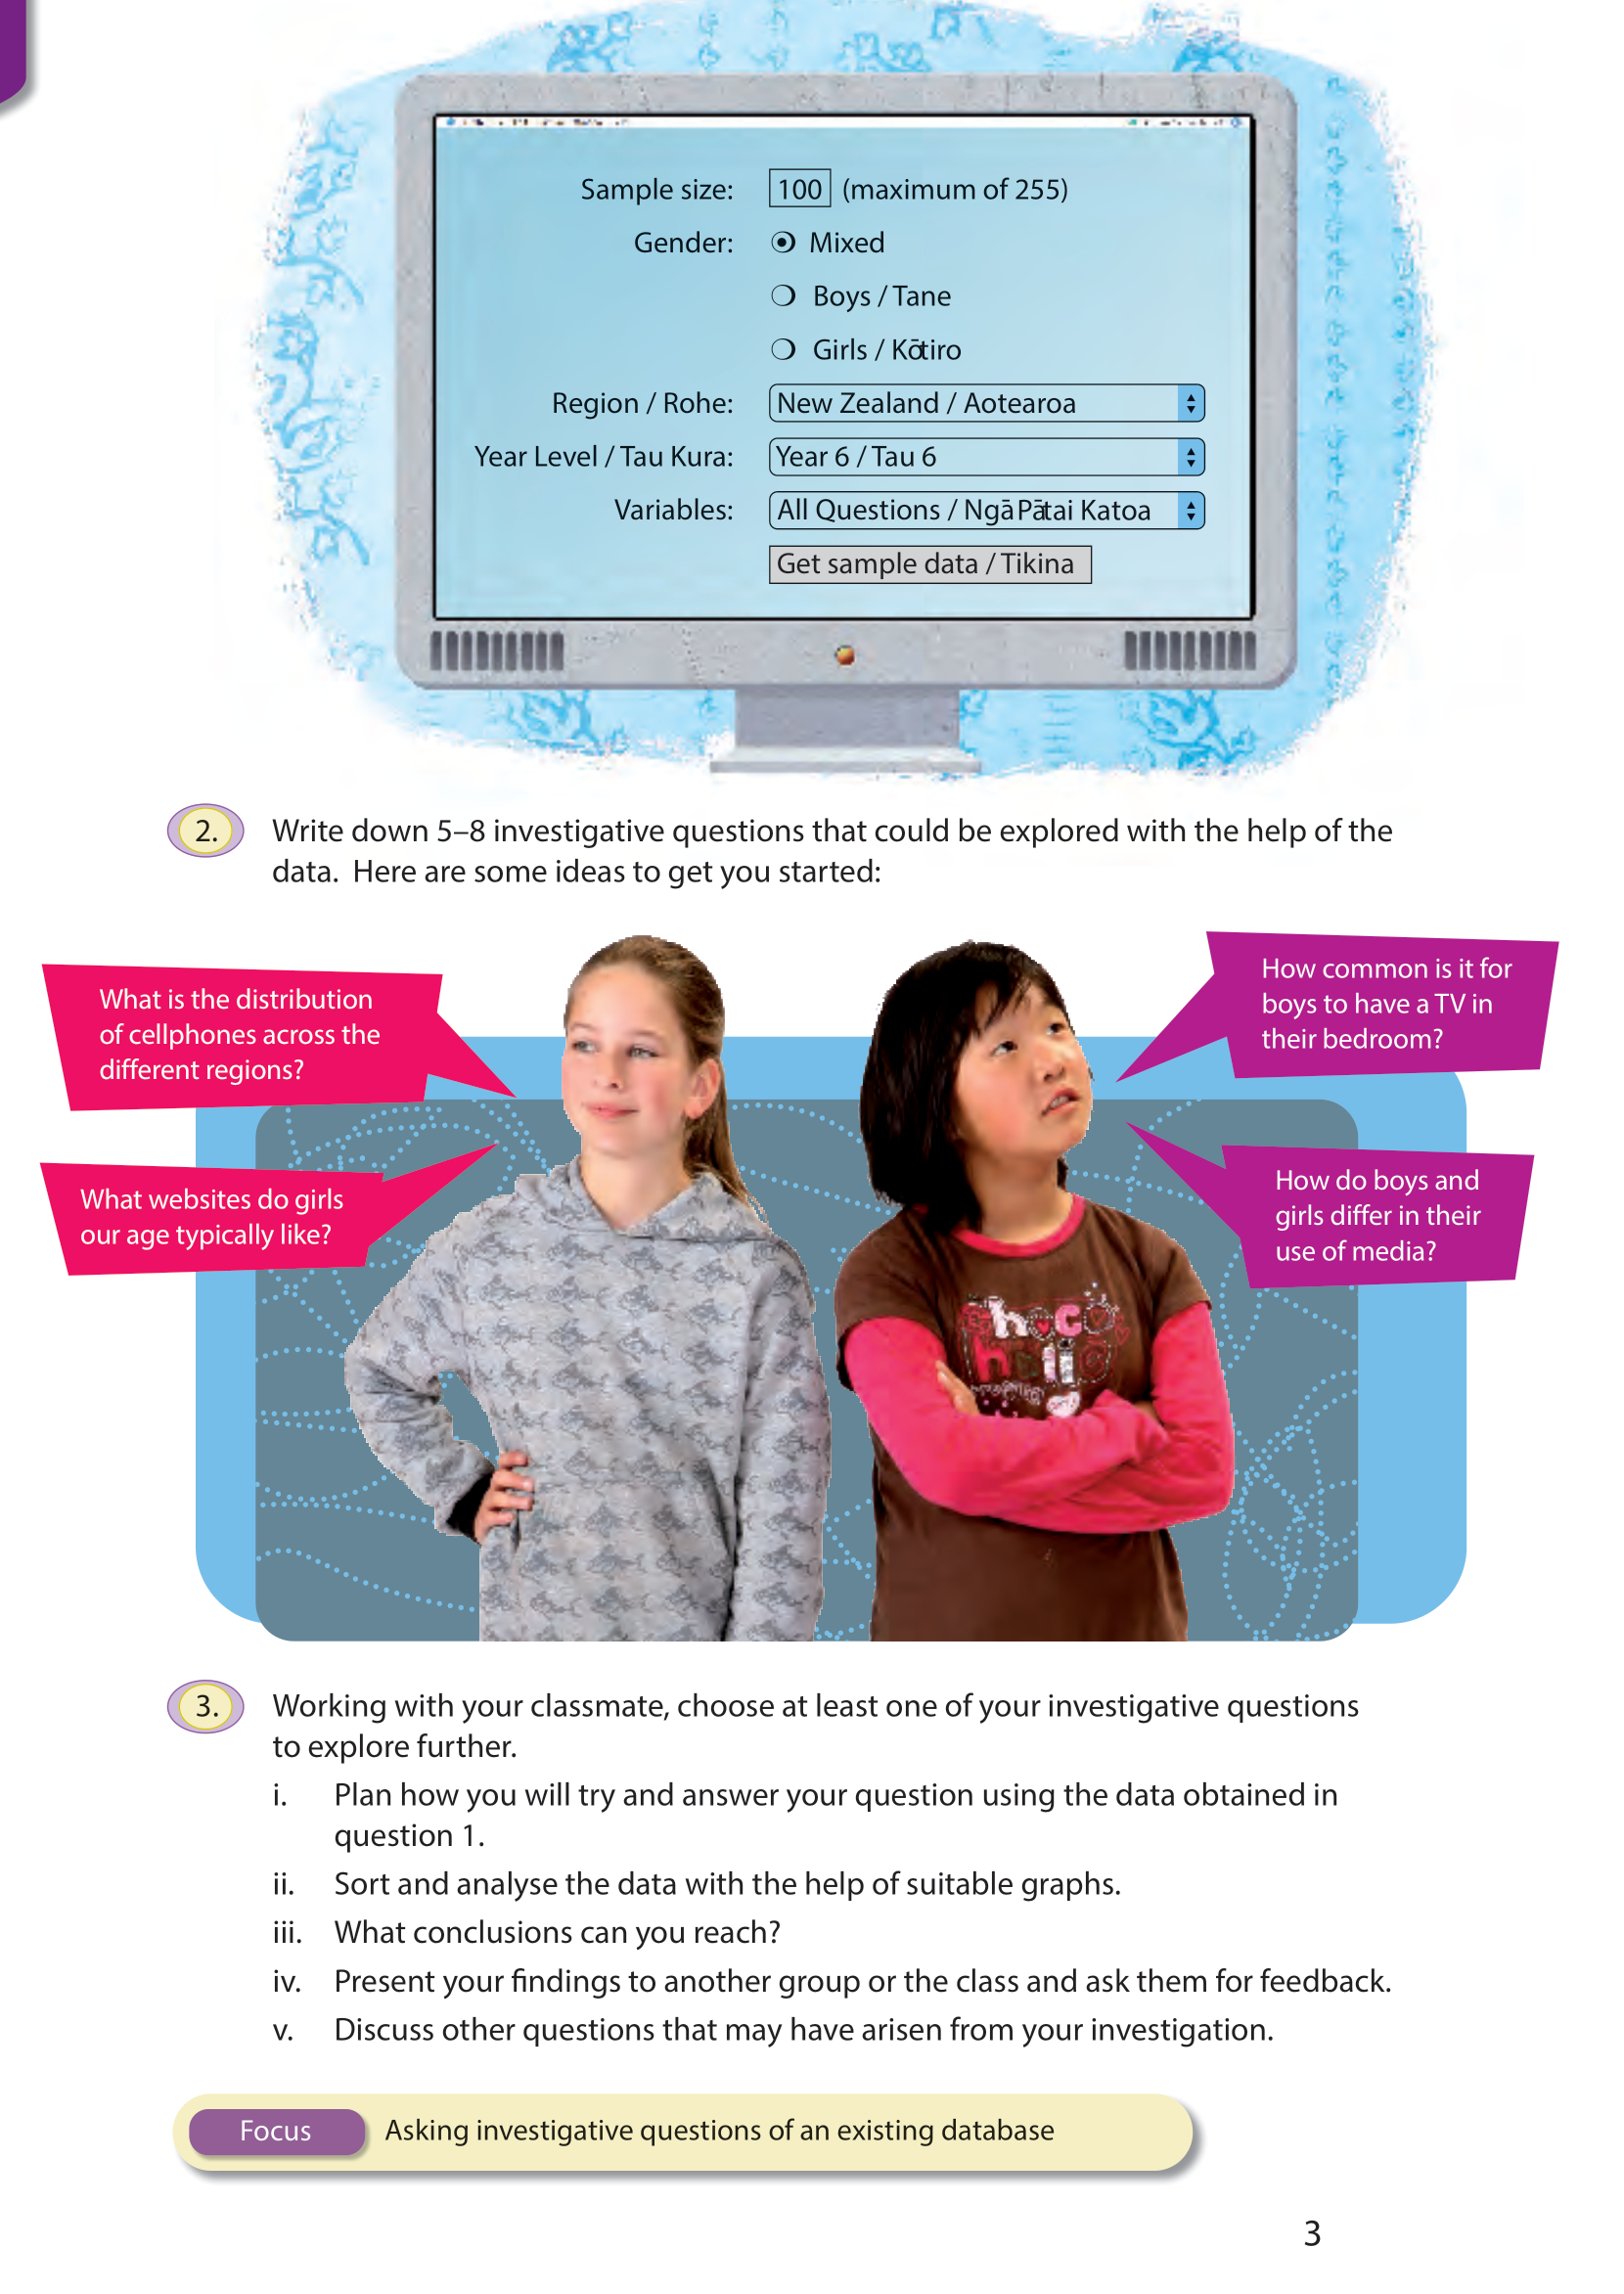
write investigative questions
make a conclusion
This diagram shows the areas of Statistics involved in this activity.
.gif)
The bottom half of the diagram represents the 5 stages of the PPDAC (Problem, Plan, Data, Analysis, Conclusion) statistics investigation cycle.
Statistical Ideas
CensusAtSchool involves the following statistical ideas: using the PPDAC cycle, multivariate category and numeric data, and a range of graphs and communicating fi ndings.
A computer spreadsheet/graphing program
Access to the internet
FIO, Levels 3+ - 4, Statistics in the Media, CensusAtSchool, pages 2-3
A classmate
In this activity, students explore the database on the CensusAtSchool website. This database has at least three qualities that make it particularly suitable for statistical explorations by both primary and secondary school students. Firstly, it is huge, removing the need for students to spend time collecting large amounts of data for themselves. Secondly, it introduces the concept of sampling because the database is too big for students to explore in its totality. Thirdly, the database relates directly to the activities of others of their own age.
The data for this activity needs to be downloaded from the CensusAtSchool website www.censusatschool.org.nz. Students download a random sample of responses, keep the demographic data, such as age, gender, year, and location, and the questions relating to media, and delete the data for all the other questions (because it is not relevant to this activity).
In this case, the data sample contains 100 records, which is convenient for a pair of students to collate and analyse. (It also makes calculations and percentage comparisons very easy!) In general, the bigger the sample, the clearer the patterns and relationships become.
You may need to help your students to decipher some of the abbreviated column headings when they are building their media summary tables in question 1b. It could be a good idea to allow them time to try the random sampler and build summary tables before they start the actual activity.
Before the students work through questions 2 and 3, you may need to revise the PPDAC cycle with them. For these questions, the students need to pose and explore investigative questions. Using the starter “I wonder …” is useful. At this level, questions can be either summary or comparison questions. Examples of summary questions are:
- I wonder what TV shows are typically favoured by year 7 students?
- I wonder what websites are typically favoured by year 9 students?
- I wonder how much year 8 girls typically spend on cellphones each month?
Examples of comparison questions are:
- I wonder if year 8 girls typically send more text messages than year 8 boys?
- I wonder if parents typically pay for the cellphone usage of younger students more than for that of older students?
- I wonder if high school students typically send more text messages than intermediate school students?
- I wonder if year 9 and 10 students typically send more text messages than year 11 and 12 students?
Note: You will need to discuss the meaning and use of the word “typically” in investigative questions. It acknowledges that there are exceptions to virtually every trend. Even if it is generally true, for example, that “Year 10 students like reality TV shows”, there will be plenty of year 10 students who don’t. For this reason, “Year 10 students typically like reality TV shows” is a statement that better describes the data.
In their analysis, the students will draw a variety of graphs, depending on the data they have selected. They should write “I notice ...” statements describing the shape, spread, and middle of the data and should cite any appropriate statistics that they have calculated.
As part of question 3, the students are required to reach conclusions. They should be answering the investigative question they posed, supporting their answer with evidence from the analysis.
Ensure that the students complete the PPDAC cycle by discussing other questions that arise from their own and others’ investigations.
Extension
The CensusAtSchool database allows for comparisons between year groups (for example, years 6 and 8) and between census years (for example, 2007 and 2005). The only catch is that the questions are different for each census, so only some comparisons are possible. You could challenge your students to devise and carry out an investigation that involves cross-group or cross-year comparisons. A number of other countries also offer CensusAtSchool. Students may like to do a comparative investigation between New Zealand and another country.
Answers to Activity
1. a. Media questions discussed will vary, depending on the most recent survey available on CensusAtSchool.
b. Practical activity
2. Investigative questions will vary. As well as those on the student page, examples are:
- What kinds of TV programmes do students of my year typically like?
- How much do girls in my year group typically spend on cellphones each month?
- Are boys in my year group more likely to have a game console than girls?
- Where do students in my year group typically get the money to pay for their cellphone use?
3. Investigations, graphs, and conclusions will vary. When you are giving feedback to other students, evaluate their use of the PPDAC cycle, the quality of their presentation, and the appropriateness and clarity of the graphs they have created. Remember to keep the tone of your feedback positive!