In this unit we investigate the amount of water contained in a carrot and we use a time series graph to plot the "weight" of the carrot as the water in the carrot evaporates. The students also pose their own carrot investigative questions.
- Plan a statistical investigation using the PPDAC cycle.
- Choose an appropriate data display (bar graph, dot plot, time series graph).
- Make statements about the findings of the investigation.
The key idea of statistical investigations at level 3 is telling the class story with supporting evidence. Students are building on the ideas from level two and their understanding of different aspects of the PPDAC (Problem, Plan, Data, Analysis, Conclusion) cycle – see Planning a statistical investigation – level 3 for a full description of all the phases of the PPDAC cycle. Key transitions at this level include posing summary and time-series investigative questions, and collecting and displaying multivariate and time-series data.
Summary or time-series investigative questions will be posed and explored throughout this unit. Summary investigative questions need to be about the group of interest and have an aggregate focus. For example, How many seeds are in a carrot packet? What do carrots weigh? These questions also need to define the variable and the time period for the investigation. For example, How does the weight of the carrot change over the course of the week? (variable – weight of the carrot; time period – one week).
Time series graphs
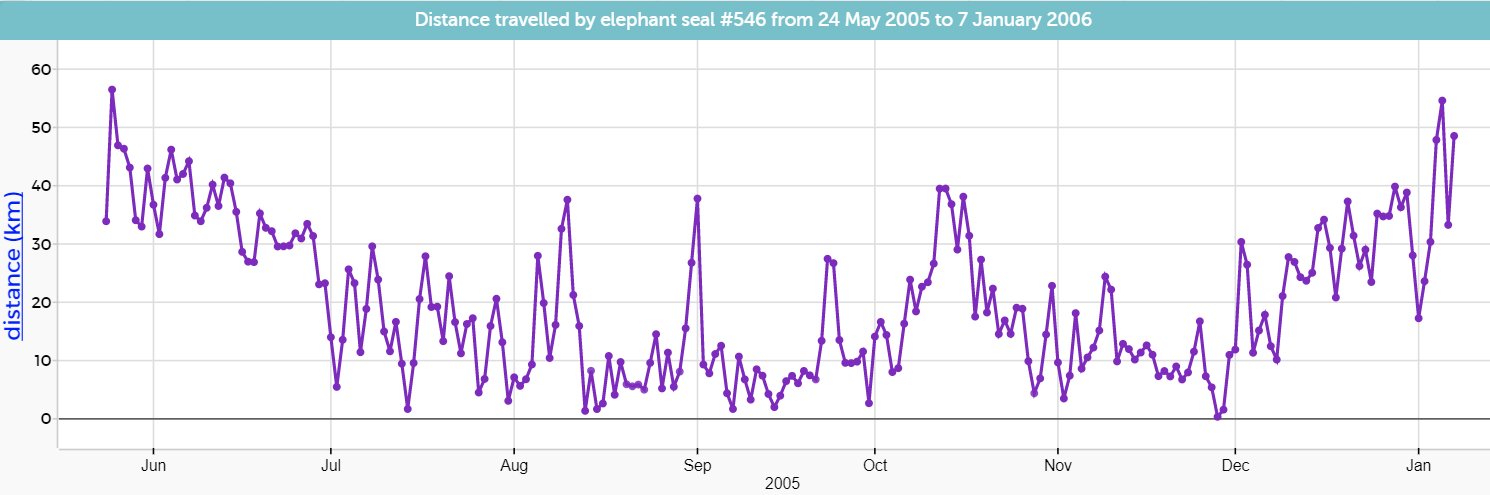
Time series graphs are used to display numerical data over time. The numerical variable of interest is on the vertical axis. Time is represented on the horizontal axis. For example, the graph below shows the distance travelled each day by an elephant seal (the numerical value) from May 2005 to January 2006 (the time).
The learning opportunities in this unit can be differentiated by providing or removing support to students and by varying the task requirements. Ways to support students include:
- setting up the plan for data collection for students to follow
- varying the type of data collected; categorical data can be easier to manage than numerical data
- varying the type of analysis expected from students, and the support given to students doing the analysis
- providing pre-prepared graph templates
- providing prompts for writing descriptive statements
- providing teacher support at all stages of the investigation
- creating opportunities for students to work in flexible groups, in which they can support each other and share their thinking.
The context for this unit can be adapted to suit the interests, experiences and cultures of your students. You could look at the weight of an animal over time, or record growth of a seedling. Alternatively, you could make links to the development of a local school or community garden, links to science-based learning (i.e. around the growth of different plants), or links to crops of fruits and vegetables that were traditionally, or are currently, grown in your local area. The statistical enquiry process can be applied to many topics and selecting ones that are of interest to your students should always be a priority.
Te reo Māori vocabulary terms such as tauanga (statistics), raraunga (data), tātari (analyse) and huritao (reflection, reflect upon) could be introduced in this unit and used throughout other mathematical learning.
- Scales (finely calibrated)
- Graters
- 1 kg of carrots
- Packets of carrot seeds
- Other materials depending on the investigations chosen
Getting Started
- We begin the unit by bringing along a kilogram of carrots and posing the investigative question (problem): How much of a carrot is water? Discuss the food crops that are grown in your local community, and the benefits and disadvantages of growing your own food. Students may be engaged in discussion around the cost of living; land, materials and labour required to build a garden, and how a garden might encourage healthy eating. You could also investigate crops that are of historical significance to your area (e.g. carrots in Ohakune, stone fruit in Central Otago).
- Get the students to brainstorm how much they think. Encourage all answers. Conclude by asking the students to estimate as a percentage of its weight.
- Ask: How can we find out? (plan)
Again get the students to share their ideas. - Select one of the ideas to use as the plan to answer the investigative question. One way is to weigh the carrots, without the green tops, then grate them and leave the carrots to dry in the sun. You could also use a dehydrator or an oven on very low heat.
- In addition to planning what to do, students need to think about how they will record the data. Support them to consider the following:
- How often will they weigh the carrots? Suggest twice daily – beginning of the school day and end of the school day.
- How will they weigh the carrots? The carrot can be weighed by itself, but what about once it is grated? Suggest weighing the carrot, weighing a container to put the grated carrot in, then grating and weighing the grated carrot plus the container.
What information will they collect, and how will they record it? Suggest using a table on a device or paper, for example:
Weight of carrot at start: _____________ Weight of container: _________
Day Time Weight container plus carrot Weight carrot only 1 Initial 2 Morning 2 Afternoon 3 Morning 3 Afternoon 4 Morning 4 Afternoon 5 Morning 5 Afternoon Final weight of carrot once dehydrated: __________
- When will they stop recording information? After about a week the carrot should be dried out completely.
- Working in pairs, get students to enact the plan and record the initial weight of their carrot (data), grate it and put it into the container.
- For the remainder of the week repeat the weighing process every morning and afternoon until the carrot is dried out completely (data). If this has not happened by the end of the week, resume recording the weight the next week. We still have to find the final weight after the carrot has dried completely to answer our investigative question and we will still have the weight of the carrot over the week to make a time series display in the final session.
- Depending on the time you have available you could also collect the initial carrot weights from each pair and display these using a dot plot. The investigative question would be: What are the initial weights of the carrots we have? Data can be collected directly onto a class dot plot on the board or a chart. Ask students to describe the graph by stating what they notice. Include the variable, values, and units in descriptive statements. For example, they might notice that most of the carrots we are using weigh between 80g and 150g. The lightest carrot is 65g.
Exploring
Over the next three days the students in small groups plan and conduct their own carrot investigation.
- Brainstorm some other things that the students could find out about carrots. Some ideas include :
- How many seeds are there in a packet of carrot seeds?
- Is it cheaper to grow or buy carrots?
- Where is the cheapest place to buy carrots this week?
- Is there a relationship between the length of the green top on a carrot and the length of the carrot?
- Do carrots get a fair deal in the Frozen Mixed Vegetables Packets?
- Allow the students to select and plan their investigation, collect their data and interpret it.
- It is important that you circulate around the groups asking questions that help the students plan and make sense of their investigation. In the early stages it is important that they have a clear strategy for collecting data that will help answer their investigative question.
- Ask the students to prepare a presentation (oral, digital, or hard copy), supported by a graph, for sharing with the class on the final day of the unit.
Reflecting
On the final day we look at and interpret the findings of our first investigation – How much of a carrot is water. We also share our small group investigations with the class.
How much of a carrot is water?
- As a class, discuss the final weight of their carrots and work out what percentage of their carrot must have been water because it has evaporated (analysis).
- Ask the students, in pairs or small groups, to present this fact in an interesting way. (One idea is to draw a carrot with the percentage of water coloured blue and the remainder orange.)
- In addition to this information about the percentage of water in a carrot, ask the students to show how the weight of the carrot changed over the course of the week (analysis). (There are a few considerations here: has the carrot completely dried? If not, then this reflection session might need to happen in a few days; if they are all completely dried then the final measurement might have been the morning of the 5th day, so a further afternoon reading won’t be needed, or if they have plateaued earlier i.e. fully dried then further recording is not necessary). Students should use a time series graph for this.
- The final presentation should include the percentage of water for their carrot and a time series graph for their carrot showing the weight over the week. The presentation should also include at least two statements describing what the displays show (communicating findings).
- Display around the class or as a slideshow. Students can look at the displays of other students and see how they compare with their findings.
Small group investigations
- In their small groups, students present their findings orally supported by a graph.
- Graphs can also be displayed around the class after the presentation.
Dear parents and whānau,
Do you know how much water there is in a carrot?
This week we have been exploring the answer to this and a number of other carrot problems. Ask your child to share their findings to this question plus the other carrot problem they explored.