In this unit students will identify how to plan and carry out a statistical investigation about a topic of interest.
- Pose investigative questions for statistical enquiry.
- Plan for data collection.
- Collect data.
- Display collected data in an appropriate format.
- Describe data collected referring to evidence in displays.
- Make statements about implications or possible actions based on the results of an investigation.
- Make conclusions on the basis of statistical investigations.
It is vital, when planning statistical investigations, that students understand the importance of the way in which they collect, record and present their information (data). Inconsistencies in the carrying out any of these steps can lead to altered findings, and therefore an invalid investigation. Students will first look at choosing a topic to investigate, making sure that the topic lends itself to being investigated statistically. They will then look at a variety of ways of collecting their data and choose the best way to record it. Once they have collected and recorded their data they will investigate the best way to present their findings, taking into consideration the needs of their intended audience. To evaluate the investigations there can be a combination of methods used, depending on the students, the topics and the intended audience. It could be useful for the students to send their completed investigations and findings to interested parties for more realistic feedback.
Investigative questions
At Level 3, students should generate broad ideas to investigate, before refining their ideas into an investigative question that can be answered with data. The teacher supports the development of students' investigative questions through questioning, modelling, and checking appropriateness of variables. Investigative summary, simple comparison and time series questions are posed, where the entire data set can be collected or provided. The variables are categorical or whole numbers.
An important distinction to make is that of the difference between investigative questions, meaning the questions we ask of the data, and data collection or survey questions, meaning the questions we ask to get the data. The data collected through survey of data collection questions allows us to to answer the investigative question. For example, if our investigative question was “What ice cream flavours do the students in our class like?” a corresponding survey question might be “What is your favourite ice cream flavour?” As with the investigative question, survey question development is done by the students with teacher support to improve them so that suitable survey questions are developed.
Analysis questions
Analysis questions are questions we ask of displays of data as we start to describe it. The teacher will often model this through asking students about what they see in their displays. A series of analysis questions can be developed in conjunction with the students. Analysis questions include questions about the features of the display. Questions such as: what is the most common? the least common? how many of a certain category? what is the highest value (for numerical data)? lowest value (for numerical data)? are analysis questions.
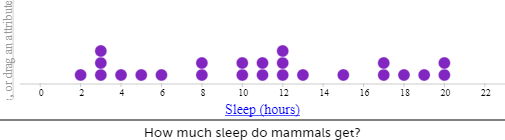
Dot plots
Dot plots are used to display the distribution of a numerical variable in which each dot represents a value of the variable. If a value occurs more than once, the dots are placed one above the other so that the height of the column of dots represents the frequency for that value. Sometimes the dot plot is drawn using crosses instead of dots. Dot plots can also be used for categorical data.
Bar graphs
In a bar graph equal-width rectangles (bars) represent each category or value for the variable. The height of these bars tells how many of that object there are. The bars can be vertical, as shown in the example, or horizontal.
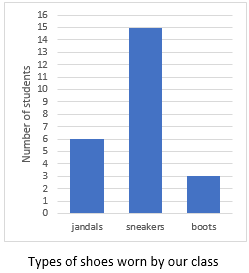
The example above shows the types of shoes worn in the class on a particular day. There are three types of shoes: jandals, sneakers, and boots. The height of the corresponding bars shows that there are six lots of jandals, 15 lots of sneakers and three lots of boots. It should be noted that the numbers label the points on the vertical axis, not the spaces between them. Notice too, in a convention used for discrete data (category and whole number data), there are gaps between the bars.
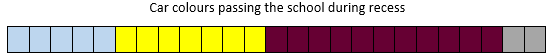
Strip graphs
A strip graph represents frequencies as a proportion of a rectangular strip. For example, the strip graph below shows that the students saw five light blue cars, seven yellow cars, 11 maroon cars and two grey ones. The strip graph can be readily developed from a bar graph. Instead of arranging the bars beside one another join them end to end. (Alternatively, you can easily get a bar graph from a strip graph by reversing the process.)
Tally charts
A tally chart provides a quick method of recording data as events happen. If the students are counting different coloured cars as they pass the school, a tally chart would be an appropriate means of recording the data. Note that it is usual to put down vertical strokes until there are four. Then the fifth stroke is drawn across the previous four. This process is continued until all the required data has been collected. The advantage of this method of tallying is that it enables the number of objects to be counted quickly and easily at the end.

In the example above, in the time that we were recording cars, there were 11 red cars, four yellow cars, 18 white cars and five black ones and 22 cars of other colours.
Using software for statistical displays
Microsoft Excel or Google Sheets are readily available tools that allow summarised data to be entered onto a spreadsheet and then graphed.
Other online statistical tools that are good for graphing data, for example CODAP – Common Online Data Analysis Platform, work with raw data and allow a more flexible approach to data analysis. Support videos for students and teachers in New Zealand on using CODAP can be found here.
The learning opportunities in this unit can be differentiated by providing or removing support to students and by varying the task requirements. Ways to support students include:
- constraining the type of data collected; categorical data can be easier to manage than numerical data
- adjusting expectations regarding the type of analysis – and the support given to do the analysis
- providing pre-prepared graph templates to support developing scales for axes
- providing prompts for writing descriptive statements
- grouping your students strategically to encourage tuakana-teina (peer learning) and mahi-tahi (collaboration)
- providing small group teaching around the different mathematical processes involved at each stage of this investigation, in response to demonstrated student need
- providing teacher support at all stages of the investigation.
The context for this unit can be adapted to suit the interests and experiences of your students. For example:
- the statistical enquiry process can be applied to many topics and selecting ones that are of interest to your students should always be a priority
- in the problem section of this activity some possible topics are suggested, however these could be swapped out for other more relevant topics for your students.
Te reo Māori kupu such as tūhuratanga tauanga (statistical investigation) and taurangi (variable) could be introduced in this unit and used throughout other mathematical learning
- Magazines, newspapers, websites etc containing relevant examples of different types of graphs that can be used to present statistical data. A mix of good and poor examples would be ideal. Ideally the examples should be recent and topical for your students.
- Computers and access to tools for for online questionnaires and graphing, data analysis e.g. CODAP
- Presentation materials
This unit is set out to cover the topic of statistical investigations in depth will likely take 1-2 weeks. Some of the sessions may take more than one classroom session to complete. There is an introduction session followed by five sessions that follow the statistical enquiry cycle (PPDAC cycle) as described in the New Zealand Curriculum. Data detective posters showing the PPDAC (problem, plan, data, analysis, conclusion) cycle are available to download from Census At School in English and te reo Māori.
While this unit plan uses the five phases of the PPDAC cycle as a step by step process, in reality when using the PPDAC cycle one often moves between the different phases. For example, students might need to revisit the investigative question (problem) as a result of the planning phase.
Session 1: Introduction
This session provides an introduction and purpose to statistical investigations. The teacher will need to provide the students with plenty of magazines, newspapers and websites that have some good examples of how data can be presented effectively and perhaps some examples of poorly displayed data. This could be collated into a chart or slideshow. Prior to the session, ask the students to spend some time at home looking through magazines and newspapers to find examples of statistics to bring in for the session.
- Start the session with a class discussion to get the students thinking about whether or not we have a need for statistical investigations, and who uses the information?
What is a statistical investigation?
Can you think of an example when we might need to carry out a statistical investigation? - Organise the students into groups of two or three. Give out magazines, newspapers and website links and ask the students to find some examples of statistics.
- Ask the students to look closely at the examples they have selected. Ask them to consider the following questions;
Who has done the research for/carried out this investigation?
Who will benefit from the results of this investigation?
Is it clear to you what the purpose of the investigation is?
What do you like about the way that the information is presented?
Does it help you in any way to understand the information better?
Do you think the information could have been presented in a different way to help the audience understand the findings? If so, what would have made it better? - Use a class discussion to share ideas from each group. Have the students all come up with the same ideas? Try and steer the students towards the conclusion that the best way to present the information depends on the information itself. They might notice that category data is displayed differently to numerical data.
Session 2: PROBLEM (Generating ideas for statistical investigation and developing investigative questions)
This session is ultimately about choosing an appropriate topic to investigate. You will need to discuss what data is actually measurable within your context and realistic topics that can be investigated in the given time frame. It would be a good idea to provide the students with a list of topics (perhaps relating to a current school issue, relevant curriculum area, or your students' cultural backgrounds and interests). Encourage students to come up with something original where possible.
- Set the scene by recapping the discussion from the previous day about the purpose of a statistical investigation. The purpose of a statistical investigation is to identify a problem or issue that can be explored using data. The process includes “designing investigations, collecting data, exploring and using patterns and relationships in data, solving problems and communicating findings” (New Zealand Curriculum, 2007, p.26).
- Set the students up to decide on a broad, relevant topic to investigate. This could include an initial brainstorming session in small groups and then the sharing of ideas as a class. Make sure the students know to choose a topic that will have some benefit or serve a purpose. Ideas to help include:
- An issue across the school e.g. litter, uniform, parking, traffic, drop off/pick up zones
- About the class e.g. pets, favourites, number of…, use of devices,
- Something specific to the community e.g. options for a gala, market stall, Matariki celebration, best time for whānau to visit and see what is happening in class
- Finding information about a particular activity e.g. sport involvement; hobbies and interests
- Behaviours e.g. fridge pickers, tv watching, online learning
- Once the initial brainstorming of ideas is done, interrogate the topics with the following questions:
- Is this an area that the students in our class would be happy to share information with everyone? Or is it an area that our target group (e.g. whānau) would be happy to share information with us. If not reject the idea [ethics].
- Can we collect data to answer an investigative question based on this topic or issue? If not reject the idea [ability to gather data to answer the investigative question].
- Would you be able to collect the data to answer the investigative question in the timeframe we have specified? If not reject the idea [ability to gather data to answer the investigative question].
- What would be the purpose of asking about this topic or issue? If it is not purposeful then reject the idea [purposeful or interesting].
- Would the investigative question we pose involve everyone in the group (e.g. the class or another defined group)? If not reject the idea [does not involve the whole group].
- Organise students into groups and have them select a topic or issue to focus on.
- Support students to develop an investigative question(s) based on their topic or issue. If necessary, you could develop a few investigative questions as a class, before asking students to do this in their groups.
These are the questions we ask of the data; it will be the question(s) we explore using the PPDAC cycle.- Prompts to help with posing investigative questions are:
- What is the variable that you want to ask about?
- Describe the group that you are asking about?
- Do you want to describe something (summary) or compare something (comparison)?
- Summary questions have one variable and one group e.g. How much litter is around the school after lunch? [litter after lunch, around the school]; What pets do the students in our class have [pets, our class]?
- Comparison questions have one variable and two or more groups e.g. How does the amount of litter that is around the school compare between after recess and after lunch? Does the traffic outside the school in the afternoon tend to be more than the traffic outside the school in the morning?
- Prompts to help with posing investigative questions are:
- Check the investigative questions that students have posed. Collate them (e.g. write them on the board, type into a google doc or write on sticky notes to be pinned up). As a class check each investigative question for the variable and the group to be asked, against the remaining criteria:
- Is the question purposeful? This should have been sorted in the generating topics for investigation stage.
- Is the question about the whole group? Check that it is not just finding an individual or smaller group of the whole group. This too should have been sorted in the generating topics for investigation stage.
- Is the question one that we can collect data for? This again should have been sorted in the generating topics for investigation stage.
- Is it clear that the question is a summary or comparison question?
- Collect in the final investigative questions. Label who posed them in preparation for the next session. Double check the investigative questions before the next session as poorly posed investigative questions can hinder the subsequent phases.
Session 3: PLAN (Planning to collect data to answer our investigative question)
Data collection is a vital part of the investigation process. The teacher will need to stress to the students, once again, the importance of being consistent in the collection of their data. There will also need to be sufficient discussion around efficient methods for data collection and recording.
- We need to plan to collect the data. Explain to the students that all the data will be collected using one of the following methods, depending on what data they need to collect. They might use an online survey form (e.g. google forms), and/or a paper survey, or tables (online or hard copy). Consider the skills and knowledge already developed by your students, and which method will best, in reflection of this. Ultimately, the class should move towards collecting individual data in individual rows of a spreadsheet or table.
- To answer our investigative questions, we need to collect specific information or data using data collection/survey questions. In this phase of the cycle we are planning to collect our data. This means we need to pose data collection/survey questions.
Fundamentally, data collection and survey questions are the same – they are both questions we ask to get the data.- Survey questions are those we pose for a questionnaire to survey people e.g. What is your favourite colour? How did you travel to school today? Do you like eggs? People answering the questionnaire record their own responses and we collate these once all the questionnaires are complete
- Data collection questions as those we pose for other data collection situations e.g. if we are going to collect data about the make and colour of cars passing the school then we might pose the data collection questions – what is the make of the car; what is the colour of the car and record these in a table.
- Ask students what they think would be useful to consider when they pose their data collection/survey question(s). Gather a few key ideas to help them with this. For example:
- The question needs to be specific
- Keep wording simple and short
- Avoid questions that ask about more than one thing
- Support students to pose their data collection/survey questions. They should also think about any specific instructions, e.g. if they were going to collect information the amount of litter around the school they may need to define what they consider to be litter, what are the different areas they will collect from, how they will count the litter e.g. by number of pieces of litter, by weight, by plastic bags full.
Managing surveys: depending on the target groups and how you plan to manage the survey process there are a few options here to choose from.
Option 1: an online questionnaire is developed for each group that will be surveyed. This following should be considered:
- What is the group? E.g., the class; the parents of the class; teachers in the school; students in another class (e.g. another year level)
- Does the questionnaire contains all the survey questions from across the class that pertain to that group?
- How will the questionnaire link be sent to participants and collected by students?
- Is any identifying information collected? All responses should be anonymous – teachers will need to manage this carefully.
Option 2: a paper questionnaire is developed for each group that will be surveyed. Similar considerations to the online questionnaire are needed, except that a paper copy will need to be printed for each person to fill out. These should be collected up and brought back to the class if the people who have filled them out are not in the class
Other data collection methods
Depending on the topics, students might be collecting data about litter, cars, pedestrian traffic. These are not things that we would use a questionnaire for so the students will need to think about a plan to collect the data. They may decide to use a pre-prepared table or grid to do this. The table should be set up so that the information for each of their data collection questions for a single object can be recorded in a single row. For example:
Collecting information about vehicle make and colour – students might also think to collect the vehicle type too.
Set up a table with four columns:
Number plate Vehicle type Vehicle make Vehicle colour AAA123 Car Audi Blue BBB456 Ute Ford Gold CCC789 Car Holden Red DDD111 Truck Isuzu White 123AA Motorcycle Suzuki Red - Record in a single row the information about one car
- They should also consider in their planning how long they will collect the data for and where (this will form the “group” – data about the vehicles driving past the school from 1-2pm on 24 September).
Students need to check with the teacher before commencing data collection to ensure that their method of collection is the most appropriate and will result in data that is useful for analysis.
Session 4: DATA (Collecting and organising data)
- Provide time for students to collect and record their data, according to their plan. Regardless of the method of collection our end aim is for students to have their data tabulated with the data from a single person or object in a single row.
- Provide modelling and support for students as they enter their data into a spreadsheet. This should be tabulated with the variables across the top and the data listed in rows below, the table in the example about vehicle make and colour shows the structure. Consider the following:
- If data is in an online questionnaire, give the students only the data pertaining to their investigative questions
- For paper questionnaires the data should be collected into a spreadsheet for their questions only
- If a paper copy of a table was used this should be transferred into a spreadsheet
- Check for any data input errors
- Save as a .csv file
Note for teachers:
Students will use their .csv file to make their displays in the next session. If it is not possible for them to save as a .csv then the teacher may need to do this and share with them or set up the CODAP document with their data and share a link to this. See the video or written instructions on how to do this. Note the video and the instructions include getting started with CODAP too.
Session 5: ANALYSIS part 1 (Using an online tool to make data displays)
In this session the students will be introduced to using an online tool for data analysis. One suggested free online tool is CODAP. Feel free to use other tools you are familiar with. This session is written with CODAP as the online tool and assumes students have not used CODAP before.
If you do not want to use an online tool, then continue to Making Displays, and construct paper versions of bar graphs and dot plots.
Learning how to use CODAP
- Allow the students some time to get familiar with CODAP. Using the Getting started with CODAP example is a good starting point. This has a built-in video that shows the basic features of CODAP and gets you started using the tool. Other support videos can be found here.
The main features that students need to be familiar with are how to draw a graph and how to import their data. More on importing data into CODAP can be found here.
Bar graphs for categorical data
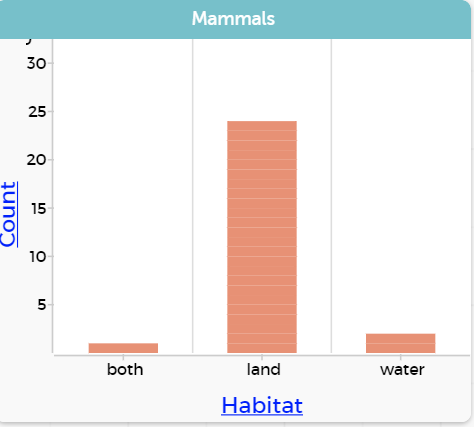
CODAP by default makes a dot plot for both categorical and numerical data. If the data is categorical the bar graph icon (configuration icon) can be selected to fuse the dots into bars, shown in the two pictures below. The graphs are showing the habitats of mammals.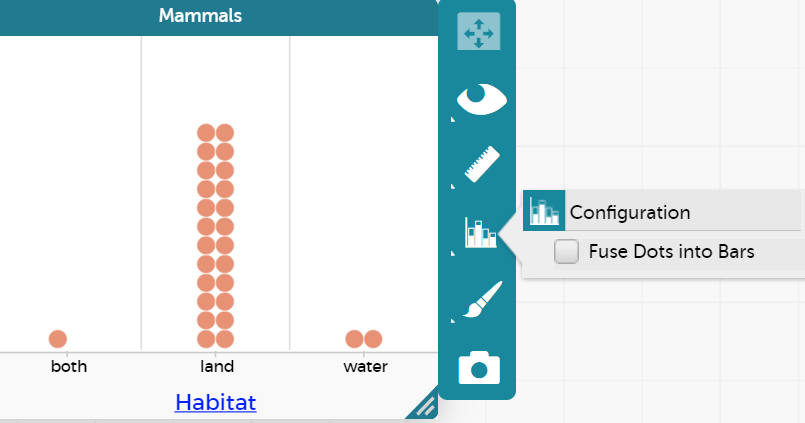
Students should be encouraged to try different things out with the data to get further insights as to what the data might show them. For example, for the above data about mammals students might want to see what happens to the diet for different habitats. They can drag the diet attribute onto the top axis of the graph (and to get different colours they can drag the diet attribute into the middle of the graph to make a legend) and the following display will result.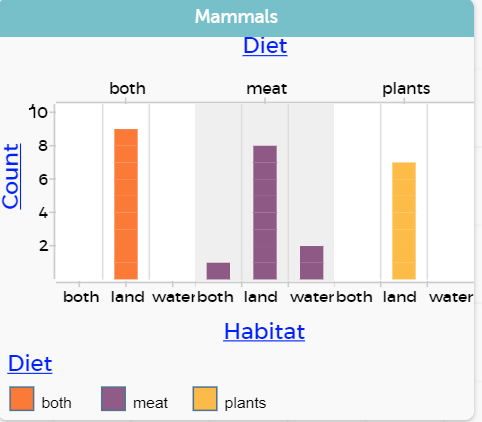
This gives a deeper insight into the data. You will find that students at this age are comfortable with using CODAP once they have had a little time to play with the software.
Dot plots for numerical data
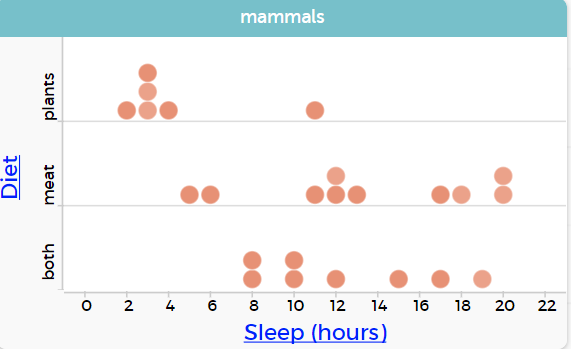
When using CODAP for numerical data a dot plot is the default setting. For example, sleep in hours for mammals shown below.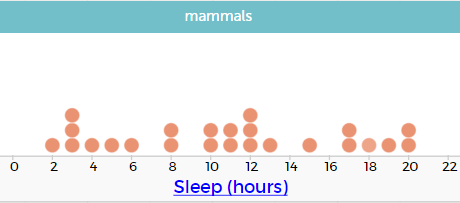
The data can be split into groups by dragging a categorical attribute to the vertical axis. To explore the sleep by the different habitats, drag habitat to the vertical axis, or to explore sleep by the different diets, drag diet to the vertical axis. The following graphs result.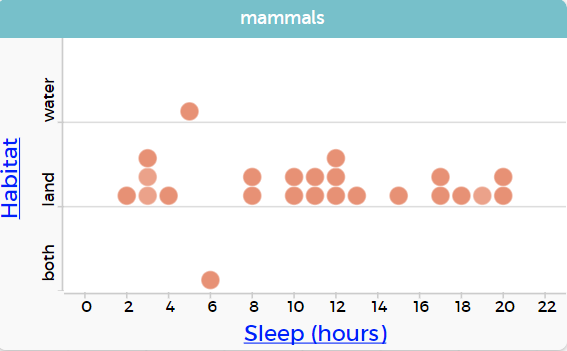
Making displays for the data they have collected to answer their investigative question
- Now that the students are familiar with CODAP they can make displays with their own data to help them to answer their investigative questions. Have students label their graphs using their investigative question.
- Graphs can be exported by using the camera icon or students can take a screen grab of the graph to put into another document. Alternatively, students can use the text feature in CODAP and write their descriptions in there. As we are heading towards a presentation it is most likely that they will use their graphs in another document for the presentation.
Session 6: ANALYSIS part 2 (Describing data displays)
- To describe the display, encourage students to write “I notice…” statements about their displays. Initially accept all statements as encouraging the idea of noticing is valuable for both statistics and other aspects of the mathematics curriculum. If students are not sure what to notice the teacher can prompt further statements by asking questions such as:
- What do you notice about the most common number of…?
- What do you notice about the largest number… the smallest number…?
- What do you notice about where most of the data lies…?
- What do you notice about the most popular… least popular…?
- What do you notice about how the data for the litter after lunch is different to the data for the litter after recess (more specific example for a comparison) …?
- Check the “I notice…” statements for the variable and reference to the group. For example: “I notice that the more than half the vehicles that went past our school from 1-2pm on 24 September were cars.” This statement includes the variable (types of vehicles) and the group (past our school 1-2pm on 24 September). Support students to write statements that include the variable and the group.
Session 7: CONCLUSION (Answering the investigative question and reporting findings)
This last session will focus on the final presentation of the data each group has found out. Encourage the students to be constantly evaluating what they are doing. Explain that it is fine to discover that a particular way of presentation is not working, and that it is a good idea to adjust.
- Use this time to finish presenting information in graphs, tables, or any other format.
- Present information in a way that includes the important parts of their investigation. Provide time and opportunity for your students to present this information using tools that are relevant and engaging for different students (e.g. as a video, poster, digital animation, speech).
- Topic chosen
- Investigative question(s)
- Survey/Questionnaire/Data collection method/questions
- Group data was collected from
- Results – tables/graphs and descriptions of the data
- Conclusion – answer to their investigative question
- Call to action?
- Have groups of students share their finished presentations with the class.
- Evaluation: (Peer and Teacher)
- Give feedback, including constructive criticism.
- Is the information easy to understand?
- Could we make it any clearer?
- Talk about who could use the information that has been presented. Can we send it to anyone outside school? For example, investigations related to a road safety issue could be forwarded to the local council.
Dear parents and whānau,
During the next two weeks we will be working on statistical investigations. Over this time, your child will be gathering data and presenting it using tables and graphs. Your child now needs to be thinking about choosing a topic to investigate. It would be helpful for your child if you could support him/her with selecting a topic, gathering data and perhaps watching for relevant newspaper or television items that will help him/her with analysing the information and forming a conclusion.
Thank you for helping with your child's statistical investigation.