This is a level 3-4 activity from the Figure It Out series.
A PDF of the student activity is included.
Click on the image to enlarge it. Click again to close. Download PDF (986 KB)
Statistical thinking involves the exploration and use of patterns and relationships in data and comprises four key processes:
- describing data – connecting the information in a table or graph with a real-life context
- organising and reducing data – ordering, grouping, and summarising
- representing data – creating visual representations
- analysing and interpreting data – recognising patterns and trends and using them to make inferences and predictions.
In these activities, students carry out a mathematical investigation to explore the relationship between the height a ball is released from and the height of the first bounce. Students then conduct a similar investigation comparing the bounce of a ball before and after it has spent at least 12 hours in a refrigerator.
a variety of balls
a classmate
access to a refrigerator
graph paper or a computer graphing program
FIO, Technology in Practice, Levels 3+-4+, Bouncing Back, pages 12 - 13
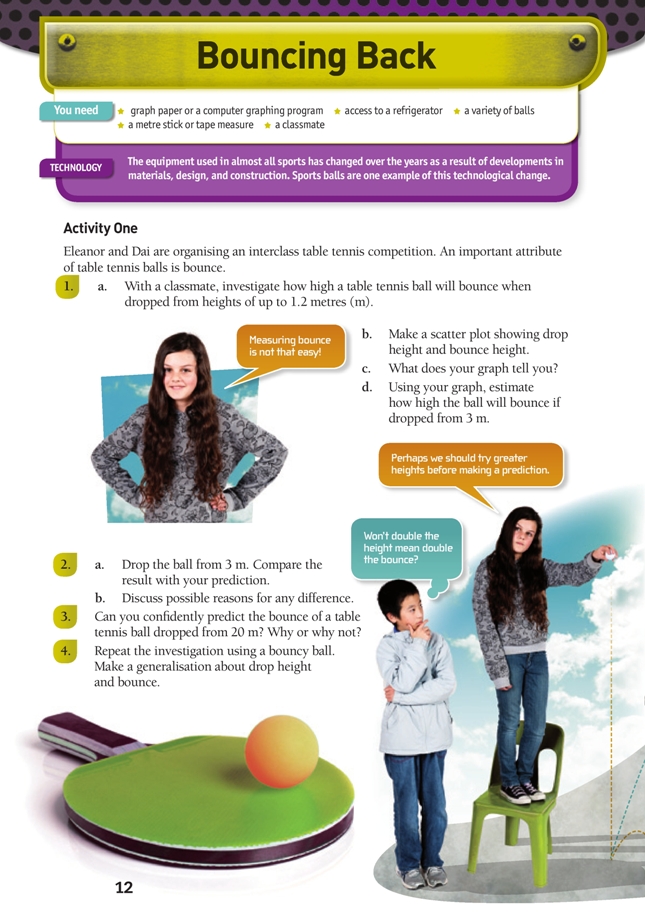
Activity One
Discuss measuring techniques and the importance of conducting fair tests. For a test to be fair, only one variable should be changed and the others kept constant. Variables that need to be controlled in this context include the size, material, and air pressure of the ball and the surface the ball is dropped onto.
Useful websites on fair tests include:
- www.ise5-14.org.uk/prim3/New_Guidelines/investigations/Fair_test.htm
- www.sciencebuddies.org/science-fair-projects/project_experiment_fair_test.shtml
Working out how to accurately measure the height of a ball bounce is a challenge. One approach is to drop the ball close to a wall that has a paper measuring scale taped to it. Bounce heights can then be marked on the paper. Alternatively, students could record the height reached using a freeze-frame video. (Make sure that the measuring scale is easy to see.)
Students can create a multiple scatter plot (as in the answers) or use the median result of several trials at each drop height.
Discuss with the students how to draw a line on the graph to show the trend. This line is called “the line of best fit”. It is unlikely that the data will fall in a perfect line. Students should try to have the same number of data values above and below the line. It makes sense to draw the line through (0,0) because the ball will have no bounce height unless it is dropped.
Data values that are obviously outliers (extremely large or small values) should, in this instance, be ignored or removed because they are probably inaccurate. Discuss this with your students.
The relationship between drop height and bounce height is only linear for small drop heights. Once a ball reaches a certain height, the bounce height will begin to level off because the ball will reach its terminal velocity. (See www1.appstate.edu/~goodmanj/4401/labnotes/bouncingballs/bouncingballs.html for further information about the forces at work.) This is a useful discussion point; we should be less confident about predictions for heights that are considerably larger than those used in an experiment.
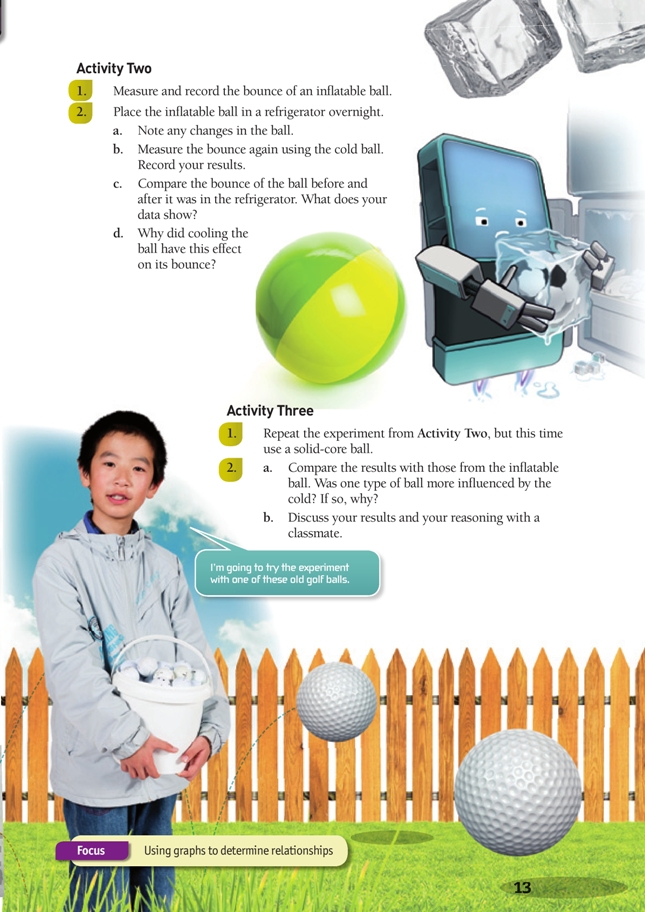
Activity Two
In this activity, students compare the bounce of a ball before and after it has been chilled. The bounce of an inflatable ball depends largely on its internal air pressure. As the air inside the ball cools, its pressure drops, making the ball flat. Placing the ball in a freezer rather than a fridge will create a more pronounced effect.
Activity Three
Solid-core balls are also affected by temperature, but for different reasons. When materials are cooled, they become less elastic. This makes the ball absorb energy rather than transfer it, reducing its bounce. Note that these changes will also be present in the inflatable ball.
To compare change in the two different balls, the students will need to use proportional reasoning. The simplest way is to compare the AF (after fridge) and BF (before fridge) bounce for the inflatable ball and express the result of AF/BF as a percentage, and then to do the same for the golf ball. Because percentage is a standardised fraction (always part of 100), it will be very easy to see which bounce changed most: the smaller the percentage, the smaller the change, and vice versa.
Useful websites for exploring bounce include:
- www.exploratorium.edu/baseball/bouncing_balls.html
- www.exploratorium.edu/sports/ball_bounces/index.html
Measuring the bounce of a ball would be a complicated process if you were working alone. Working with a partner or a group to conduct the investigation develops the key competency participating and contributing.
Extension
Do two balls bounce higher than one? See the following websites for further details:
- www.bbc.co.uk/bang/handson/twoballbounce.shtml
- www.abc.net.au/spark/experiments/s1090896.htm
Technology-related student activities
- Investigate the technologies that Antarctic explorers used to cope with extreme conditions.
- Investigate what it is like to live and work in space (see http://spaceflight.nasa.gov/living/index.html).
Exploring the technology-related context
Endeavours such as building in arctic environments, undersea operations, and space flight rely on the use of technology to enable humans to adapt to extreme conditions. Extreme environments can alter the performance properties of materials and products.
Answers
Activity One
1. a.–b. Answers will depend on data. Here is a sample table and graph:
| Drop height (m) | Height of first bounce (m) | ||
| Trial 1 | Trial 2 | Trial 3 | |
| 0.2 | 0.15 | 0.16 | 0.14 |
| 0.4 | 0.3 | 0.31 | 0.3 |
| 0.6 | 0.45 | 0.44 | 0.47 |
| 0.8 | 0.6 | 0.61 | 0.6 |
| 1 | 0.75 | 0.7 | 0.74 |
| 1.2 | 0.78 | 0.77 | 0.79 |
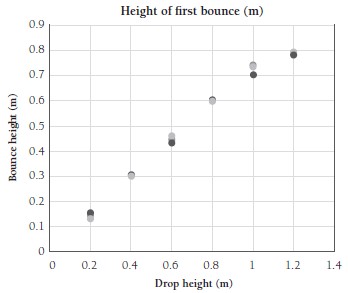
c. The scatter plot shows that as the height from which the ball is dropped increases, the height that the ball bounces also increases.
d. Predictions will vary. One way to make a prediction is to extend the graph and then draw a line that goes through most of the data, extending it to above the 3 m mark.
2. Answers will vary. It is likely that the actual bounce height will be lower than predicted. This is because as the drop height increases, the bounce height eventually levels out.
3. It’s not sensible to predict the bounce height of a ball dropped from 20 m without conducting more trials. It’s important not to go too far beyond known data when making predictions.
4. Practical activity. Although balls have different degrees of bounce, at some point all balls reach a maximum bounce height.
Activity Two
1. Practical activity
2. a.–c. Answers will vary. You should find that the ball doesn’t bounce as high after it has been in the refrigerator.
d. Being in the refrigerator overnight decreased the air pressure in the ball. A flat ball has less bounce than a ball that is fully inflated. Being in the refrigerator may also have temporarily altered the properties of the material from which the ball is made (for example, reduced its flexibility).
Activity Three
1. Results will vary.
2. a.–c. Results will vary. The type of inflatable ball used will influence the results. A beach ball will be more sensitive to the cold than a basketball. The inflatable ball and the solid-core ball will both have been affected by the cold, making their materials less elastic.