This unit supports students in recognising percentages in everyday contexts, gaining knowledge of simple percentages as proportions, and finding simple percentages of amounts.
- Know common percentages as proportions of a whole amount.
- Express common percentages as fractions and vice versa.
- Express simple ratios as part-whole decimals.
- Calculate simple percentages of amounts.
Percentages are a specific type of equivalent fraction with a denominator of 100. The symbol %, is derived from the vinculum of a fraction: /, and the two zeros from 100. So, a percentage literally means “for every hundred.”
In many situations a percentage describes a part-whole relationship. For example, in the following problem Mani lands 24 out of 30 shots in her netball game. What is her shooting percentage? The percentage of Mani's shots landed is calculated as 24/30 = ?/100. There is an assumption of homogeneity, that Mani will shoot at the same rate.
Percentages are useful to establish a common base for comparison. Most situations in which part-whole relationships need to be compared, the whole (or bases) are not the same. For example, Mani takes 30 shots, but Alicia takes 28 shots. Some situations involve comparison of different wholes or different parts. In those situations, percentages greater than 100% are possible. For example, there are 12 girls and 18 boys. The number of boys is 150% of the number of girls.
In other situations, percentages are used as a fractional operator, e.g. 30% of $45. That calculation is equivalent to 30/100 x 45 = ? Common examples of percentages being used as operators are discounts in shops, and interest on loans.
This unit builds on students’ everyday knowledge of percentages. Contexts such as healthy eating guides, shopping discounts, statistics, and comparisons are encountered by students in their daily lives.
The learning opportunities in this unit can be differentiated by providing or removing support to students, orby varying the task requirements. Ways to support students include:
- altering the numbers that you choose for the problem. Easier problems involve simple percentages such as 50%, and 10%, moving to derivatives of those percentages like 25%, 5%, and 30%. Use base amounts that make the calculations simpler, such as 60 or 30, before using more complicated bases such as 24, 36 and 144
- ensuring that student understand the meaning of important vocabulary, such as percentage as “in every hundred”, base as the unit of comparison, and amount as the target quantity
- diagrammatically modelling the problems using the percentage bar. Explicitly demonstrate use of the model with students creating their own diagrams as you work. The percentage strip is a powerful way to scaffold students’ representation of percentage problems
- providing opportunities for students to work in a variety of groupings (e.g. pairs, small groups, as individuals, with the whole class) that will enable students to scaffold, learn from, and encourage their peers
- using calculators in a predictive way. Expect students to estimate or calculate their answer initially, using percentage bar models, before confirming the answer using a calculator. Students should be shown how to perform algorithms on a calculator to find percentages, e.g. 25% of 64 as 64 x 25% = ?
The contexts used in the unit can also be adapted to cater for the cultural backgrounds and interests of students, and to make connections with current learning from other curriculum areas. Choose situations that are likely to be experienced by your students. The unit uses situations around healthy eating and fishing, which will appeal to many students. Other situations such as sharing collected food, a walk or cycle between two local points, battery charge remaining in a computer game, or sports points, might be more motivating to your students.
Te reo Māori kupu such as ōrau (percent) could be introduced in this unit and used throughout other mathematical learning
Session One
In this unit students explore the use of percentages to represent part to whole relationships. The context of a healthy food guide is used. The first session could extend to a week-long investigation into healthy eating, though that is not the purpose of this unit.
- Use Slide 1 of PowerPoint One to introduce the healthy food pyramid.
What is this graphic about?
How is the pyramid used in everyday life?
What do the percentages mean? - Unpack the symbolism of % to mean “in every hundred.” In the example of the food pyramid, the total is the number of calories or kilojoules consumed. Our bodies get energy from food and that energy can be measured in calories or kilojoules. A Joule is the energy required to move a 100g mass for 1 metre horizontally. Many excellent videos are available online by searching “healthy food pyramid for kids.”
- Slide Two shows the average number of kilojoules needed each day by boys and girls at 9 and 10 years of age. Use Slides Three and Four to introduce simple percentages of a number. In that case the percentages are of 6 400kJ, the daily intake of a 7-year-old girl.
Ask questions like:
What do you know about 50%? (same as one half)
If 50% equals one half, what fraction of the whole is 10%? (one tenth)
What percentage equals one hundredth? (1%) - Use an online calculator to show how the calculations can be performed.
For example, 50% x 6400 = 3200 and 10% x 6400 = 640, etc. - Challenge your students to find 50%, 10% and 1% of the kiloJoule intake for their age and gender. They may chose to work with a partner, and to confirm their answers with a calculator. Discuss the strategies they used.
For example, dividing by two gives 50%, dividing by ten gives 10%, and dividing by one hundred gives 1% of the total intake. - Model the use of a percentage bar to complete one set of calculations. Use Slides 5 and 6 to show how the bar is created and ask students to show 1% of 8 100 kJ using the model. Extend the model to work out other simple percentages such as 25% (one quarter) and 20% (one fifth).
Look for students to work out the new percentages from those that are already there. For example, 20% is 10% multiplied by two. - Use Slide 7 to introduce finding percentages of a daily total for each food group. Let students work in pairs to calculate the amounts for Tama, an 8-year-old boy. Slide 8 show how 10%, 20%, and 5% can be calculated using a bar model. Ask students how they might use those percentages to find 25% and 15%.
Some students might find 25% by halving 50% while others add 20% and 5%. A useful check is that the two ways yield the same result. - Return to Slide 1.
Use a percentage bar model to find out how many kilojoules of each food group you need each day. Work with a partner so you can check each other’s calculations.
After you create the bar model use a calculator to check your answers again. - As students work, roam the room and look for the following:
- Can students draw percentage bars correctly to represent and solve the problems?
- Do they look for connections between the percentages, such as 20% is twice 10%?
- Do they estimate the answers using fractional equivalence, such as 10% equals one tenth and 25% equals one half of one half?
- Do they correctly enter the calculations into a calculator to check?
- After a suitable time gather the class to share strategies and highlight the points above. Answers are available on Slide 9.
- Provide students with Copymaster One. The task is to work out the amount of each food that might be eaten per day to match the food pyramid. For example, carrots are vegetables. The allowance for vegetables is 1925 kJ per day for a 10-year-old boy. Each carrot contains 200kJ of energy. 1925 ÷ 200 ≈ 10 carrots per day. Discuss observations with your students, such as, “You can eat a lot of fruit and vegetables” and “Meat, nuts, and cheese have a lot of kilojoules in them for the amount you get.”
- Planning meals for one week based on the healthy food pyramid could be used as an extended investigation. Search online using “Kilojoules for foods” to locate a measurement for major foods. Students could measure out amounts of food to get a sense of quantities and cost. Be aware of the foods your students eat, and have access to, at home. Often, "healthier" foods are much higher in price, meaning some students may consume more calories during the week, through no choice of their own.
- Conclude the lesson with the problem on Slide 10.
A standard cheeseburger contains 1 255 kJ of energy.
What percentage of your daily intake is that?
Note that this problem involves finding the percentage, not the amount. Let students attempt the problem with access to calculators.
Do they use trial and error to find the percentage?
Do they realise that division gives the percentage? For example, 1 255 ÷ 7 700 = 0.162… which equals about 16%.
Session Two
In this session students look at the use of percentages in retail. They use the percentage bar model to work out both discounted prices and the amount of percentage discount.
- Show Slide 1 of PowerPoint Two.
I saw these old jeans in a Recycling Shop and I just needed to buy them!
Luckily, the shop had a 40% off sale.
How much do you think I paid?
Students might offer possible prices, but many will say that it is impossible to know. The original price is needed. Click and the price tag is revealed.
Can you work out how much I paid now?
Let students work in pairs before sharing as a class. - Discuss students’ strategies. Sensible estimation should be encouraged, such as:
“You paid a bit more than $10 because the jeans would cost that with 50% off.”
Look for students to apply their knowledge and strategies from Lesson One, including the use of the percentage bar.
For example, “10% of $20 equals $2. I multiplied 10% by four to get 40%, that’s $8. $20 minus $8 equals $12. You paid $12 for the jeans.” - Slide 2 of PowerPoint Two animates the use of a percentage bar model.
Let’s think about discounts.
If the sale is 40% off what percentage of the price do you pay? (60%)
What if the sale is 25% off? What percentage of the price do you pay? (75%)
What if the sale is 30% off? What percentage of the price do you pay? (70%)
Is there a way to work what percentage of the price you pay? - Show Slide 3 and ask students to work on the problems in pairs or threes. Ask them to draw a percentage bar model for each percentage discount. Roam the room as students work. Look for:
- Do students find the amount paid by deducting the percentage of the price?
- Do they create correct percentage bar models?
- Do they look for connections among percentage discounts? (For example, 15% equals half of 30%)
- Pose the following problem for students ready for extension. This would be a good point to check understanding for all students, and hold a short small-group teaching session, if needed, to revise the key concepts from the session. After solving this problem, students could make up their own problems that follow the same structure.
If you paid $9.00 for this pair of jeans, what was the discount? - Gather the class to share strategies and answers. Slides Four, Five and Six can be used to highlight connections students may not notice.
- Use Copymaster Two to create the game Percentage Bingo. The game is played in groups of four players. Each player needs a Bingo board and some counters. A calculator is needed to check answers.
- The six item cards are put in one area, separated out so they are all visible.
- The six percentage discount cards are laid out in a different area.
- Players take turns to:
- Choose an item card and a percentage discount card.
- Workout the discounted price.
- Replace the two cards back to their areas.
- Any player who has the discounted price on their Bingo card covers that number with a counter.
- The first player to cover all their card numbers wins.
A calculator can be used to support some players if needed, and to check answers.
- Finish the lesson with a discussion about strategies to win the game. Take specific examples of discounted prices, such as $24.
Where is a good place to start if I want to get this price?
Given that the discounts are 50% or less, any item costing $50 or more cannot be used. Try the belt at $30 first. What percentage of $30 is the $6 discount? (20%)
Session Three
In this session students explore the part-whole relationships in simple ratios and express those relationships as fractions and percentages.
- Use PowerPoint Three, Slides One to Four to introduce the representation of ratios as percentages. Slide 2 shows a handy pack of 25 items in the ratio 9:7:4:5 for nails, screws, bolts, and nuts, respectively. Percentages represent part whole relationships. Let students work in small teams. Useful scaffolding questions include:
How many items are in the whole pack? (9 + 7 + 4 + 5 = 25)
What fraction of the pack are nails? Screws? Nuts? Bolts? (9/25, 7/25, 4/25, 5/25)
What percentage of the items are nails? Screws? Nuts? Bolts? - Animate Slide 3 and discuss how a percentage bar can be used to model the situation.
What percentage of the items are nuts?
Is there an easy way to work that out?
Some students might realise that there are 25 items in the whole (pack) so each item is 4% of the pack. 25 x 4 = 100. There are five nuts and 5 x 4 = 20. Therefore 20% of the pack are nuts.
What is the simplest fraction for 20%? (one fifth)
Convince me that one fifth of the pack items are nuts.
Look for students to show that 5/25 is an equivalent fraction to 1/5. - Use Slides Four and Five to work out the percentages for each of the four items. Note that the number of items in the pack changes so students will need to adjust the size of the whole. As students work in their teams look for the following:
- Do students use the percentage bar, adjusting for the number of items in the pack?
- Do they simplify the fractions, where possible?
- Do they use the unit percentage for a single item?
- Do they check that the percentages they find add to 100%?
- Do they look for relationships among the percentages? For example, half as many items must mean half the percentage.
- After each slide gather the class to discuss the points above. On Slide 4 the pack contains 50 items, so each item is 2% of the pack. That relationship makes finding the percentages easy. On Slide 5 the pack contains 40 items which means each item is 2 ½ % of the pack.
- Show students how a calculator can be used to find the percentages. For example, work out the percentages for Slide 5 as follows:
Nails: 16 ÷ 40 % = 40%
Screws: 10 ÷ 40 % = 25%
Bolts: 6 ÷ 40 % = 15%
Nuts: 8 ÷ 40 % = 20%
Note that division is the same as the ‘out of’ meaning of the vinculum (horizontal line) in a fraction. For example, 2/5 is the same as 2 ÷ 5. Support your students to understand this. - Give students Copymaster Three to work from in pairs. Calculators can be used to check answers after students have attempted other methods, such as using the percentage bar. As students work, roam the room to see students are making sense of the problems and using the percentage bar to support their strategies.
Look for:- Do students consider what percentage each item is worth? For example, in the 10-pack each item is worth 10%.
- Do students look for simple fractions that might be useful? For example, 5/20 = 25%.
- Ask early finishing pairs to create their own handy pack problem for others to solve.
- After a suitable time gather the class to discuss the answers. Provide students with a calculator between two to standardise how answers might be found. Where discrepancies exist between a paper and a calculator answer, ask students to consider and find out why those discrepancies occurred.
Session Four
In this session students build on the use of percentages to represent ratios. They consider percentages in the context of monitoring fish stocks in a small lake.
- Use Slides 1 to 6 of PowerPoint Four to introduce the context of fish in Lake Puketirini. You could adapt this PowerPoint to reflect the context of a lake that is close to, and/or significant to, your school. Discuss the significance of fishing to students’ whanau, as a food source or for recreation. Ask students what they know about the species in the lake. Research briefly online if necessary.
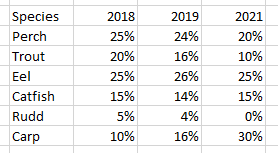
- Print Slides 4 to 6 for students so they can work in small groups to analyse the data. Allow access to calculators as some calculations are demanding. Roam the room as students work. Look for the following:
- Do students recognise that the whole sample size must be calculated before percentages can be worked out?
- Do they correctly calculate the percentages using division on the calculator, or mentally?
- Do they check to see that the percentages for each sample add to 100%?
- Do they notice any patterns in the data?
- Ensure students have sufficient time (e.g. 20-30 minutes) to perform their calculations and record the percentages. Roam and support students, as needed. You might suggest that a table might be a useful way to organise the data.
- After an appropriate time gather the class to process their answers. Use the pie charts on Slide 7 to check calculations and address the important ideas in the questions above.
Discuss what patterns students noticed in the data. Several of the percentages for fish species stay stable over the four years, e.g. perch, eels, and catfish. However, the carp population seems to grow alarmingly at the expense of the numbers of trout and rudd.
Discuss why that might happen? (competition for same food)
Research online about the problems associated with Koi Carp in New Zealand waterways. - Slide 8 shows the beginning of creating a line graph for the sample data. Line graphs are useful for showing time series data, like the percentages of fish species over time. Provide students with Copymaster Four and ask them to copy the steps in the slide animations. Ask them to finish their line graphs for the other four fish species.
What patterns (trends) do you notice?
What would the percentages have been for 2020? (Interpolating within the range of known values)
What might the percentages be for 2022? (Extrapolating outside the range of known values) - Display good examples of the line graphs on your classroom wall.
Session Five
In this session students have an opportunity to show their learning about percentages. Regard the session as both an assessment and a learning opportunity.
- Provided students with an individual copy of Copymaster Five. Ask them to work independently on the problems. Roam the room to address any issues related to reading and language. Enable access for selected students by providing calculators but expect most to solve the problems using mental and paper strategies.
- After an appropriate time put the students into teams of three to share their strategies and answers.
- Gather the class to address the following issues:
- Question One: What is true of all litters that are 50% white and 50% black? Equal numbers of each colour must be present because 50% = ½ .
- Question Two: How can you work out 20 out of 25 as a percentage?
What fraction is 20 out of 25?
Can you simplify that fraction? (20/25 = 4/5)
If Jamie takes 25 shots what percentage is each shot worth? (100 ÷ 25 = 4)
What is 20 out of 25 as a percentage? (20 x 4 = 80%) - Question Three: What would a percentage bar model for this problem look like?
If Oscar gets 30% off, what percentage of the full price does he pay?
What is 10% of $50?
What is 30% of $50?
How much does Oscar pay? - Question Four: How can we write the catch as a ratio? (5:8:7)
How many fish are there in total? (5 + 8 + 7 = 20 fish)
What fraction of the catch is each type of fish? (5/20 snapper, 8/20 gurnard, 7/20 kāhawai)
Can the fractions be simplified?
What percentage of the catch is each single fish? (100 ÷ 20 = 5%)
What percentage are 5 fish? 8 fish? 7 fish? - Question Five: What percentage of Basket A are apples? (6/10 =60%)
What percentage of Basket B are apples? (11/20 = 55%)
Is there another way to work out which percentage is greater?
Students may consider doubling the Basket A collection to get 12 apples and 8 oranges. Then the size of the sets (wholes) is the same. - Question Six: How do you work out what percentage a fraction is equal to?
In general, divide 100 by the denominator, then multiply by the numerator. For example, for ¾ divide 100 by 4 to get 25%. One quarter equals 25%, so three quarters equals 3 x 25 = 75%.
Why does 3/3 equal 100%?
100% means 100/100, and 3/3 and 100/100 both equal One (the whole).
If 1/10 equals 10%, what does 1/5 equal? (20% because 1/5 is equal to 2/10) - Question Seven: How can you work out 70% of 40? (10% = 4 so 70% equals 7 x 4 = 28)
What percentage of the group are tāne? (100 – 70 = 30%)
How many tāne are there? (40 – 28 = 12 or 30% of 40 = 12) - Use some of the problems students create in Question Eight for the whole class to work on. Make a classroom display of good problems.
Family and whānau,
This week we have been learning to solve percentage problems. We have used a diagram called the percentage bar to visualise the problems and to make good estimates of the answer.
We have used the healthy food pyramid and fish in a lake as the contexts for our work. Ask us about what we have learned.
You might use this context:
I got 75% of my basketball shots in. If I took 24 shots, how many went in?