This is a level (2+ to 3+) mathematics in science contexts activity from the Figure It Out series.
A PDF of the student activity is included.
Click on the image to enlarge it. Click again to close. Download PDF (1657 KB)
Students will:
- gather and record category data and investigate features of the data
- interpret data displays and draw conclusions from graphs.
Students should discover that:
- there is only a weak relationship between volume, mass, or product type and how it is packaged.
classmates
a computer spreadsheet/graphing program
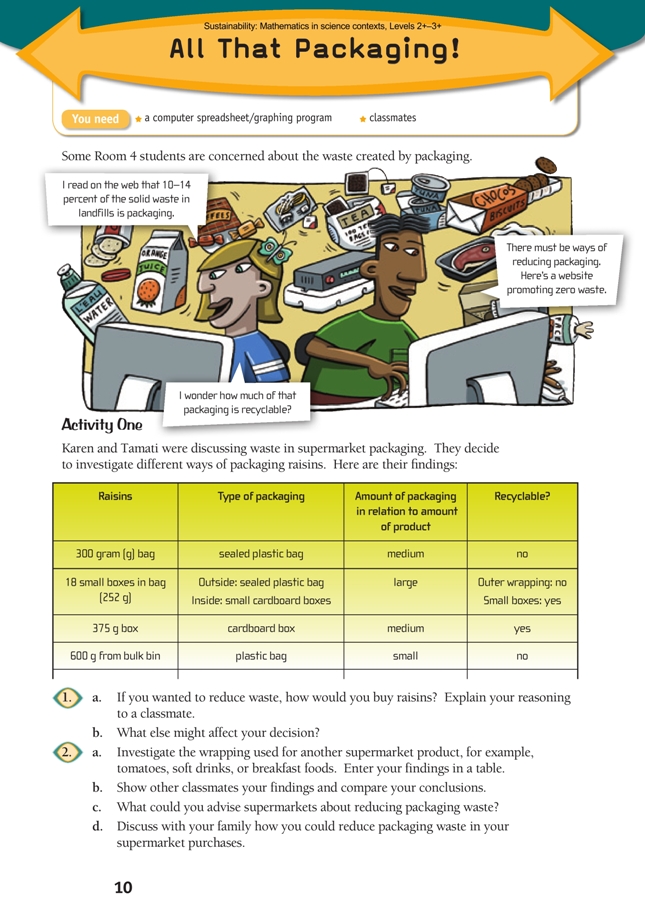
Activity One
Preparation and points to note
For their investigation in question 2, students will have to estimate the amount of packaging by volume in relation to the amount of product (small/medium/large) because measuring is out of the question. Consider doing a calibration exercise in advance, using sample items, before the students investigate their chosen product line. Groups can rate the amount of packaging for items as different as rice, cereal, apples, juice, or health bars and reach a consensus on the amount of packaging relative to the amount of product.
This activity requires students to share their fi ndings and conclusions, so it provides an opportunity to focus on the key competency relating to others. Keep an eye out for students who are reluctant to listen to the views of their classmates (reluctant to participate in a respectful exchange of ideas) or who are not learning to resolve differences by means of mathematical argumentation.
Make sure that students select a product that comes in a variety of packaging; for example, in a small box, a loose bag, and a tray with plastic wrap. Make sure that the students make meaningful comparisons; for example, “A 2 litre bottle of soft drink and a 6-pack of soft drink contain about the same volume, but the 2 litre bottle uses considerably less packaging.”
Points of entry: Mathematics
The focus of this activity is on comparing amount of product with amount of packaging in simple, non-formal ways. Students do not need to be advanced proportional thinkers on the Number Framework to understand that a plastic bag used to hold a single apple is more wasteful than the same bag used to hold 8 apples.
Provide concrete examples; for example, 200 g of chocolate could be packaged as a single bar with a single paper and foil wrapper or as fi ve 40 g bars, individually wrapped. Showing the bars, unwrapping them, and displaying the packaging side by side will illustrate what a difference packaging can make in terms of waste.
Packaging introduces a wide range of variables. For example, based on the chart in question 1, raisins can be purchased as: a sealed 300 g plastic bag, 18 small boxes in a bag, a 375 g cardboard box, or from a bulk bin put into a plastic bag. The notion of variable needs to be deliberately taught. In this context, a variable is mass, volume, or some other factor that might affect or infl uence packaging (for example, liquid content or “wetness”, temperature, serving size, fragility, bruisability, saleability, or stability). Not all variables are numeric!
When a manufacturer is deciding how to package a product, a consideration is how the packages will stack in a carton or on a pallet. As an extension activity, the students could explore this aspect of packaging and see if they can discover why cylindrical shapes (most jars and bottles) are so popular when they use up so much space in a carton or pallet. (They use less packaging material for the amount of product they contain, they are stronger [less crushable] than alternative shapes, and they do not have corners that product gets stuck in. It may be that their shape is also more aesthetically pleasing.)
Points of entry: Science
In these activities, students explore packaging and over-packaging and the reasons for them; these reasons – some science-related, some not – include food safety, hygiene, preservation, marketing, price discrimination, tamper-proofi ng, excluding insects, and ease of transportation.
Encourage the students to look for environmental factors that may have infl uenced the choice of packaging; for example, cans (which are opaque) are used instead of jars (which transmit light) for products that degrade in the light. Ask: What happens to [product] as it moves from processing plant to table? How might temperature, humidity, light, vibration, or handling impact on the product, and how does its packaging seek to minimise these impacts? How does age affect this product, and how does the packaging help give it the longest lifespan possible?
Further investigations
Milk would be a good study. Students may be surprised to learn that, in warm climates, prior to refrigeration and sophisticated treatment, milk had to be used within a day or it went off. They could try and discover why milk, which used to be sold in bottles that were refi lled many times before being recycled, is now sold in opaque plastic bottles and cartons. Ask: What have been the consequences of this shift? Is there a reason why milk containers are not transparent like most juice bottles?
Encourage the students to use the scientifi c method in experimental design: develop a hypothesis concerning milk packaging, fi nd a valid way to test the hypothesis, experiment, record the data, and come to a conclusion about the validity of the hypothesis.
Another possible product for investigation could be tomato sauce, which is sold in tubes, glass jars, cans, and both clear and opaque plastic bottles. The students could easily investigate the two types of plastic bottle:
- Hypothesis: tomato sauce spoils more quickly in clear plastic bottles than in opaque plastic bottles.
- Experiment: pour equal amounts of tomato sauce into a clean, clear plastic bottle and into a clean, coloured plastic bottle and place them outside for a week.
- Data: at the end of the week, record the appearance, smell, and amount of mould in each container.
- Conclusion: (will depend on the data, which may be infl uenced by the weather conditions).
Answers
Activity One
1. a. Decisions and reasoning will vary. Buying raisins from a bulk bin uses the least packaging, but the cardboard box for 375 g creates the least packaging waste (because cardboard is recyclable or will break down).
b. Most likely, the convenience factor. If you buy raisins in large packets, they need to be repackaged in smaller amounts for school lunches.
2. a.–b. Investigations will differ but should follow the inquiry approach. As a general rule, the smaller the individual serving, the more wasteful the packaging. Buying pre-packaged fruit or vegetables in plastic-wrapped trays is a lot more wasteful than putting them into a paper or plastic bag or straight into your shopping basket.
c. Ideas will vary. For example, supermarkets could sell all their fruit and vegetables loose. They could encourage more shoppers to buy products that are available loose from bins instead of buying them pre-packaged. They could investigate ways of packaging meat that do not involve foam plastic trays.
d. Ideas will vary, including some from a–c.
e. Manufacturers have to think about protecting their products from damage during transportation, storage, and shelving and, for food in particular, from contamination by other food products or from the places where they are displayed or stored. Insufficient or bad packaging can result in breakage,
leakage, or health risks. Manufacturers also use packaging to convey information and to appeal to customers.
Activity Two
Points of entry: Mathematics
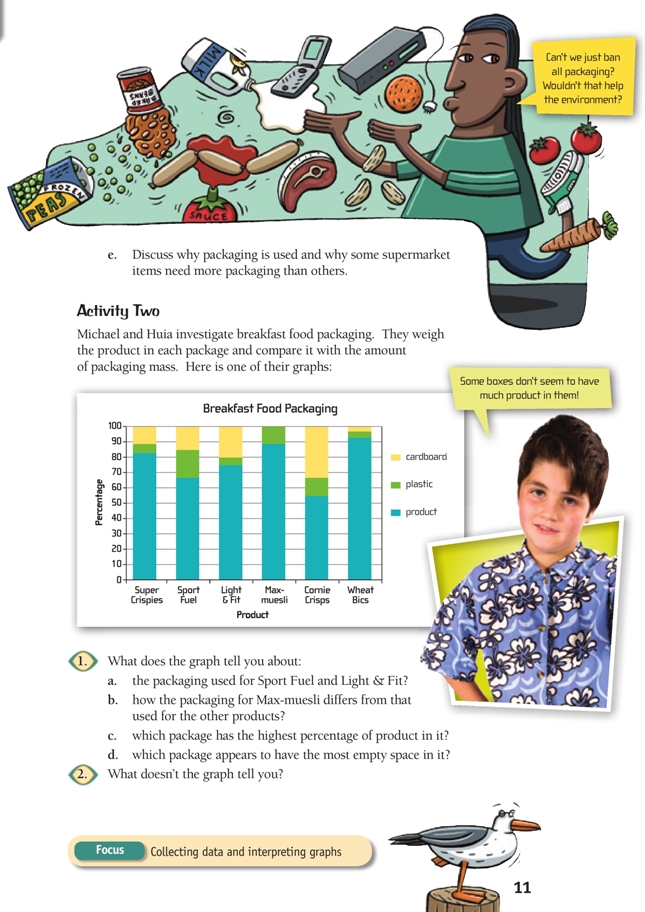
The graph here is a 100% stacked bar graph, a type that is particularly suited for comparing the make-up of products of different size. Your students may not have met a graph like this before, but its interpretation is fairly intuitive: if they look at any one breakfast cereal, they can instantly compare the mass of the cereal with the mass of the packaging.
They should note, however, that the graph does not provide information about total mass or volume (or value for money) and that the boxes of cereal are unlikely to be all the same size. It may be, for example, that the Light & Fit box contains only 250 g of product, while Super Crispies may be a much larger box that contains 500 g of product.
Your students can easily get real data of this kind at the supermarket. (You may need to have a word with the manager first!) They should choose several cereal boxes, note the brand and amount of product (net weight) as listed on the packets (for example, 600 g), weigh them on one of the digital scales in the fruit and vegetable department, and record the mass. Entered into a table, their data might look like this:
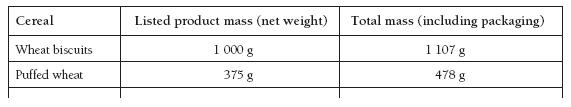
Clearly, using this method, they cannot get separate data for cardboard and plastic when the packaging includes both.
By level 3 of the curriculum, students are expected to know percentages in everyday use and to use
percentages in simple additive and multiplicative strategies. This activity does not ask for calculations, but it can be used to reinforce students’ growing understanding of percentage. They could, for example, be asked to estimate the various percentages on the graph. Emphasise that the purpose of percentage is to enable comparisons.
[Note for teachers. Percentage is not a unit – you can’t buy a scale marked “%”; it only has meaning when applied to a specifi c situation, for example, “25% of the seeds did not germinate” or “37% of people do not pass their driving test the first time”. “Regular” fractions like 1/4, 3/5, or 0.9 have identifiable positions on a ruler or scale (that is, they are numbers on a number line) and are used as measures of relativity (“ of the cyclists had at least 1 puncture”). Percentages have only the latter function; in the current context, they enable students to compare products that come in different-sized packages and contain different quantities.]
Consider using two or three packets of different cereals as a concrete illustration: weigh the full box, take out the inner bag and weigh the empty box, then calculate what percentage of the total mass is cardboard. Challenge your students to compare the contents in the best way they can. Some may use word comparisons (more/less), familiar fractions and/or percentages, or graphic representations. Others may have enough knowledge of percentages to attempt more accurate comparisons.
If you do this, consider also comparing the different cereals by volume. In each case, you will need to empty the contents of the inner bag into the box and shake it down. The students can either estimate visually the fraction of the box that is fi lled with cereal or fi nd a way of measuring the volume of the cereal as well as the box. The students should realise that it is the volume of the box, not the volume of cardboard, that is of interest here.
Points of entry: Science
Make connections to the composition of each product and packaging. For example, plastic is relatively light and cardboard relatively heavy when compared with some cereals. Ask: Why is the portion of packaging for all cereals less than 50%? What does this mean in terms of the amount of cereal you are paying for? (It’s the cereal you want, not the packaging!) Ask If some of the ingredients in mixed cereals are very light, such as puffed wheat or cornflakes, which ingredients probably add the most mass? (Oats, sugar, fruit pieces)
Link this discussion to the students’ knowledge of density; in other words, even if boxes are made of heavy card, they are less dense than cereal because they are hollow. Also, the same ingredient can be cooked or processed in different ways and have different densities, for example, puffed wheat, wheat flakes, or wheat biscuits. Relate density to its constituent parts (density = mass ÷ volume) and challenge the students to compare densities. In other words, given 2 boxes of the same volume, the one that weighs less is less dense, and given 2 boxes of the same mass, the bigger one is less dense. Ask What might be the least dense cereal and the most dense? (Most likely rice bubbles and muesli)
The key competency thinking is suggested as a focus for this activity.
Answers
Activity Two
1. a. Light & Fit is probably contained in a strong cardboard box, perhaps with a light plastic liner. Sport Fuel probably has a strong plastic bag inside a light cardboard box.
b. Max-muesli has no cardboard component (unlike the other products) and is therefore packaged straight into a plastic bag.
c. Wheat Bics (approximately 92%)
d. The most likely answer is Cornie Crisps. Cornie Crisps is packaged in plastic inside a box. The proportion of cardboard suggests that the box is nowhere near full. In fact, almost half of the total mass is plastic and cardboard, so even if the product itself is light, there isn’t much product for all that packaging!
2. The graph doesn’t tell you the mass of each product, the overall size of the product, or whether the cost is reasonable for the amount of product you get.