This unit is about making best option decisions in real-life situations based on cost. Common examples of such decisions are explored, including the cost of taxis, cooking times, hire cars, and mobile phones.
- Calculate the cost of hiring a taxi, hiring a car, and using a phone, and the cooking time for meat.
- Compare the costs of different plans.
- Represent linear relationships using graphs.
- Use graphs to make decisions about the best deal.
The mathematics in this unit involves relationships between variables. A variable is a measure that can take up different values. For example, when making decisions about rental cars, customers relate two variables, number of kilometres or days (distance or time) and amount of money (cost).
Most situations define the roles that the variables take. When hiring a car, it is the distance or time, that is the independent, or explanatory variable. An explanatory variable is the variable that explains changes in the other variable, cost. You expect that travelling more kilometres will cost more. Cost is the dependent, or response, variable.
In this unit the relationships are mostly linear. That means there is a constant growth in the response variable, as constant growth occurs in the explanatory variable. For example, Booma Rentals hires cars at $30 per day plus $0.10 per kilometre. The relationship between cost and kilometres is linear, since you pay 10 cents more for every kilometre. If a linear relation is graphed the ordered pairs (co-ordinates) lie on a straight line.
The learning opportunities in this unit can be differentiated by providing or removing support to students and by varying the task requirements. Ways to support students include:
- using diagrams and acting out as strategies to represent how a cost is made up, i.e. a fixed amount plus a variable amount per unit
- clarifying the language of rates, particularly the word ‘per’, using everyday contexts such as speed and population density
- calculating individual ordered pairs for a situation before trying to generalise a rule or graph
- easing the calculation demands by providing calculators
- using tables and graphs for students to record their working and ease demands on working memory
- using flowcharts to generalise a process or work out the value of the response variable from any given value of the explanatory variable (see examples below).
- using buddy systems where learners are encouraged to help each other
- encouraging sharing and discussion of students’ thinking
- extending by changing the dependent or independent variables in the relationships. What effect does this have on the graphs?
- using collaborative grouping so students can support each other and experience both tuakana and teina roles.
Tasks can be varied in many ways including:
- reducing the complexity of the numbers involved, e.g. simpler costing rules, using whole number amounts
- reducing the demands for a product, e.g. less calculations and words
- accepting verbal or written rules rather than expecting algebraic representations.
The context for this unit can be adapted to suit the interests and cultural backgrounds of your students. Most students nowadays own a mobile phone or know someone who does. Rental cars and taxis are a more familiar context for urban students so be aware that other forms of rental or journey may be more appropriate to rural students, e.g. delivery fees for products. Cooking times of meats can easily be changed to include cooking times of roasting vegetables or other foods. There may be contexts involving rates that are more relevant to your students. Examples might include hire-to-buy schemes, money earned for jobs such as serving at a café or dairy, cost of shipments of hay (delivery charge + cost per bale), water and electricity charges (line + amount per kilowatt hour).
- Calculators
- Dice
- Copymaster 1
- PowerPoint 1
- PowerPoint 2
- PowerPoint 3
- PowerPoint 4
Teachers’ Notes
Encourage your students to choose appropriate forms of calculation, depending on the complexity of the operations and numbers involved. Mental calculation, recording in written form, and digital devices are all legitimate options. In your discussions ask the class how they got the answers and what methods they used to do the calculations.
Session 1
- In this session, students investigate the cost of hiring a taxi from different companies. Most taxi fares are worked out as a combination of a fixed hire fee, called flagfall, and a cost per kilometre of travel. Therefore, a taxi fare is linear relationship between the kilometres travelled, the independent variable, and cost, the dependent variable. In large cities tolls are often imposed for airports, bridges and express roads. These costs are also added to fares, making comparison of route a rich context. Uber fares are a combination of flagfall, time of the journey, kilometres covered, and a fixed booking fee. Therefore, Uber fares are a combination of two fixed costs, and two variable costs.
- Discuss the hiring of taxis, using PowerPoint 1.
Who has ridden in a taxi recently? Why did you go in a taxi? (Slide One)
How did the taxi driver calculate the fare? (Slide Two)
Why was there a dollar amount on the meter before you even started off? - The flagfall usually shows in the fare before the taxi moves. Extras are for items like tolls or extra baggage.
- Ask students to solve these problems in pairs or threes. Allow students to use calculators if they wish, though the calculations are manageable mentally.
Tiki Taxis charge $5 flag fall and $3.00 per kilometre. (Slide Three)
Discuss the meaning of “per kilometre” as a rate “for every kilometre travelled.”
Use Slide Four to show the problems:
Work with a partner to solve the problems together.
How much would it cost you to travel 25 kilometres in the cab?
How much would it cost you to travel 32 kilometres in the cab?
How far could you go for $41?
How far could you go for $77?
Share and korero about your thinking with another pair or group.
- Check the students’ work as you roam the class. Look to see whether they:
- create, and enact, a correct sequence of operations, for example, 5 + (25 x 3) = $80 for the 25 kilometre fare
- recognise that the order of operations is important, and how a digital device processes that order
- use inverse thinking to calculate the number of kilometres for a given fare, for example (77 – 5) ÷ 3 = 24km.
- After an appropriate time, share answers as a class. Try to generalise the methods to calculate either a fare, when given the distance, or a distance, when given the fare.
You might use a flowchart like this: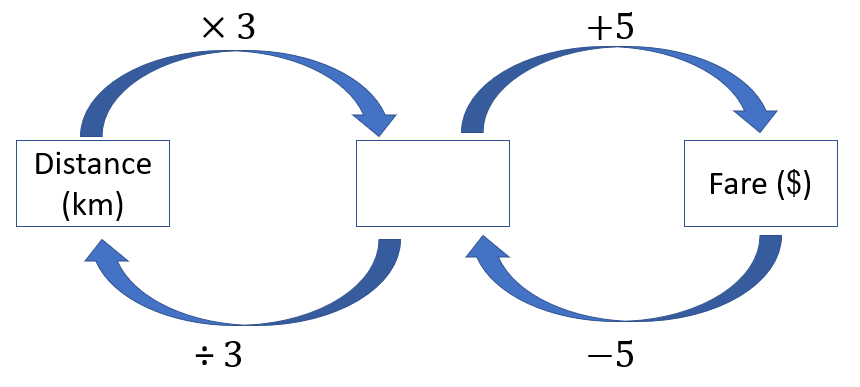
Ask:
Why is the order that we carry out the operations important?
How do we find the distance if we are given a fare?
You might decide to record equations for the flowchart processes. Define the variables; f represents the fare in number of dollars, and d represents the distance in number of kilometres.
If we start an equation, f=, what do we include to show how the fare is calculated, what fare is equal to? (f = 3d + 5)
If we start an equation, d=, what do we include to show how the distance is calculated, what distance is equal to? (d = (f – 5)/3). In this case pay special attention to the vinculum in a fraction also being a symbol for division. - Ask students to go online and locate a graphing tool or use Excel. Set up a graph of the relation between distance and fare. Since distance is the independent (explanatory) variable, it needs to be measured on the horizontal (x) axis. Fare is the dependent (responding) variable and needs to be measured on the vertical (y) axis. Demonstrate graphing a single ordered pair (25, 80) to show the fare for 25 kilometres (Slide Five).
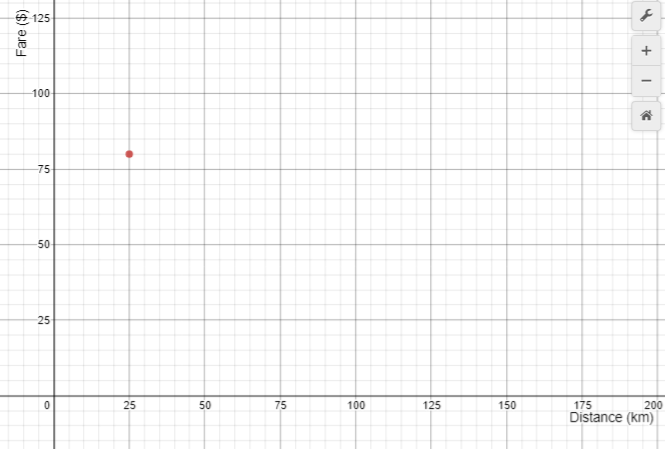
- Ask your students to graph ordered pairs for the other three answers they have about Tiki Taxis, i.e. (32, 101), (12, 41) and (24, 77). Note that the order of the variables in the ordered pair is important.
- After students complete their graph (Slide Six) discuss the relation as a class.
Do you see any pattern? (Student might notice that the graph is linear)
Why do you think the points lie on a line? (Same rate of $3 per kilometre) - Ask students to find other ordered pairs of distance and fare to add to their graph. The task is significant as you want students to recognise that the equation of the graph represents an infinite set of possible discrete points.
- After a suitable time ask your students to enter the equation f = 3d + 5 (Slide 7).
What do you notice?
Can we work out fares and distances using the graph? How?
What would the fare for 30 kilometres be? ($95)
What is the distance of a fare that costs $65? (20 km)
Animating Slide 7 shows how the answers can be read off the axes. - Use Slide Eight to introduce this problem:
Tiki Taxis find they are not making enough money to cover their costs, and to give their drivers a decent wage.
Which option is better, if they want to make more money?
Raise flagfall to $10.00
or
Increase the rate to $3.50 per kilometre - Let students work on the problem in their teams. Roam the room to observe their approach.
- Do they recognise that increasing cost in any way may mean that Tiki Taxis get fewer customers?
- Do they understand increasing flagfall by $5 increases all fares by $5, irrespective of the number of kilometres travelled? This makes short trips relatively more expensive. Is that a good thing for the company?
- Do they recognise that increasing the rate by $0.50 has a more positive effect on income, as more kilometres are travelled?
- Do they use tables, graphs, or equations to represent the two increase scenarios?
- Do all students have a chance to korero about their group's thinking?
- Do all students have a chance to fill both tuakana and teina roles in their group?
- After a suitable time gather the class to share ideas. Slide Nine shows a graph of the two increase scenarios.
What does the graph show? (An increase in flagfall of $5 gives more income than an increase in rate of $0.50 per kilometre up to 10 kilometres)
How far do you think most taxi trips are? (Create some make-believe trips online using Google Maps and use the distance function)
What recommendations would you make to the owners of Tiki Taxis?
Session 2
- In this session students look at the time required to roast poultry. They are encouraged to connect the situations of hiring a taxi and roasting a chicken or turkey. Both situations involve linear relations between two variables.
- Use Slide One of PowerPoint 2 to introduce the scenario of chicken consumption.
What does 43 kilograms per capita mean? (An average of 43 kilograms for every person)
Discuss the fact that this might include bones as well as meat, but every person includes little children and elderly people who eat relatively little.
How many whole chickens make up 43 kilograms? (invite predictions then move to Slide Two) - Slide Two shows how the sizes of processed chickens are worked out. Sizes go up in two as weight increases by 0.2 kilograms or 200 grams. Use the information to work how many whole chickens each kiwi eats on average.
What operation should we perform? (43 ÷ 1.2 = 35.83)
Therefore, kiwis average nearly 36 whole size 12 chickens per year. That’s three chickens every month! - Slide Three shows the way to calculate correct cooking time for stuffed roast chicken.
How long should you cook a size 12 chicken?
What calculation should you perform? (1.2 x 55 + 20 = 86) - Use an online graphing tool or Excel to create axes of weight (in kilograms) and cooking time (in minutes). Plot the point (1.2, 86).
- Slide Four shows the graph and plotted ordered pair. Animating the Slide shows how to read off both measures from the point. Check students know what each number refers to, i.e. 1.2 kg and 86 minutes.
- Ask students to graph other ordered pairs, such as (Slide Five):
How long should you roast a size 18 chicken for? 1.8 x 55 + 20 = 119
If a chicken should be roasted for 97 minutes, what mass is the chicken? (97 – 20) ÷ 55 = 1.4
If a chicken should be roasted for 75 minutes, what mass is the chicken? (75 – 20) ÷ 55 = 1.0 - Each answer provides another ordered pair to add to the graph. Plot (1.8, 119), (1.4, 97) and (1.0, 75). Slide Six has a completed graph.
What pattern do you notice? (Linear)
Why does this pattern occur? (Constant rate of 55 minutes per kilogram)
How is this situation the same as the rental car situation? (A constant rate and fixed time. The fixed time has a similar effect as flagfall in the rental car situation). Share and korero about your thinking with another pair or group.
Students may be able to relate roasting a chicken to their knowledge of cooking chicken in a hāngi. How long should chicken be cooked for in a hāngi? Does cooking time increase if more chickens are being cooked? Why or why not?
- Slides Seven and Eight introduce this problem:
In the Aotearoa New Zealand, it is becoming more common to cook a turkey to celebrate Christmas with whānau. Commercial turkeys are much larger than chickens and have a mass of between 3.6 and 10.8 kilograms, etc.
Let students work on the problems collaboratively with support from digital graphing tools and calculators. Solutions are below:- Is the graph of mass and cooking time linear? (Slide Nine)
The relationship is close to linear.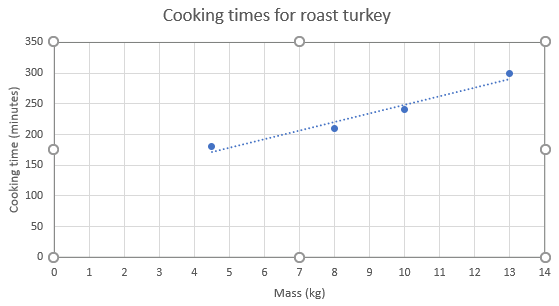
- Find a rule to work out the roasting time for any mass of turkey.
The amount of cooking time goes up by a little over 15 minutes for each extra kilo. For example, between the point (8, 210) and (10, 240), mass increases by 2 kilograms and cooking time increases by 30 minutes. That is 15 minutes per extra kilogram. Students may recognise that their rule should begin as t = 15m but a fixed amount of time needs to be added. They might take any point, say (8, 210), and use it to work out the extra fixed amount.
8 x 15 = 120
120 + 90 = 210
The rule is t = 15m + 90 and can be tested using other known masses and times. For example, 15 x 10 + 90 = 240 minutes. - Use your rule to calculate the roasting time for a 7 kilogram turkey.
15 x 7 + 90 = 195 minutes - Do turkeys take less time, per kilogram, to roast than chickens?
Why might that be?
Chickens take an extra 55 minutes per kilogram compared to 15 minutes extra for turkeys. Mostly that is because a much larger bird takes way longer in the oven to reach a cooking temperature (90 minutes vs 20 minutes) but having reached that temperature cooks more quickly. There is little difference in the density of chicken and turkey though turkey is a little leaner, has less fat proportionally.
- Is the graph of mass and cooking time linear? (Slide Nine)
- Finish the session by posing this problem (Slide 10). Students might work independently on the problem if you want to use the opportunity to assess their understanding of linear relations.
Kiwis eat about 24 kilograms of pork, per capita, each year.
Here are the recommended roasting time details for a shoulder roast.
Put in the oven for 30 minutes at a temperature of 220⁰C.
Turn the oven down to 180⁰C.
Cook the roast for 20 minutes per 500 grams.
Create a graph to help people work out the roasting time for pork.
Slide Eleven provides a model graph.
Ask students to write an equation for the relation between mass and cooking time. (t = 40m + 30)
Have students share and korero about their thinking with each other.
Session Three
- In this session students compare the costs of two different hire car firms. They make decisions about which firm is best for given distances.
- Have a general discussion about hire cars.
Has anyone’s family or friends ever hired a car?
Why did you need to hire a car rather than use your own?
How many days did you hire the car for?
How far did you travel?
Do you know how much it might have cost?
What different things did you have to pay for? - Share Copymaster 1 with the students. Introduce Question 1 then let students work on the problems in pairs.
Question 1: Suppose that Rent-A-Bomb charges $25 a day and 30c per kilometre.
How much does it cost for a two-day hire if you travel 300 kilometres?
2 x 25 + 300 x 0.3 = $160
If you use the car for three days, and the hire costs $291 in total, how many kilometres do you travel?
(291 – 3 x 25) ÷ 0.3 = 920km
If you travel 900 kilometres, in total, and the hire costs $650, how many days do you hire the car for?
(645 – 900 x 0.3) ÷ 25 = 15 days After suitable time, gather the class to discuss the answers.
What different ways did you use to solve these problems?
Which strategies are the most efficient? Have students share and korero about their thinking with each other.
Note that students are likely to use trial and improvement strategies, particularly to problems b) and c). These strategies can be made more efficient by organising data systematically in tables. For example, b might be approximated by choosing likely numbers of kilometres.Number of kilometres Kilometre cost 3-day hire Total cost 300 300 x 0.3 = $90 $75 $165 1000 1000 x 0.3 = $300 $75 $375 800 800 x 0.3 = $240 $75 $315 … … … … The equations given represent an efficient solution that comes from recognising a rule for working out the number of kilometres from the cost or the inverse of that.
A flowchart for a 3-day hire might support students to see the relationships: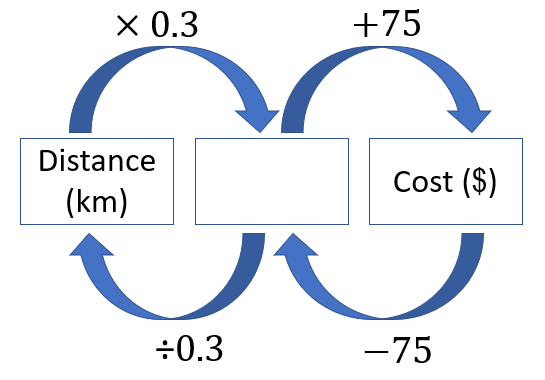
To solve problem 1b put $291 into the cost box and work backwards to find the distance.- Introduce Rent-a-dent, a firm that charges $40 per day and 15c per kilometre. Discuss the parts of problem 2 then ask students to work in their teams. Allow suitable time for students to work on the problems. Then gather the class to discuss their strategies and solutions. Answers are below:
- How much does it cost for a four-day hire if you travel 400 kilometres in total?
4 x 40 + 400 x 0.15 = $220 - If you use the car for two days and the total cost is $197 how many kilometres do you travel?
{197 – (2 x 40)} ÷ 0.15 = 780km - If you travel 800 kilometres, and the total cost is $480, how many days do you hire the car for?
{480 – (800 x 0.15)} ÷ 40 = 9 days
You might use tables again to organise data and flowcharts to suggest the most efficient ways to calculate the answers.
- How much does it cost for a four-day hire if you travel 400 kilometres in total?
- Let’s compare the two firms, Rent-a-bomb and Rent-a-dent.
To simplify things let’s hire the car for one day.
Which company is the cheapest to use?
Can you explain your thinking?
Students might offer ideas like:
Rent-a-bomb charges less to hire the car but Rent-a-dent charges less per kilometre.
- Go to an online graphing tool or Excel.
How might we graph the deals from both companies on the same graph?
What are the variables? (Distance and cost)
What rule connects kilometres and cost for each company?
What is the equation for that rule?
Collectively develop a graph that looks like this (PowerPoint 3, slide 1):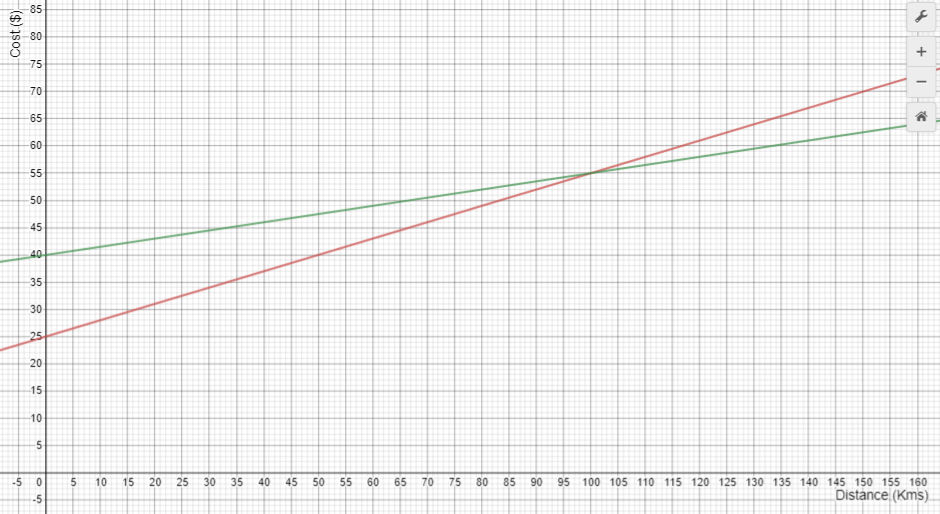
- Send students away in pairs to create their own graph and answer these questions (animate Slide One for questions to appear):
- Which company belongs to each line? How do you know? Label the lines.
- Which company is cheapest if you only want to travel only 80 kilometres? How do you know?
- What does the intersection of the lines mean?
- Which company is the cheapest to hire from, for one day?
Session 4
In this session students look at mobile phone plans. For many people mobile phones are also their source of emails, music and internet. Plans are developed by companies to attract consumers who meet patterns of phone use. The best plan for one person is not necessarily the best for another. Variables to consider are time in phone calls, number of texts, and amount of data.
- Have a general discussion about mobile phones.
Who has their own mobile phone? What do you use your phone for?
How many times a week would you use it to phone someone?
How many text messages would you send in a day?
What does it cost to use your phone?
Who pays for it?
The discussion should show that use of mobile phones is variable and that they cost money.
How do you select the best deal for your phone? - Search online for a tool that compares companies in Aotearoa. Browsing through such a site shows how complex the choice of plans and companies is. Slide One of PowerPoint 4 asks:
What details do you usually look for in mobile phone plans?
Generally, plans include the amount of data, minutes of calls, and number of texts. Sometimes they include special deals like extra data, memberships to entertainment providers or music channels, and interest free purchase of phones. - Use Slide Two to discuss these features. Hotspot is the ability to run data through another device, such as a laptop, in locations where there is coverage.
Mobile phone plans contain a lot of variables. Let’s simplify the situation by looking at just one variable, data volume.
What is meant by data? (Pieces of information)
Slide Three shows the commonly used file sizes.
A gigabyte equals 1000 x 1000 x 1000 = 1 000 000 000 = 1 billion bytes. To put things into perspective:
1 GB of data is equivalent to about 210 000 text only emails, or 250 3-minute MP3 videos, or 600 high resolution images. A standard movie DVD contains about 4.5 GB of data.
Terabytes (TB) are another common unit of data. For example, if you buy an external hard drive for your computer it is likely to be several terabytes in size. One terabyte equals 1 000 GB, which equals 1 000 000 000 000 bytes (1 trillion). - Slide Four introduces three different plans.
What is the same and what is different about these plans?
Students should notice that everything is the same except the volume of data.
Is there a relationship between the amount of data and the price of the plan?
If a plan is exactly the same, but allows 8GB of data, how much should you pay per month? - Let students work on the problem. Allow access to online graphing tools. Encourage students to develop rules connecting the amount of data and the cost. Suggest that a graph may be useful. It may be helpful to remind students of the rules developed in Session 1 and Session 2.
- After a suitable time gather the class and discuss their findings. In general Flight has a base charge for the package of unlimited calls and texts. It charges an extra $8per month for each 1GB of data. A rule might be c = 8d + 13, if c represents cost in dollars, and d represents amount of data in GB. The graph is linear.
- Slide Five shows three plans from a different company, Bolt, that trades off data for call minutes.
All of these plans cost the same, but which one is best?
Justify your choice of plan.
Let students discuss the plans. They should notice that the relationship between data and call time is negative. That is, when one goes up the other goes down. Choosing one of the plans is likely to be dependent on usual phone usage, preference for internet browsing versus making calls to friends and family. - Show Slide Six which has a graph of the relationship between data and call time.
Is the relationship linear?
How is the relationship different from the others we have seen?
Imagine a plan with same cost that has only call time. How many minutes would you get?
Imagine a plan with same cost that has only data. How many gigabytes would you get? - Animating Slide Six shows a trendline that answers the last two questions.
Find a rule that relates call time to data. Let t represent call time, in minutes, and d represent amount of data, in gigabytes. (t = 240 – 40d) - Slide Seven contains an investigation in which students consider their own mobile phone preferences. They choose one plan and justify their choice to a partner.
- After a suitable time gather the class to discuss their choices.
Is there a best deal? Explain.
Session 5
In this session we give the students a chance to operate a hire car company.
- Play the hire car game as given below.
- Get the class to report back at the end of the session.
The Hire Car Game: Students work in teams of three to operate their own hire car company. Each team has overheads of $20 a day per small car, $25 a day for a medium car, and $35 a day for a large car, whether the car is used or not. Overheads cover the cost of the vehicle, insurance, building rental, cleaning staff, etc. Costs occur each day irrespective of whether the car is hired or not.
- Each team sets their price for hiring a small, medium, or large car to the rest of the class. For example, they might set the costs of cars as follows:
Small Car $35 per day + 0.25c per kilometre
Medium Car $40 per day + 0.30c per kilometre
Large Car $45 per day + 0.35c per kilometre
Each company choses its stock level of cars from a minimum of 4 cars to a maximum of 10 cars. The company nominates the size of each car and assigns each car an identification code, e.g. Car 1. - Hire time consists of enough rounds that each hire company has a chance to get customers. Three teams of three players become the competing hire companies. Each other player is a customer who rolls two dice, then adds the two numbers that come up. If a customer gets a total of 2, 3 or 4 they must try to hire a small car; for a total of 5, 6, 7, 8 or 9 they hire a medium car; and for 10, 11 or 12 they hire a large car. To work out the number of kilometres they will travel the customer rolls the dice again, totals the two numbers, then multiplies by 15km. For example, a customer might roll 4 and 2 first. 4 + 2 = 6 so they hire a medium car. Next, they roll 1 and 4. (1 + 4) x 15 = 75km which is the distance of their trip.
- Each customer must hire from the company that gives them the cheapest price for the size of car and kilometres they travel. No friends here – this is business!
- The company owners keep track of their receipts and bills. Financial records can be audited by IRD (teacher) at any time. A fine of $200 applies to poor financial records. Companies might use a spreadsheet to track income and expenses.
- If a company is out of cars for any reason, they can (i) give the customer a larger car at the cost of the original sized car; (ii) borrow a car from a competitor at an extra $10 cost; or (iii) pass the client on to another company.
- Play the game each day for one or two weeks.
- The winner is the company that make the largest profit.
Family and whānau,
This week we have been investigating the cost of hiring taxis, renting cars, and operating a mobile phone. We've used mathematics to make decisions about the best option to choose, and justified the choices we made when selecting a service or plan. Students have been asked to do some research at home related to the costs of phone plans. It would be helpful if you could discuss your family phone plans and why you have made the choices you have. Ask your student to identify the important considerations when deciding on a phone plan. Looking online for sites that compare phone plans would help to support your discussions. Thanks for your help.