In this unit we use thermometers to investigate questions about temperature. We explore questions relating to cooling patterns, the effect of location on temperature, and the results of mixing of water with different temperatures.
- Use thermometers to measure temperature in degrees Celsius.
- Investigate factors that influence temperatures.
This unit is a useful connection to key science concepts such as experiment design, energy and insulation, and to recording, analysing, and reporting from data.
The focus of the unit is the attribute of temperature and how it is measured. Temperature is the amount of heat present in a substance. The standard unit of measurement for temperature in New Zealand is the degree Celsius (written ⁰C). Two benchmark temperatures ‘anchor’ the scale of degrees Celsius.
0⁰C is the freezing temperature of water at sea level, i.e. changes from liquid to solid (ice).
100⁰C is the boiling temperature of water at sea level, i.e. changes from liquid to gas (steam).
Temperatures below 0⁰C are recorded using negative numbers. For example, a temperature of -15⁰C is fifteen degrees below zero, the freezing point of water.
The learning opportunities in this unit can be differentiated by providing or removing support to students, by varying the task requirements. Ways to support students include:
- maintaining a practical focus through physically measuring the temperature of substances
- explicitly modelling of measuring temperature, particularly reading scales
- creating large, physical models of the number line so students can locate points on a scale and walk given number of degrees
- providing recording formats to support students to organise the measurement data
- using digital graphing tools to present data and allow for sorting and resorting
- encouraging sharing and discussion of students’ thinking
- using collaborative grouping so students can support each other and experience both tuakana and teina roles
- students could be extended by discussing temperature as an interval system of measure (sometimes called an interval scale). Measuring temperature in degrees Celsius is an interval system, not a ratio system. For example, an object at 20°C does not have twice the energy of when it is 10°C; and 0°C is not the lowest Celsius value. Therefore, degrees Celsius is an interval measurement but does not have the characteristics of ratio measures like weight or distance.
Tasks can be varied in many ways including:
- developing confidence and fluency with the whole number parts of the temperature scale before working with negative temperatures
- encouraging mahi tahi (collaboration) among students
- requesting systematic ways to answer questions and to record data
- using visual ways to display data, particularly line graphs and scatterplots.
The contexts for this unit can be adapted to suit the interests and cultural backgrounds of your students. Temperatures related to places students are most familiar with, or have interest in, will provide motivating contexts. Use locations that students may have visited on holiday, or have whānau living at. Draw on the everyday experiences of water temperature, such as running a hot bath, swimming in the sea, a lake or river, and making ice-cold drinks on a hot day. Relate temperature to dressing for different weather conditions. Use contexts from history such as traditional cooking in thermal pools, ways that pre-European Māori stayed warm, and importance of fire.
- Plastic or polystyrene cups
- Stop watches, mobile phones, or wrist watches with second hands
- Used newspapers and aluminium foil
- Rubber bands or tape to wrap cups
- Spirit based thermometers capable of reading to 100⁰.
- Ice cubes, and access to hot and cold water
- Buckets or plastic trays to restrict spillage (optional)
- Copymaster 1
- Copymaster 2
- PowerPoint 1
- PowerPoint 2
Session One
- Show students slides one and two of PowerPoint 1.
What are these devices?
What do they do?
When is measuring temperature important? (testing for illness, keeping food cool, knowing what to wear, etc.)
How do liquid thermometers work? (As the liquid in the tube is heated it expands and takes up more space inside the tube) - Use an image of a thermometer from Slide Two as a focus for the discussion (enlarged on a photocopier or projected onto a screen). To confirm the students' ideas a simple thermometer can be created from a conical flask or bottle, a blob of plasticine, and a transparent straw. Many videos exist online about how to construct a simple thermometer from these materials.
- Show Slide Three. The first image shows a blank thermometer.
What is missing from this liquid thermometer? (Markings)
What do the markings show? (Degrees in Celsius, sometimes Fahrenheit)
How is zero degrees decided? (Freezing temperature of water)
How is 100 degrees decided? (Boiling temperature of water)
You might look online to learn how the Celsius scale was developed, and why it is sometimes referred to as “centigrade.” - Ask: What is room temperature at present?
Invite estimates then check by giving each group a thermometer.
How accurate are our thermometers?
You might gather data about the temperature measurements of room temperature. Expect some variation as inexpensive thermometers are less accurate than scientific thermometers. - Tell students that they are going to investigate how quickly a thermometer adjusts from room temperature to reach the temperature of hot or cold water. Provide each group with two thermometers and two cups of water. One cup should contain tap water with some ice cubes in it, the other should have warm water (no more than 50°C). Ask a couple of students to dip a finger in each cup and estimate the temperature. Ice water usually has a temperature of 4-10°C. Warm water out of a hot tap should not be hotter than 49°C. Invite ideas about what will happen when a thermometer is placed in each cup. (The level of the spirit will rise or sink until the correct temperature is found.)
Tell the students to take the temperature reading every 30 seconds once the thermometer is immersed. One student will need to time the intervals with their watch, phone, or the class clock. The results should be recorded in a table like this:
Time (sec) 0 30 60 90 120 150 180 » Hot Water 45 43 41 40 39 38 37 » Cold Water 6 8 10 11 13 14 15 » Collect data for about ten minutes.
- Ask the students to record the results on a line graph showing time in seconds (horizontal axis) and the temperature readings in degrees Celsius. You may want students to construct the graph by hand or use a graphing tool such as a spreadsheet or online graphing tool.
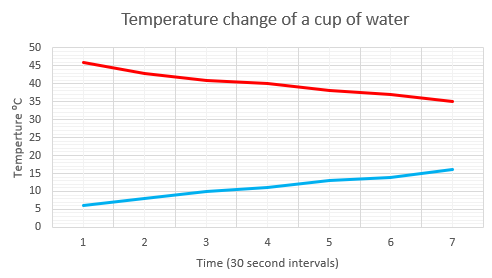
- Gather the class to discuss trends in the time series graphs.
What trends appear in the graphs?
What will happen in the next ten minutes? Why?
Will the lines cross? Why, or why not? - After some discussion asks students to return to each cup and check the temperature of the water.
Does the data match your prediction?
Why do the lines appear to be levelling off?
A key idea is that loss or gain in temperature of the water is a result of heat transfer between the water and the surrounding air. If the difference in temperature is great, then the rate of cooling or heating is greatest. As the water gets closer to room temperature the rate of cooling or heating gets less. For example, a hot cup of milo cools fastest straight after it is made. - Encourage students to explain what patterns they can see in the data and why they believe it occurs. Look for ideas about the thermometer spirit taking a short time to "heat up" or "cool down" to the temperature of the water and but taking a longer time to close in on the classroom air temperature.
- The next challenge requires students to appreciate the feel of water temperatures. Each group needs to be provided with plastic cups, thermometers, hot tap water, cold tap water, and some ice cubes. Pose the following problem (see images on Slide Four):
The average temperature of water in Lake Taupō is ten degrees Celsius (10°C). The water in a bathing pool in the Polynesian Baths (Rotorua) is at a temperature of 32°C. Using the materials you have, mix two containers of water, one at each of these temperatures? - Allow the students time to solve the problem. Note that the 32°C cup of water may be hard to sustain at that temperature and may need to be topped up with hot tap water which is about 45-49°C. Similarly, the 10°C water will need regular addition of ice.
If both cups were left for two hours, what temperature would each cup of water be then? (Both will approximate to room temperature.)
Why?
Session Two
For the next 3 days the students will use thermometers to investigate questions about temperature. The first questions relate to cooling patterns.
- Ask: Does a large amount of water cool faster or slower than a smaller amount?
Does wrapping a container of water in paper result in it cooling faster or slower? - Invite the students to form conjectures about these questions, encouraging them to explain why they believe things will occur. Set up the following experiments to test the conjectures.
- Two plastic cups are set up with different amounts of the same hot water. It is important to fill both cups with the same hot water before the test is started. Read the thermometers every minute.
- Three cups are filled with the same amount of water and covered with cling film. Leave one jar as is and choose different materials to insulate the other two with, ideas could be tinfoil, bubble wrap, fabric, or newspaper. Poke the thermometers through the cling film and read the thermometers every two minutes.
- Encourage your students to show their findings using graphs and/or tables and to report what their data show. Larger containers of water take longer to cool to room temperature as the ratio of volume to surface area is less, so there is less heat transfer to the air. This phenomenon is also true of animals in adverse climates. Young children are particularly vulnerable in extreme temperatures. Similarly, wrapping containers disrupts heat flow between the water and outside air. Effectively students are insulating two of the containers.
How is the idea of wrapping containers of hot water useful in daily life? (Hot water cylinder cladding; wrapping of pipes in cold climates.)
How is the idea of wrapping used by us in everyday life? (Clothing, insulation of houses, etc.) - The Figure It Out activity, Cold Coffee, can be used to provide a dataset for this activity.
Session Three
- The second day involves explaining what factors influence the temperatures of locations around Aotearoa. Find an online site that provides temperature data. If this unit occurs in New Zealand summer the maximum daily temperatures are likely to be mostly positive. In the New Zealand winter, there will be significant differences between temperatures, including negative values.
What locations in Aotearoa have you visited when you were on holiday?
What were these places like? What highlights do you remember?
How did you know what clothing to take when you visited? - That question will lead to a discussion about weather:
What factors make a difference to the temperature of a location?
Students will raise the idea that seasons influence temperature. Discuss the rotation of seasons and how that cycle relates for the axis rotation of the Earth as it orbits The Sun. There are many excellent videos depicting the seasons.
Temperature changes with the seasons. Are there permanent features that influence the temperature of a location all year round?
Students might raise factors such as closeness to the equator (measured by latitude), proximity to the coast, and altitude (measured by height above sea level). Make a list of the factors that students believe have a long-run effect on temperature. - Ask if any students would like to share their iwi, hapū, or marae locations. For example, how do temperatures in Ngā Puhi's land compare with Kai Tahu's? How do temperatures at your local marae compare with another?
Make a list of places to investigate. Each team of three students are allocated five locations from the list. Discuss the idea of average as being a measure of centre or middle, and the need to round decimals to the nearest whole number. Establish a protocol that coastal locations have a lowest altitude of zero metres and a distance to the sea of zero kilometres. Ask your students to find out the following data about each location.- Name: Wellington
- Country: New Zealand
- Hemisphere: Southern
- Latitude (distance from equator): -41.2⁰S
- Altitude (height above sea level): 0m
- Distance from sea: 0km
- Average winter temperature: 11.9⁰C
- Average summer temperature: 20.1⁰C
Additionally, students could investigate cities worldwide and make comparisons between Aotearoa locations and other places around the world.
- Create a class spreadsheet to collate the data. A member of each team can enter the data from each city into the database. You may want to save time by using Google Docs to host the database. Many students can enter data at the same time.
Gather the class for a korero.
We are trying to find out what factors affect the weather in a location over the long term.
Let’s ask some questions of the data.
Invite questions such as:
Are places further from the coast/higher in altitude/further from the equator cooler than those further inland?
Are locations in Te Ika-a-Māui (the North Island) hotter or colder than those in Te Waipounamu (the South Island)?
Do inland cities have a bigger average temperature range, between summer and winter, than coastal cities?
Are cities in the Northern hemisphere hotter or colder than those in the Southern hemisphere?
Encourage sharing and discussion of students’ thinking.
- Encourage your students to use graphing software online to analyse the data. CODAP is a free download and is very intuitive to use. It allows for downloading of the database in CSV form using ‘drag and drop’ functionality. Check to see that students make appropriate choices for the types of graphs they use.
- After a suitable period of investigation, ask the students to create a report of their findings. The report should include conclusion statements supported by summaries of the data, including graphs.
- Encourage the students to apply what they have learned to cities in Australia. The range in geography and students’ familiarity with the locations make this an ideal context for study.
What do you expect the average temperature of Melbourne, Perth, Darwin, Brisbane, Alice Springs, Brisbane, Broome, Hobart to be like?
Will there be much variation between winter and summer in these cities?
Students may remember big variations in the temperature of Hobart and Melbourne caused by cold Southerly flows and hot Northerly flows. Temperatures in the tropical cities of Darwin, Broome and Brisbane tend not to vary much from winter to summer but humidity levels change considerably.
You may discuss the impact of humidity, and wind chill, on how temperature feels.
Session Four
In this session students investigate the use of integers (positive and negative numbers) in the Celsius scale.
- Use PowerPoint 2 to introduce the use of negative numbers on the Celsius Scale. Slide One shows a thermometer recording a temperature of -13⁰C, that is, thirteen degrees below zero. The scale is difficult to read as the mark for negative ten degrees is the underline on which -10⁰C is resting, and the negative sign is assumed. Support students to read the scale.
How cold is negative thirteen degrees?
Has anyone in the class experienced a temperature like that? - Slides Two and Three are about the significance of 100 and zero degrees Celsius, measures of the boiling and freezing points of water at sea level (water boils at a lower temperature at higher altitudes – just ask a mountain climber!)
- Look online to find a short video about the Celsius scale but avoid anything about converting between degrees Celsius and Fahrenheit (⁰F).
- Use Slide Four to practise reading a thermometer in degrees Celsius.
- Provide students with copies of Copymaster 1 that contains several blank thermometers. Slide Five shows how numbers of degrees can be placed on the scale.
How many degrees is each division on the scale? (10⁰C) - Work through Slides Six through Eight and ask you students to create a thermometer that shows each temperature. Ask them to use a fresh blank thermometer each time.
- Slides Eleven through Fourteen present three problems about differences in temperature. Work through each problem and ask students to work in pairs to solve them. Encourage students to use blank thermometers on Copymaster 1 to show their thinking. The second slide for each problem shows a number line model.
- Finish the lesson with this problem (Slide Fifteen):
Investigate.
Why do parents and doctors often take your temperature when you are unwell?
If you have a temperature of 40⁰C should you seek medical advice?
Explain. - Allow students access to online sites to research their answer. After a suitable time, have a korero about their responses. High temperature is a sign that your body is fighting an infection. Any temperature above 37⁰C indicates a fever, but 40⁰C signals a high fever. Also discuss hypothermia that occurs if a person’s body temperature drops below 35⁰C. You might look up what to do in both cases; fever, and hypothermia.
Session Five
- In this lesson students investigate mixing of water with different temperatures. Ocean temperatures, particularly those in the main currents, have a significant effect on world climate. Currents act like giant conveyor belts taking warm water from the equator towards the poles, and cool water from the poles towards the equator.
- Ask: Have you swum in the sea and noticed that it was cold even though the weather was warm?
Why was the water so cold when the air was warm?
Students will recall experiences when the water was hot and cold.
Today we will investigate what happens when we mix hot and cold water. - Pose this problem: I have two cups with the same amount of water in each. The water has a temperature of 30°C in one cup and 10°C in the other. If I mix these two cups of water together, what temperature will the mixture be?
- Invite students’ ideas about the possible solution then allow groups to investigate. They will need cups, thermometer, hot and cold water, and ice cubes for cooling.
While some inaccuracies may occur due to the temperature transfer, in general the temperature of the mixture should be the mean (average) of the waters being mixed, i.e. 30°C + 10°C = 40°C, 40°C ÷ 2 = 20°C. On a number line the mean appears as the central point between the two measurements.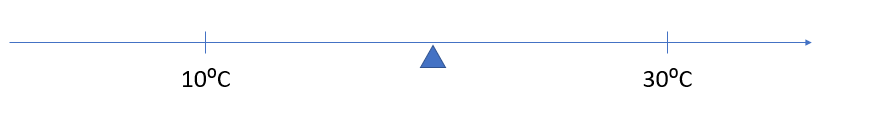
Simple averaging works when the amounts of water in each cup are the same. - Allow the students to investigate other mixtures of equal amounts of water, such as 100mL at 40°C mixed with 100mL at 10°C (Average 25°C). Move to mixture problems where the amounts of water are different, such as 200mL at 40°C and 100mL at 10°C so they can establish the idea of a "weighted" mean. That is twice as much water is at 40°C than 10°C so the mean is worked out by 2 x 40°C + 1 x 10°C = 90°C, 90°C ÷ 3 = 30°C.
- Copymaster 2 can be used to provide mixing problems.
How do you work out the mixture temperature when the amounts of water in each cup are different? - Students could be asked to write mixture problems for their classmates to solve.
Extra problems
Problem One: Are we good at estimating water temperature?
- Make up several labelled cups of water at different temperatures up to about 49° C. Ensure each cup is wrapped in newspaper or cloth inside a tin can to limit the loss of temperature. Put an ice cream container beside each cup. The students go to each container and estimate the temperature of the water. Their estimate is written on a small piece of paper that is put into the ice cream container. After all the estimates have been done the cups and containers are distributed among the groups.
- Ask students to:
- Find the temperature of the water using a thermometer
- Display the estimates on a dot plot or stem and leaf graph
Problem Two: Why do people wear light coloured clothing in the summer and dark clothing in the winter?
- Allow the students to give their reasons and record these on a board or chart.
- Tell the students that they are going to check the effect of different colours on temperature. Each group makes up the same shallow containers of water (delicatessen or take away containers are ideal) at tap water temperature. Cover each container with plastic wrap to prevent water loss and wrap it with paper or fabric. The papers or fabrics (varying only in colour) used should reflect a range of colours from black to white.
- Leave the containers in a hot sunny location for a few hours. Record the temperature of the water in each container by poking a thermometer through the plastic wrap. Record the results. Ask: What does this tell us about light and dark clothing?
Problem Three: What times of the day are the hottest? What times are the coldest?
- Tell students that they are going to take the air temperature at half-hour intervals during the day. Do this in four different locations, direct sunlight (sheltered), direct sunlight (breeze), shade (sheltered), shade (breeze). Ask them what patterns they expect to see in the temperatures. Record their ideas. Carry out the experiments standing the thermometers up. A small cardboard box with one face cut out makes an ideal thermometer holder for many groups. The open face is placed on the ‘sunny side’.
- Every thirty minutes the students need to check the readings. A period from 9.00 am to 2.00 pm is ideal as it allows time to process the data and suggests that students might like to extrapolate their results for times after 2.00 pm. (e.g. I think the temperature will be 24°C at 3.00 pm.)
- Ask the students to display their data on a multiple line graph.
- Invite the students to make statements about what the data shows. They should be encouraged to support their statements by referring to the line graphs.
Family and whānau,
This week we have been looking at temperatures. We’d like you to do an experiment at home that can be reported to the class.
Temperature Problem
Take three ice blocks that are as close to being the same as possible.
Put one on a plate, one in a glass of cold water from the tap and one in a glass of hot water from a kettle.
Guess:
- Which ice block will melt first, and which will melt last?
- Guess how long each ice block will take to melt
- Record the times that the three ice blocks actually take to melt.
Bring your results to school by Thursday, and we’ll put all the data together to produce a class graph.