This is a level 3 statistics activity from the Figure It Out series.
A PDF of the student activity is included.
Click on the image to enlarge it. Click again to close. Download PDF (1589 KB)
construct a time-series graph
answer questions from graphs
make conclusions from own investigation
This diagram shows the areas of Statistics involved in this activity.

The bottom half of the diagram represents the 5 stages of the PPDAC (Problem, Plan, Data, Analysis, Conclusion) statistics investigation cycle.
newspaper, tinfoil
FIO, Level 3, Statistics Revised Edition, Cold Coffee, pages 22-23
Access to a computer spreadsheet/graphing program (optional)
A classmate
Activity One
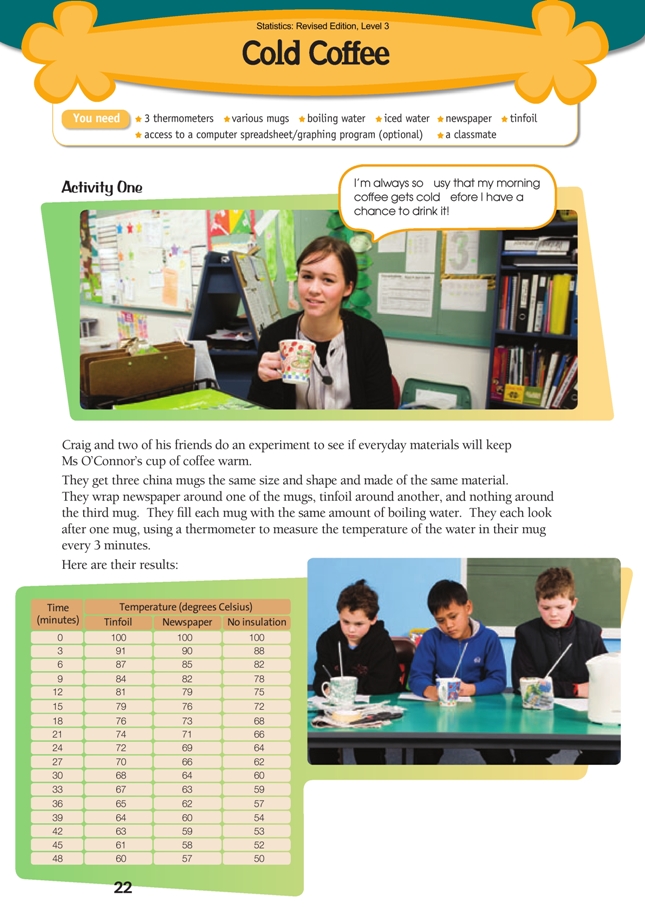
This scenario involves temperature data gathered over a 48-minute period. The task is to graph and then interpret the data.
The appropriate graph is a time-series graph. Such a graph is best created using a computer graphing program, if available. A likely process is:
• Enter the data from the table in the students’ book into the computer spreadsheet (keep the same table structure).
• Select the three columns of temperature data and their headings (but not the data from the time column) and create a line graph using the Line chart option.
• From the Chart menu, select Source data and then the Series tab. Click the cursor in the box that says Category (X) axis labels and then select the cells in your spreadsheet that contain the time intervals (0, 3, 6 …).
• To get the labels on the horizontal axis aligned with the “tick marks”, right-click on the horizontal axis to obtain the Format axis options. Select the Scale tab and then remove the tick from the check box beside Value (Y) axis crosses between categories.
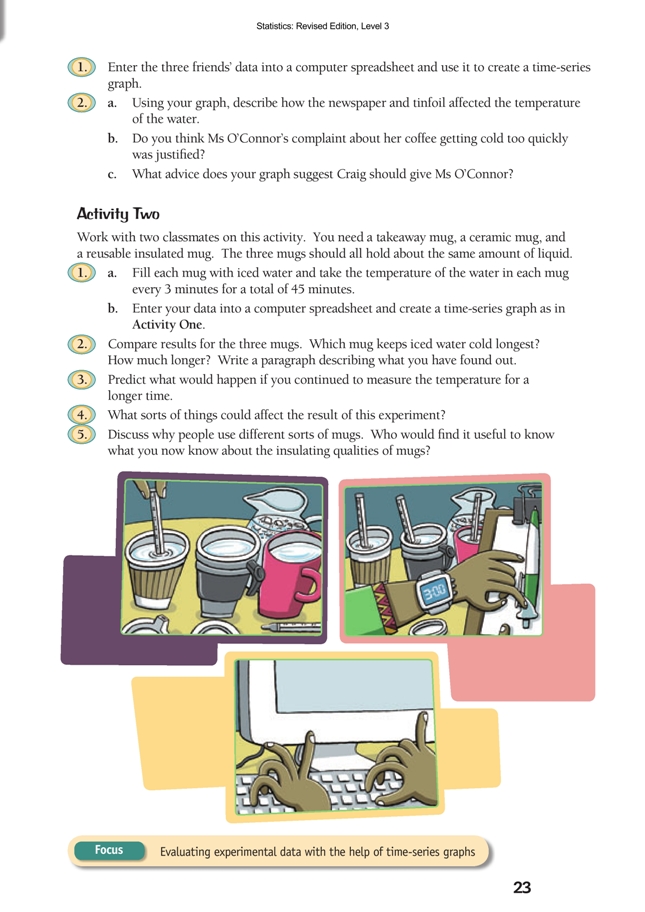
Activity Two
This activity involves a simple science experiment. Like all experiments, it needs careful preparation if it is to yield worthwhile data. The idea is to fi nd out how the physical properties of a mug affect the temperature of the contents. For the purposes of a classroom experiment, iced water is a less risky option than boiling water.
Involve the students fully in setting up this experiment and expect them to use all the knowledge they have acquired in their science learning. List all the variables that will infl uence the outcome and decide how these can best be controlled so that the experiment is a fair test of the mugs’ insulating properties. For example, the volume of water in each mug should be the same, as should the thermometers used to register the temperature. It doesn’t matter exactly what mugs are used as long as they are likely to have very different insulating properties. It is this difference that will make the experiment interesting.
In the debrief that follows the experiment, discussion could focus on these areas:
• A comparison of the two time-series graphs: how are they different and how are they similar?
• What factors might be responsible for the initial, rapid temperature change?
• If the experiment was continued for hours or even days, what would happen to the graphs?
(They would level out as they reached the ambient [surrounding] air temperature and then rise and fall in response to changes [including night–day fl uctuations] in the ambient temperature.)
• What does the slope of the graph tell us? (An upwards slope indicates an increase in temperature and a downwards slope a decrease. The steeper the slope, the faster the increase or decrease.)
Answers to Activities
Activity One
1.
2. a. Descriptions will vary but should report that, over time, the water in all three mugs cooled, but more slowly in the mug wrapped in newspaper and even more
slowly in the mug wrapped in tinfoil.
(Alternatively, both the newspaper and the tinfoil helped keep the water hot longer,
but the tinfoil was more effective than the newspaper.) Regardless of the mug, the
temperature changed most quickly in the first few minutes and then more and more
slowly. It could also be noted that, even after 48 minutes, there was only up to 10
degrees difference in the temperatures.
b. Probably not. Even with no insulation, the temperature was still 72 degrees after
15 minutes. Most people would be able to drink their coffee in this time (unless
they forget it’s there!).
c. Advice will vary. Craig may suggest that Ms O’Connor use an insulated cup, which would be at least as effective as tinfoil.
Activity Two
1.–2. Practical activity. Results will vary. Paragraphs need to relate to the graphs.
3. The temperature will continue to increase, but more and more slowly, until it reaches room temperature.
4. For example, the room temperature, how quickly you get the water into the mugs, having exactly the same volume of water in each mug, whether measurements are done at exactly the right time and in the same way, whether the thermometers used all read temperature accurately, whether the mugs experience the same environmental conditions (for example, one isn’t in a draught or in full sun).
5. Discussion will vary. Workers who buy hot drinks from street vendors need to be sure that their drinks will still be hot when they get to work and while they drink them. Some people use insulated mugs with lids for maximum heat retention.
Key Competencies
Cold Coffee can be used to develop these key competencies:
• managing self
• relating to others
• participating and contributing