Purpose
The purpose of this activity is to support students in representing linear relations on a number plane.
Achievement Objectives
NA4-9: Use graphs, tables, and rules to describe linear relationships found in number and spatial patterns.
Required Resource Materials
- Squared paper
- PowerPoint (in paper form or displayed on a shared screen)
Activity
- Show slide 1 of the PowerPoint.
What is the general rule for this growing pattern?
You may need to revisit the rule, “the number of squares equals the Shape Number multiplied by three then add two.” Algebraically the nth term is 3n + 2.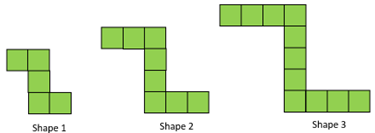
- Support students to graph the pattern on squared paper. Consider what additional supports will be needed around drawing and labelling axes and scales correctly. You might model these processes to ensure students' graphs are consistent.
Students should plot the points on their own graph. This process supports them to notice the setup of the axes, titles, and how to locate points.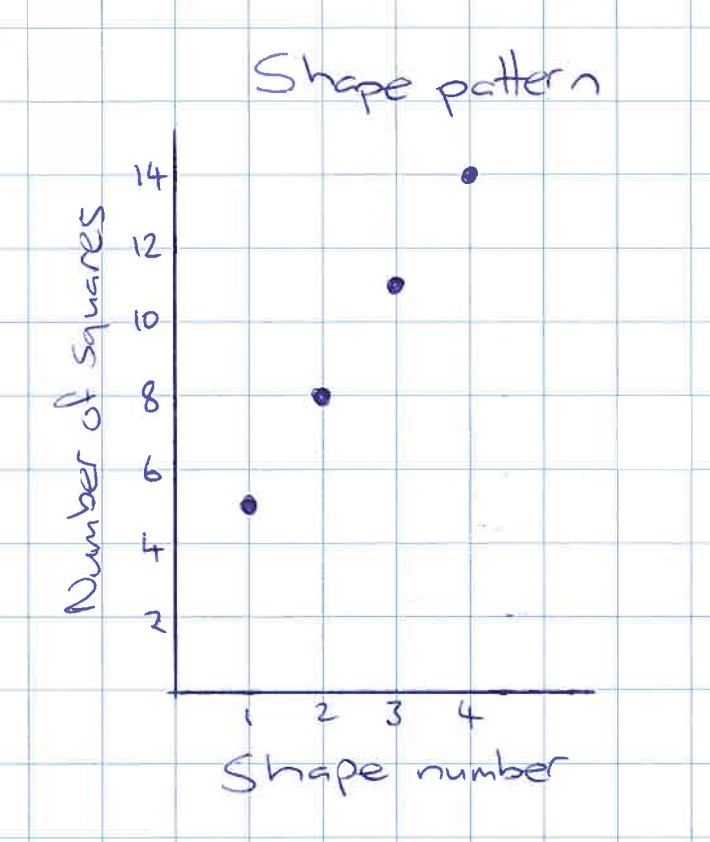
- Discuss the graphs students have created. For example:
Point to the dot at (3,11).
What does this dot tell you about the pattern of squares?
Students need to recognise that (3,11) represents the fact that Shape Three has 11 squares. Point to the other points.
Is there a pattern in our graph?
Students might notice that the points are along a line, meaning it shows a linear relationship (pānga rārangi).
Why do you think the points lay on a line?
Highlight that an increase of one in the shape number is associated with a vertical increase of three in the number of squares. This can be done by referring to the scales on the graph, and the location of the points in relation to these scales, or by displaying the x and y values in a table.
- Support students to create the same graph digitally (e.g. using Microsoft Excel). This might be done in pairs or through a guided, teacher-led approach.
Extending the graph can be done using a line, since the relationship between all points is linear. This allows the graph to be used as a predictive tool for further shapes in the pattern. In the graph below the point (10,32) lies on the line. That means that Shape 10 is made of 32 squares.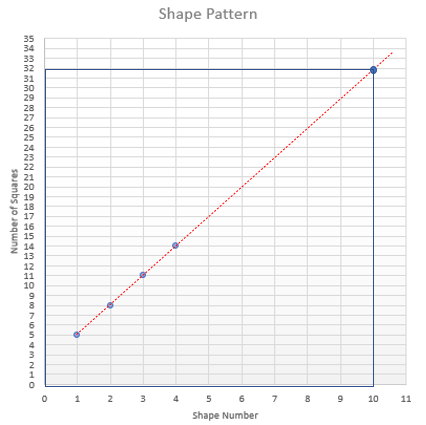
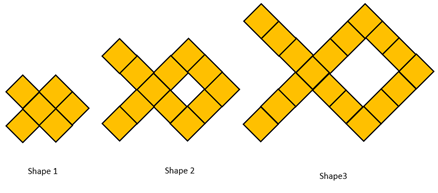
Show students the pattern on slide 2 of the PowerPoint (the pattern of the growing person).
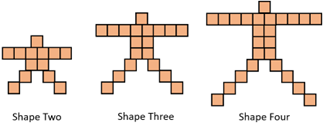
- Together, discuss the pattern and create a table of values to describe the pattern.
What is the general rule for this pattern?
For this pattern, the number of squares is always six times the Shape Number plus one. The nth term can be written as 6n + 1.
| Shape number | 1 | 2 | 3 | 4 | 5 | 6 | 7 | 8 | 9 | 10 | |
| Number of squares | 7 | 13 | 19 | 25 | 31 | 37 | 43 | 49 | 55 | 61 | |
| +6 | +6 | +6 | +6 | +6 | +6 | +6 | +6 | +6 |
- Support students to represent the first three shapes of the growing man pattern on a number plane, preferably using spreadsheet software (e.g. Microsoft Excel).
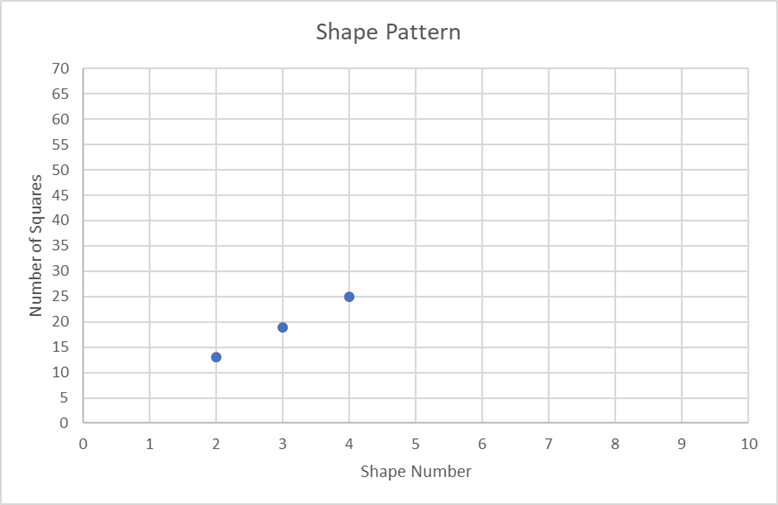
- Discuss the graphs created by students. For example:
Point to the dot at (3,19).
What does this dot tell you about the pattern of squares?
Students might recognise that (3,19) represents Shape Three consisting of 19 squares.
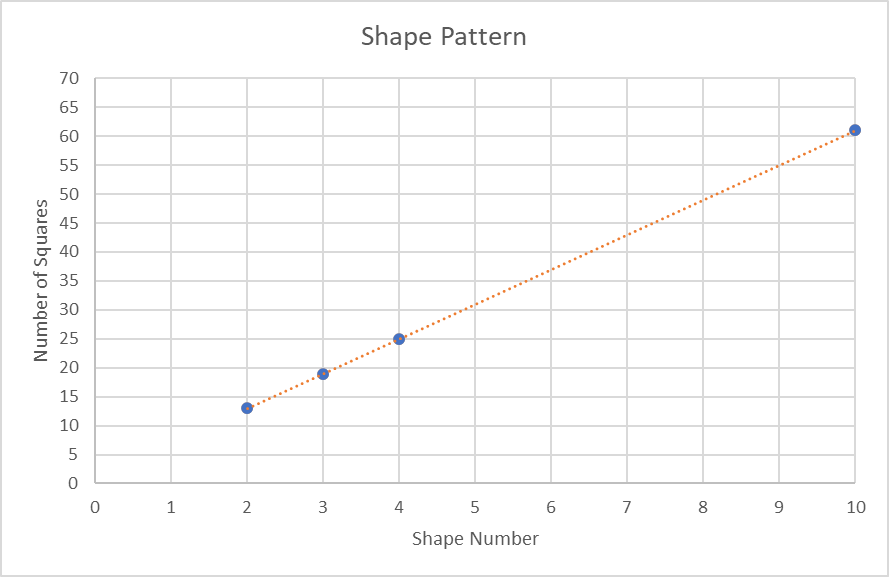
Is there a pattern in the graph?
Students might notice that the points are along a line, so the relationship is linear.
- Extend the graph using a line. Note that this method can be error prone since it is hard to project the line perfectly and read off the number of squares (vertical axis). In the graph below the point (10, 61) lies on the line which means Shape 10 is made with 61 squares.
- Provide the students with another example of a patterned that can be graphed as a linear relation. For example, you might use the fish pattern on slide 3.
The nth term is 6n which means the number of squares is always the Shape Number multiplied by six.
The graph shows a linear relationship because there is a constant difference of six for each increase of one in the Shape Number.
- Ask students to reflect on the connection between general rules and their graphs. Use slide 4 to compare graphs for the three general rules.
What do you notice about all three graphs? (Students should see that all three graphs are linear)
Are there differences between the graphs? Why do these differences occur?
Look for students to notice that the slope of the line for 3n + 2 is less than for 6n + 1 and 6n. The later two relations have graphs with the same slope.
What is the difference between the graph of 6n + 1 and the graph of 6n?
Look for students to notice that the + 1 part of the first general rule shifts the point up one space on the number plane.
Next steps
- Provide students with opportunities to use digital platforms, such as Desmos, to explore connections between linear equations and their graphs.
- First, explain that a general rule for the nth term such as 4n + 3 can be graphed as the equation y=4x+3, honouring the convention of the x-axis representing the explanatory variable (Shape Number) and the y-axis representing the response variable (Number of squares).
- Give students three equations to graph with minimal variation of either the constant or the multiplier (co-efficient) of x. For example, graph the relations y=2x, y=5x, and y=-3x.
What is the effect on the graph, of changing the multiplier (co-efficient) of x?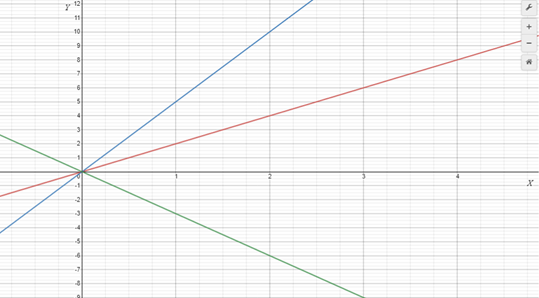
- Extend the range of relations to include patterns that do not involve linear relations. Pay particular attention to square numbers and to powers of two.
For example, here is the pattern of square numbers: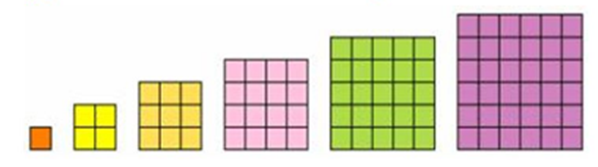
- Make a table of values. Notice that the differences are odd numbers.
| n | 1 | 2 | 3 | 4 | 5 | 6 | 7 | 8 | 9 | |
| n2 | 1 | 4 | 9 | 16 | 25 | 36 | 49 | 64 | 81 | |
| +3 | +5 | +7 | +9 | +11 | +13 | +15 | +17 |
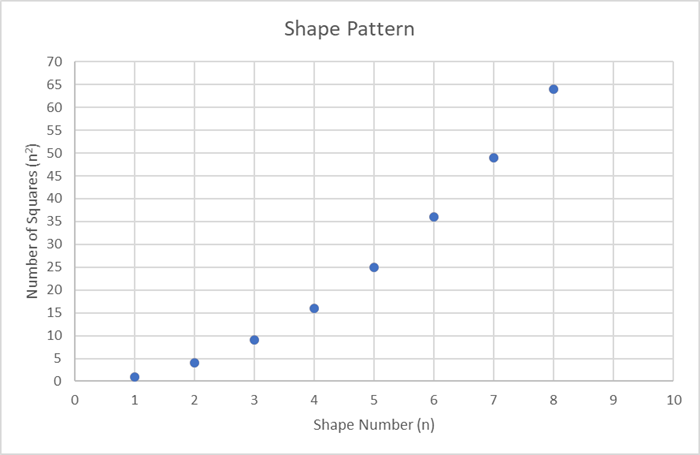
- Graph the relation between n and n2.
Attachments
graphing-relations.pptx92.2 KB
Add to plan
Level Four