Purpose
The purpose of this activity is to support students anticipating the next shape in a growth pattern by attending to the structure of shapes in the pattern. There is a particular emphasis on similarity and difference between consecutive shapes in the pattern.
Achievement Objectives
NA3-8: Connect members of sequential patterns with their ordinal position and use tables, graphs, and diagrams to find relationships between successive elements of number and spatial patterns.
Required Resource Materials
- Square tiles or squared paper
- PowerPoint (In paper form or displayed on a large screen)
Activity
- Show students slide 1 of the PowerPoint.

What is happening in this picture?
Discuss how time lapse was used to create pictures of a bean plant growing. You might show students a time lapse video of a plant growing
In this lesson we are going to look at growing patterns. Your challenge is to draw the shape that comes next. Draw the next bean plant in this pattern.
Let students draw what they anticipate the plant will look like in the next photograph. You might discuss features like height, the shape and number of leaves, etc.
- Show students slide 2 of the PowerPoint. Animate the slide if you are showing it on a shared screen.
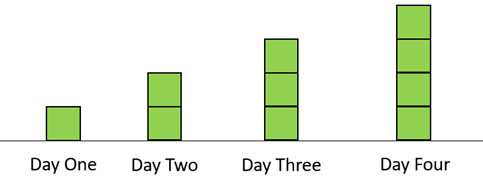
What does this pattern tell us about how the plant grew?
Draw students’ attention to features that change and features that change.
What changes as the plant gets one day older?
What stays the same?
Look for students to notice that whilst the width of the plant stays the same, the height changes by one square for every day of growth.
Draw the next picture in the pattern. What does the plant look like on Day Five?
What will the plant look like on Day Nine?
Look for students to continue drawing the pattern or recognise that the plant must be 11 squares tall. Create a table of Values for the pattern on Slide Two. You might replay the animation and add values as the days progress.
What do you notice?
Look for students to recognise that the day number and number of squares are always the same value.Days 1 2 3 4 5 Number of squares 1 2 3 4 - Work through slides 3 to 5 in the same way, asking the key questions like:
What changes as the plant gets one day older?
What stays the same?
Draw the next picture in the pattern. What does the plant look like on Day Five?
- Develop a table of values for each pattern. Look to see if students recognise change in the number of squares, and any relationship between the day numbers and the number of squares. Answers are given on slides 6 and 7.
Next steps
- Ask students to create their own growth patterns using the same story shell of a plant changing over days. Allow students to work in groupings that will encourage peer scaffolding and extension. Some students might benefit from working independently, whilst others might need further support from the teacher. Consider also the different means of action and expression (e.g. squared paper, digital tools) that your students might use to create their patterns.
- Give students examples in which a shape in the pattern is missing. Ask them to draw the missing shape. For example, draw the shape for Day Three.

Attachments
next-shape.pptx752.34 KB
Add to plan
Level Three