The purpose of this activity is for students to find the value of a specific unknown given two relationships among three variables. The relationships are expressed diagrammatically.
This activity assumes the students have experience in the following areas:
- Finding differences by subtraction or adding on.
- Measuring lengths using metric units, including centimetres.
- Representing a relationship between two variables, using a table of values.
- Write algebraic expressions and equations with letters to represent variables.
The problem is sufficiently open ended to allow the students freedom of choice in their approach. It may be scaffolded with guidance that leads to a solution, and/or the students might be given the opportunity to solve the problem independently.
The example responses at the end of the resource give an indication of the kind of response to expect from students who approach the problem in particular ways.
Find the height of the table below, showing your working clearly. There are many ways to solve the problem so share your solution with your classmates. 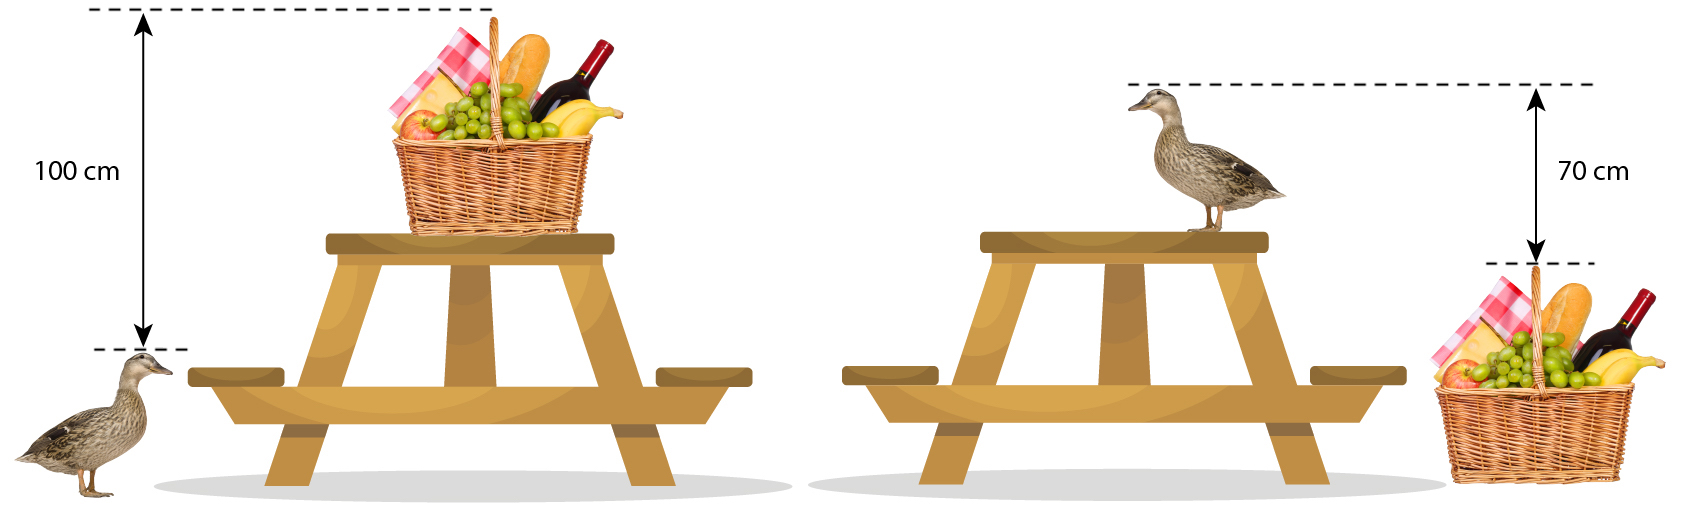
The following prompts illustrate how this activity can be structured around the phases of the Mathematics Investigation Cycle.
Make sense
Introduce the problem. Allow students time to read it and discuss in pairs or small groups.
- Do I understand the situation and the words? (Students may need support to understand the meaning of arrows and that the two pictures are of the same table, duck, and basket, not two separate tables.)
- What information is given? Do I have all the information I need? (In what other problems have I tried to find unknown values?)
- What will my solution look like? (The solution will be the height of the table with clear explanation of how the height was found.)
Plan approach
Discuss ideas about how to solve the problem. Emphasise that, in the planning phase, you want students to say how they would solve the problem, not to actually solve it.
- What could the solution be? What is a sensible estimate for the height of a barbecue table?
- What conditions do I have to meet to solve the problem? (Note that this problem involves simultaneously meeting two sets of conditions.)
- Can I draw or sketch the situation? Could I write equations?
- What other tools and strategies do I have that may be useful?
- Should I make a list/table?
- Could algebra be used to solve the problem? How?
- What tools do I have to solve the problem? (A spreadsheet is potentially useful to organise information and ease calculation load.)
Take action
Allow students time to work through their strategy and find a solution to the problem.
- Have I shown my workings in a systematic way?
- Which strategies are proving to be productive?
- Will trial and improvement get me there? What values for the table height should I try first?
- Have I recorded my ideas in a table that helps me to see patterns? Does my table include the problem conditions that are given in the pictures?
- Are there any patterns?
- How might I describe the pattern?
- Does the pattern help me to answer the question?
- Have I tried using letters to represent the heights of the table, duck, and basket?
- Do my algebraic equations correctly represent the conditions given in the pictures?
- How might I eliminate the heights of the duck and basket, so I am only left with the height of the table?
Convince yourself and others
Allow students time to check their answers and then either have them pair share with other groups or ask for volunteers to share their solution with the class.
- What is the solution?
- Is my working clear for someone else to follow?
- Am I sure the solution is correct? How have I checked it against the conditions in the pictures?
- How would I convince someone else I am correct?
- Could I have solved the problem in a more efficient way?
- Was trial an improvement effective? Was using a table of values more efficient? What about algebra?
- What connections can I see to other situations? Why would this be? (Possibility and constraint problems are common in the real world.)
- Which ideas or tools worked well in my investigation?
- What maths do I need to learn to solve problems like this?
Examples of work
Work sample 1
The student uses estimation and trial and error approaches to find the height of the table.
Students who operate procedurally will assign approximate values to the heights of the table, basket, and duck. Often the approximate values will be based on the relative size of the objects in the diagrams. Students will adjust the values until a viable solution is found. They may only consider one of the relationships and may need reminding that both relationships must be satisfied. Note below that the student only satisfies relationship one (the left diagram). 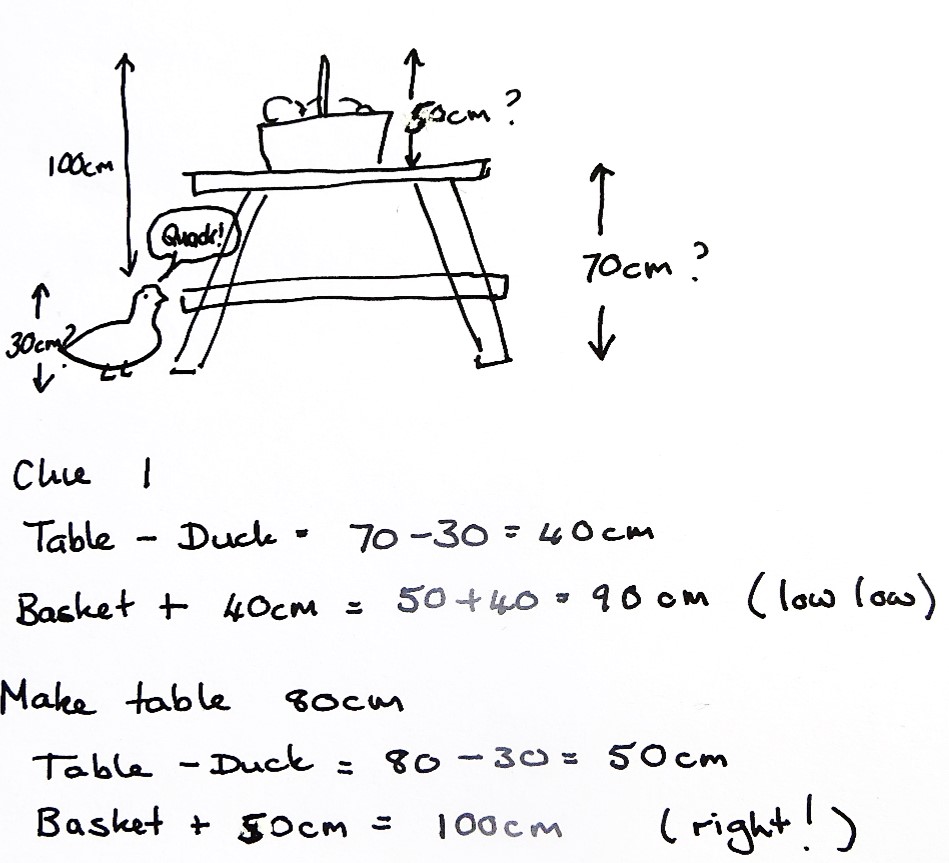
An improvement strategy is to organise the trials in a table of values. That requires recognition that the first relationship can be expressed as “table plus basket minus duck equals 100 centimetres” (t + b - d = 100) and the second relationship can be expressed as “table plus duck minus basket equals 70 centimetres” (t + d - b = 70). Note that the values table, basket, and duck represent the heights of those objects, not the objects themselves.
Representing each clue as a calculation is an important example of algebraic thinking. 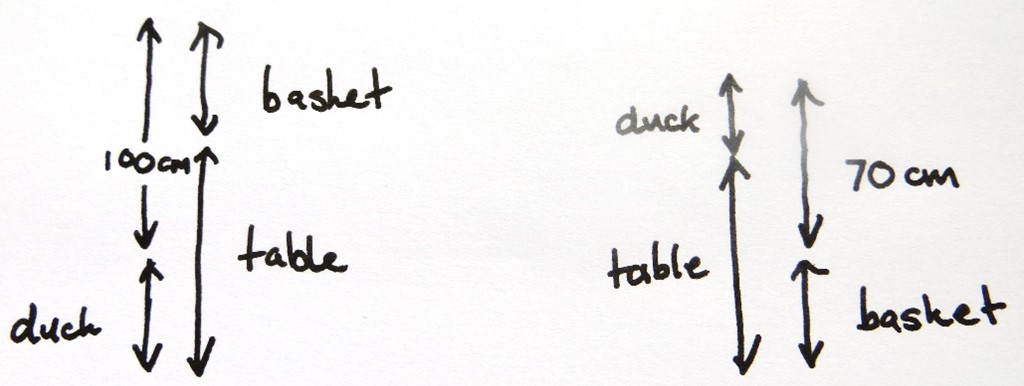
Capturing the information in a table allows for assigning possible values and making progressive improvements. Those improvements should be systematic rather than random. Fixing the value of two variables and manipulating only one variable is a sound first step. 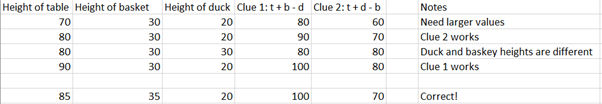
Work sample 2
The student uses an algebraic strategy to find the height of the table.
Students who work conceptually will find ways to express the relationships using algebraic notation. 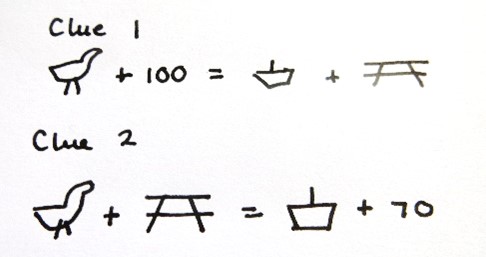
That requires skills that are explicitly taught at Level 5 of NZC, but students may develop their own pseudo-algebraic representations, such as icons for the heights of the objects. Note that the arrows diagram above leads to algebraic notation: An advanced student may recognise that there are two equations to solve simultaneously.
d+100 = b+t
d+t = b+70
Subtracting the bottom equation from the top equation gives:
100-t=t-70
Adding t to both sides gives:
100-t+t=t-70+t
100=2t-70
Adding 70 to both sides gives:
100+70=2t-70+70
170=2t
Since 170 ÷ 2 = 85 the height of the table equals 85 cm.
Some students may rearrange the equations so the numeric value is on one side then use elimination to solve the problem.