Getting Started
In this lesson students connect circular region models of fractions with finding fractions of a set. By the end of the lesson students should be able to unitise a given set into different parts, and name the part-whole relationships in terms of those parts.
Begin with PowerPoint 1 that presents the scenario of distributing toppings, like pieces of salami, evenly around a pizza. Students are often familiar with a circular region model so the connection to a discrete model is useful.
For each scenario (topping) ask questions like:
- How many (toppings) do you think will go in each piece (unit fraction)?
- How did you work that out?
- How might the equal sharing be written as an equation?
Note that the problems are about finding a unit fraction of a set, so the fraction behaves as a multiplier. Therefore, the equation might be written as multiplication or division, e.g. 1/4×36=9 or 36÷4=9. Students who use additive build up to anticipate the result should be encouraged to use multiplicative thinking with questions like:
- I see you gave four (toppings) to each person, and went 4 + 4 = 8, 8 + 8 =16, to work out how many were used up. What multiplication fact could you use instead?
- Could you give each piece ten (toppings)? Why or why not?
- If ten is too much/little then how could you fix that up?
The final question is about finding a multiplication or division fact that approximates the solution, from which the student can derive the solution. For example, 40 ÷ 5 = 8 can be derived from 10 ÷ 5 = 2 (See Slide Four).
After working through PowerPoint 1, ask students to work on Copymaster 1 in pairs. The problems all involve finding a unit fraction of a set, in the same pizza scenario. You might make materials, like counters, available to some students but encourage them to anticipate the result of the equal sharing first. Look for your students to:
- Apply multiplicative strategies rather than counting or additive build up;
- Record symbols or diagrams to support their thinking;
- Record the situation correctly as a multiplication equation;
- See connection among the problems, that is, use one result to get another.
After completing Copymaster One, students play The Pizza Game. Cards for the game are made from Copymaster 2. Print two sets of the Copymaster to make a total of 32 cards. The game is played with two or three players. Each team of players needs two dice made from blank wooden cubes, or by using stickers over normal dice. The dice are labelled:
Easy Game: 14, 15, 16, 18, 20, 24, and 25, 27, 30, 32, 36, 40.
Hard Game: 35, 36, 40, 42, 45, 48, and 50, 54, 56, 64, 72, 81.
Spread all the cards in the middle, face up so all players can see them.
How to play
Players take turns to:
- Roll the two dice. Choose one of the dice numbers.
- Choose a pizza card so that the number of toppings on the dice can be shared equally onto the pizza with no remainder. The player must explain how they know each piece will have the same number of toppings.
- If the player is correct, they keep that pizza card and it cannot be used again.
- If they are challenged by the other players, and are incorrect, the pizza card stays in the middle.
The winner is the person with the most pizza cards when play finishes, or when all pizza cards are gone.
Exploring
In the following two sessions students extend their knowledge of fractions as multipliers (operators) to non-unit fractions, that is fractions with whole numbers greater than one as the numerator, e.g. 2/3 and 4/5. Then students explore the part-whole relationships in ratios, using fractions to represent relationships.
Session Two
Begin with PowerPoint 2 that shows how to find a non-unit fraction of a set. Progress to Slide 6. Students will notice that the first four slides are the same as PowerPoint 1.
- What is the same about the problems so far?
- How do we solve problems like this?
Students should suggest that the number of toppings is divided by the number of pieces. Why? (To establish the unit fraction). Then the unit fraction is multiplied by the number of pieces that are eaten.
Take at least two of the examples from PowerPoint 2 and write equations for the situations.
- 2/3×30=20 (Two thirds of 30)
- 3/4×32=24 (Three quarters of 32)
- 4/5×35=28 (Four fifths of 35)
Discuss the meaning of the x symbol as ‘of’ and how the numerator and denominator of the operating fraction impact on the calculation, e.g. 4/5 is found by dividing by five then multiplying by four.
Put the students into groups of four and provide the puzzles made from Copymaster 3. There are five puzzles. Each student gets one card for each puzzle. They must work with their team-mates to find a solution that matches all the clues. Each player must ‘own’ their clue, that is, ensure that they retain it and that the solution matches their clue. Encourage the students to record their strategies in some way on paper.
Look for your students to:
- Identify the information that is missing. The information might be numerator or denominator of the operating fraction, the whole number of toppings, or the part of the whole consumed.
- Record the problem symbolically or diagrammatically in ways that are helpful. For example, expressing Puzzle C as 2/3×?=32.
- Use multiplicative strategies to solve the puzzles, rather than resort to drawing and "share by ones" or composite groups (skip counting) strategies. Note that access to a basic facts chart may help some students to think multiplicatively.
After an appropriate time bring the class back together. Focus on one or two puzzles that brought out interesting strategies. Choose groups to share their solutions. An important idea is that either order of multiplying by the numerator and dividing by the denominator works. Usually dividing first is more efficient.
Session Three
Begin with the game “3 in a line.” Gameboards can be printed and laminated using Copymaster 4. The game requires students to practise finding non-unit fractions of whole numbers. An important feature of the game is that equivalent fractions operating on the same whole numbers produce the same product, e.g. 3/4×24=18 and 6/8×24=18.
3 in a line
You need:
- Gameboard for each pair (Version D is harder than the others)
- Two colours of counters and two paperclips
To play:
Players take it in turns to choose a paper clip on their choice of fraction and on their choice of whole number. They find that fraction of the number and, if it is not yet taken, place a counter of their colour on it. The winner is the first player to have three counters of their colour in a row.
Do your students?
- Fluently find non-unit fractions of whole numbers using multiplication and division
- Make strategic choices about which fractions and whole numbers to choose
- Recognise that equivalent fractions operating on the same whole number give the same product
Next return to the pizza context to introduce the concept of part whole fractions within ratios. Use PowerPoint 3 to introduce the concept and provide important questions. Emphasise these key points:
- Fractions can be used to represent the relationships of parts to the whole
- By re-unitising single objects into sets, different fraction names for the same part-whole relationships can be found
- Ratios can be used to represent the relationships among parts that make a whole set.
Let students work on Copymaster 5 individually or in small groups. You might use counters or cubes of various colours to represent the toppings. Manipulation of the ‘toppings’ in physical form can help students as long as they are invited to anticipate the results of division before acting. Look for your students to identify the whole, use fractions to represent the part-whole relationship for each topping, and simply the fraction, if possible, using common factors. The second page of problems requires students to organise a complex set of clues to establish a mix of toppings. Trial and error approaches may be common but encourage your students to organise the clues by usefulness. Physical objects can be useful to try swap ‘toppings’ as clues are considered.
Reflecting
The final session of the unit develops the use of fractions to describe the relationship between different wholes and between parts in the same whole.
Begin with the starting problem on PowerPoint 4. This task is very rich as it involves ideas about area and comparative price, as well as the comparison of toppings.
If you like pepperoni pizza, which are you better to buy, two small pizzas or one large pizza?
Let your students investigate the problem in small groups. Encourage them to develop an argument about which option is best, and their reason for choosing it. After a suitable time gather the class to discuss their answers. Groups should balance at least two characteristics, from area, price, number of pieces of salami, convenience, amount of crust, etc.
Each option is okay because the large pizza is twice the price but is twice as big the little pizza (attending to area though the large pizza is actually 2(1 )/4 times as big).
A response like that contradicts:
The small pizza is better because the larger pizza is only one and one half times as big (attending to diameter) but twice the price as the small pizza.
Note that capable students might calculate the areas (Small: π×132= 530.93cm2; Large: π× 19.52= 1194.59cm2) and provoke a discussion about comparative areas.
Encourage different kinds of comparison, such as:
If you just looked at the number of slices of salami, which option should you go for?
The small pizza has eight pieces of salami while the large pizza has 14 pieces. Buying two small pizzas gives two more pieces of salami for the same price.
Slides 2-9 focus on using fractions to describe the relationships between different numbers of salami pieces (different wholes). The large pizza has 14/8=7/4=1 3/4 as many pieces of salami as the small pizza. Conversely, the small pizza has 8/14=4/7 times as many pieces of salami as the large pizza.
Lining up the collections of pizza pieces makes the comparison easier, but student still need to do the following:
- Establish which collection is the unit to ‘measure’ with
- Compare the other collection to the measurement unit
- Unitise the two collections into common parts
- Express the whole to whole comparison as a fraction operator
Using Copymaster 6 students create a puzzle that involves fractional multipliers. The four pizza cards are put at the corners of a square. Then students place the arrow cards between the pizza cards to represent the correct relationships between the numbers of pieces of salami. For example, the multiplier card ×4/3 goes between the six-piece pizza and the eight-piece pizza, since 6×4/3=8. Let the students solve their puzzle in pairs or threes of mixed ability. Challenge students to consider how the multipliers might be expressed as mixed numbers as well, e.g. ×4/3 can also be expressed as ×1 1/3. Note that most of the operators require simplification using common factors, e.g. ×8/6 is simplified to ×4/3.
As a final challenge students, can use the blank sheets 3 and 4 of Copymaster 6 to create their own puzzle for others to solve.
Areas and volumes
This unit is about finding the areas of triangles, and parallelograms, using what students already know about the areas of rectangle. Students will apply multiplication and division strategies as they calculate areas. The ideas are extended to finding the volumes of cuboids (rectangular prisms).
Area is a two-dimensional concept, that is it relates to flat space. Area is the internal space enclosed by some boundary. With polygons, like rectangles and triangles, the boundaries are lines or line segments. Area is defined in the maths curriculum as the size of a surface expressed in square units. Investigations of the size of an area should begin with comparisons between different surfaces and progress to calculating with standard, units, such as square centimetres (cm2), square metres (m2), and square kilometres (km2). The use of formulae to calculate the areas of common polygons is an advanced stage of the learning sequence.
Units of area are squares because squares fit together with no gaps or overlaps, and tile infinitely in both dimensions. At the early stages it is important for students to realise that a simple shape, like a rectangle, can be filled with squares arranged in rows and columns to create arrays. Multiplication is an efficient way to count the number of square units. The idea of tiling must become more imaginary (abstract) as students deal with two things:
Volume is the three-dimensional equivalent of area. Volume is the amount of space occupied by an enclosed solid. The boundaries might be flat planes, or curved surfaces. The simplest enclosed solid to find the volume of is a cuboid (rectangular prism). Cube shaped units are used for volume for the same reason that squares are used for area. Common units of volume are cubic centimetres (cm3), cubic metres (m3), and cubic kilometres (km3). Cubes fit together with no gaps or overlaps in three dimensions (length x width x depth). Since the units are arranged in three-dimensional arrays, multiplication can be used to count the number of units in a cuboid shaped space. If the cuboid measures 6cm x 4cm x 5cm then 6 x 4 x 5 = 120 cm3 gives the volume.
The learning opportunities in this unit can be differentiated by providing or removing support to students and by varying the task requirements. Ways to support students include:
Tasks can be varied in many ways including:
The context for this unit can be adapted to suit the interests and cultural backgrounds of your students. Area is useful to many everyday pursuits, such as painting a bedroom, creating a vegetable patch to grow kai, tiling a kitchen or bathroom, interpreting house plans, and working out the size of a playground, marae or field. Volume of cuboids applies to contexts like comparing the size of schoolbags, chilly bins, car boot spaces, or refrigerators, digging an appropriate sized hole for a hāngī, choosing the correct air conditioning unit for a room, looking at packaging (watch for wasted space), and estimating the amount of firewood that has been delivered.
Te reo Māori vocabulary terms such as mehua (measure), horahanga (area), and kahaoro (volume) could be introduced in this unit and used throughout other mathematical learning.
Session 1
In this session students revise the rule for the area of a rectangle. This session may not be required if this unit is being taught following a unit on area of rectangles.
Apart from chocolate blocks, when do we use area in real life?
Draw four different rectangles that each have an area of 36 square centimetres.
Measure the perimeters of the rectangles.
Are the perimeters equal? Explain.
Students should create 2 x 18, 3 x 12, 4 x 9, and 6 x 6 rectangles though they may not consider a square as a type of rectangle (It is!) Adventurous students might consider fractional side lengths such as 4 1/2 x 8, 5 x 7 1/5. Students should note that the perimeters vary with the square having the shortest perimeter.
Find the area of each triangle. What do you notice?
Students should notice that the areas are all the same, 18 square centimetres.
How does the area of the triangle compare to the area of the rectangle?
Will that still be true if I cut up the rectangle like this?
Students should note that the triangle has half the area of the rectangle. The rectangles and triangles can be cut up to confirm the relationship. Show students that the formula for area of a triangle can be written as area=1/2 × base × height or a=1/2(b×h).
Session 2
In this session students investigate the relationship between areas of rectangles and related parallelograms. They recognise that a parallelogram can be partitioned into two similar right-angled triangles plus a rectangle. This composition is used to develop a formula for the area of a parallelogram.
Imagine each small square is 1cm2.
What is the quadrilateral called? (parallelogram) Why is that a sensible name? (Two pairs of parallel sides)
Find a way to work out the area of the quadrilateral.
What is the area of this parallelogram? (12 1/2 x 10 = 125)
Use your quad exercise book (or Copymaster 1). Draw six parallelograms that each have an area of 48cm2.
Do they begin with a rectangle they know has an area of 48cm2?
This is [Insert name]’s answer.
Do all the parallelograms look like they have the same area?
Are his/her parallelograms correct? Do they all have areas of 48cm2?
How do you know?
How could we write the rule for finding the area of a parallelogram? (length x height = area)
For example, the parallelogram is one eighth of the initial square. 1/8×576=72cm2.
Session 3
In this session students connect the l x w formula for rectangles to finding the volume of cuboids (rectangular prisms).
Where in the world would you find cuboids?
Students should provide examples such as packets, boxes, buildings, shipping containers, etc.
What shapes make up the surface of a cuboid? (rectangles which is the reason a cuboid is also called a rectangular prism)
What shapes do we get if we cut a cuboid with a straight cut?
Students will probably think firstly of rectangles, including squares, but other cross sections are possible with non-parallel cuts.
Who might be interested in the amount of stuff this cuboid holds?
How do we measure the space inside a container?
Students will have ideas of possible measures, such as cubic centimetres. Introduce a small place value block cube which is 1cm3 in volume. Point out the 3 dimensions of 1cm.
What information would you like to know?
Students might suggest measuring the edges of the cuboid.
How do those measurements help?
How many cubes make one layer?
Students should connect this question to area using l x w.
How many layers can I make? (You may need to physically step out the layers)
How do I work out the total number of cubes?
Try to arrive at a length x width x depth rule.
Is it easy to compare the volumes of cuboids just by looking at them?
You might find two or three boxes with similar volumes but quite different appearance.
How did the designer of the box know how big to make it?
Students might suggest that the designer knew what the box had to hold. For example, they might know that a 750g box holds 48 weetbix.
What would they do then to design the box?
Students might suggest that the designer arranges the weetbix in rows and works out the edges of the box from there.
How might we deal with empty spaces?
Can we still use length multiplied by width multiplied by depth?
Students might realise that fractions are needed, and those fractions are usually represented as decimals in measurement.
Make three different cuboid shaped boxes that will each hold 36 cubes with no gaps or overlaps.
Give students ample time to build boxes before convening the class.
Share the boxes that student pairs create. Find a way to record the dimensions, such as:
Is each box unique, that is different from the others? (Students might note that the same dimensions occur but agree that the location of the top makes the box unique)
How will we know when we have found all the boxes? (Encourage a systematic approach based on finding all the triads of factors for 36: 1 x 1 x 36, 1 x 2 x 18, 1 x 3 x 12, 1 x 4 x 9, 1 x 6 x 6, 2 x 2 x 9, 2 x 3 x 6, 3 x 3 x 4)
Session 4
In this session students draw on their knowledge of area and volume to solve problems. There is emphasis on surface area of 3 dimensional solids with links to difference between area and perimeter.
Simone is estimating the area of Lake Taupō. She has two ways, using a triangle and using a rectangle. (Show Slides One and Two).
What units of measurement is she using? (kilometres so the area will be in square kilometres, km2)
Which way do you think is the most accurate? Why?
Students should discuss the pieces of area that are missing from and outside each shape.
Do the outside parts make up for the missing parts?
Triangle: 12×42×30=630km2
Rectangle: 26×25=650km2
Check the estimates against the actual area of 616km2.
You could challenge students to estimate the areas of other lakes or cities in your local area, or around Aotearoa.
Surface area is the combined area of all the faces of this box.
How would I figure that area out?
Students might realise that each rectangular area can be worked out separately then the areas can be added.
Do any of the faces have the same area? (There are matching parallel faces)
If a cuboid has a larger surface area than another cuboid, then the first cuboid has the largest volume. True or false?
Do students realise that a long skinny cuboid may have a large surface area but have little volume?
Do students connect this idea to perimeter and area of rectangle? (A large perimeter does not mean large area)
What is the surface area of this cuboid?
Each edge is involved in four rectangles, combining twice with each other edge. With this cuboid the rectangles are:
10 x 6 (Twice) 10 x 4 (Twice) 6 x 4 (Twice)
(10 x 6) + (10 x 6) + (10 x 4) + (10 x 4) + (6 x 4) + (6 x 4) = 248cm2.
What shape will this net make if you fold it up?
Let students visualise the complete solid. The name for the solid is an oblique prism. You will find images for it online using the search “building oblique prism”.
Discuss: What would be the advantages/disadvantages of a building that is shaped like an oblique prism?
Challenge: Make the solid by cutting, folding, and taping.
The building has glass walls. Calculate the surface area of the glass in square centimetres. (You can pretend the squares are square metres if you want).
Use the task for assessment: Can your students calculate the areas of rectangles and parallelograms?
Session 5
In this session students are given a range of problems related to areas of triangles, rectangles and parallelograms, and to the volume of solids (see Copymaster 3). Let students work on the problems individually before sharing their work with a partner. Ensure students check their solutions against those provided below.
Triangle (1/2 x 8 x 4 = 16 cm2)
Parallelogram (4 x 8 = 32cm2)
Note that orientation of the shapes may affect students’ ability to identify the base and height.
Suppose you chose 4 x 4 = 16 cm2 for the square, then the rectangle might be 1 x 16, 2 x 8, or 4 x 4 (since a square is also a rectangle). The parallelogram is just a ‘pushed’ version of one of those rectangles. It must have the same base and height as one of the rectangles. The triangle can also be made from a rectangle. Keep the base the same but double the height or double the base and keep the height the same.
The right box is three quarters the volume of the middle box since 18 is three quarters of 24. The right box holds three quarters as much powder as the middle box since 600 is three quarters of 800. The middle and right boxes have the same ratio of air space to powder space. However, since the middle box has more volume it has the most air space.
Family and whānau,
In maths this week we are learning about the area of triangles, rectangles, and parallelograms. Discuss when you might use these in your daily life. You might talk about making a garden , tiling a wall, or covering a floor.
Ask your student to explain to you the rules for working out the area of each shape. See if they can explain why the rule works using diagrams to show you what they have learned. Ask them to find the areas of rooms in your homes, the deck or the garage.
We also explored how to find the volume of a cuboid (rectangular prism like a cereal box). Ask your student to explain how they work out the volume of a cuboid, and what ‘volume’ means. Discuss when volume is used in daily life, such as how much concrete is needed to fill a row of holes when building a fence.
Equivalent Fractions
In this unit we are exploring ways to find equivalent fractions. We use the concept of equivalent fractions to convert fractions to the benchmark fractions of halves, quarters, thirds, fifths and tenths. From these benchmark fractions it is easier to convert fractions to decimals and percentages. We use equivalent fractions to compare fractions.
Fractions are an extension of whole numbers and integers. Fractions are needed when wholes (ones) are not adequate for a task. Division often requires equal partitioning of ones. Sharing two chocolate bars equally among five people requires that the bars be cut into smaller equal parts. The operation might be recorded as 2 ÷ 5 = 2/5. Note that the number two fifths, is composed of two units of one fifth. In practical terms the equal share can occur by dividing each of the two bars into fifths, then giving each person one fifth from each bar.
If the bar was made up of ten pieces then each person might be given two tenths from each bar, giving them four tenths in total. Four tenths are the same quantity of chocolate as two fifths. Any fraction can be expressed as an infinite number of equivalent fractions that represent the same quantity and occupy the same position on the number line.
Fractions are important to measurement, especially where whole units are not precise enough for the purpose. The symbolic expression does not explain why equivalent fractions represent the same amount. Consider these equivalent fractions: 2/3 = 4/6 = 8/12 . A fraction strip (length) model of the relationships looks like this:
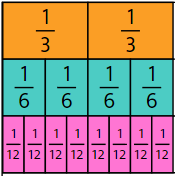
Sixths are half the size of thirds so twice as many sixths fit into the same length as thirds.
Twelfths are quarter the size of thirds so four times as many twelfths fit into the same length as thirds.
The relationship between two thirds and eight twelfths can be represented in this equality.
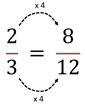
Four times as many twelfths comprise one as thirds. Therefore, each third can be divided into four twelfths.
Understanding equivalent fractions is critical to making sense of decimals and percentages. Consider the names for 3/4 = 0.75 = 75%. Both 0.75 and 75% represent 75/100 which is an equivalent fraction to 3/4. If each quarter is equally partitioned into 25 parts, those parts are called hundredths since 4 x 25 of those parts fit into one.
The learning opportunities in this unit can be differentiated by providing or removing support to students and by varying the task requirements. Ways to support students include:
Adaptation involves changing the contexts used for problems to meet the interests and cultural backgrounds of your students. Where contexts such as food and ratios of orcas and dolphins may not be appropriate for your students, find other situations likely to engage them. Birthday cakes might be replaced by areas of land, dart boards, or gold coins. Orcas and dolphins might be replaced by other animals that need conservation. Linear models are easily applied to journeys that students make, or physical objects such as tape and rope.
Te reo Māori vocabulary terms such as hautau (fraction), hautau ōrite (equivalent fraction), rārangi tau (number line), and haurua, hautoru, hauwhā, haurima… (half, third, quarter, fifth…) could be introduced in this unit and used throughout other mathematical learning.
Session One
How do we read these fractions? (two thirds and three quarters)
What picture do you see when you think …about two-thirds? ...about three quarters?
Invite individual students to draw representations of the fractions.
Main points to bring out are:
Nia and Ashanti are identical twins.
Each birthday they each get identical birthday cakes.
Nia eats two thirds of her cake and Ashanti eats three quarters of her cake.
Who eats the most?
How much more cake does she eat than her sister?
What fraction of the whole cake is each piece? (twelfths – Why?)
How many twelfths are shaded?
Two thirds equals how many twelfths?
What fraction of the whole cake is each piece? (twelfths – Why?)
How many twelfths are shaded?
Three quarters equals how many twelfths?
How much greater is three quarters than two thirds? (one twelfth)
You might record 3/4 > 2/3 because 9/12 > 8/12 and ask students to explain the meaning of the symbols.
The Po and Mangu story compares 3/5 and 5/8. Students should realise that both fifths and eighths can be equi-partitioned into fortieths.
3/5 = 24/40 and 5/8 = 25/40 so 5/8 is 1/40 greater than 3/5. Some students might use division on a calculator to check the comparison. 3/5 = 0.6 and 5/8 = 0.625. This means of comparison might open up a conversation about fractions as decimals.
The Thalia and Andreas story compares 2/3 and 7/10. Both thirds and tenths can be equi-partitioned into thirtieths. 2/3 = 20/30 and 7/10 = 21/30 so 7/10 is greater by 1/20. The decimal conversions are 2/3 = 0.6666... and 7/10 = 0.7.
Session Two
When we say that two or more fractions are equivalent, what do we mean?
Do you know any pairs of equivalent fractions already?
What patterns are true for all three pairs?
Students might notice that there is always an equals sign. What does that symbol mean?
Some might notice that the numerators and denominators are multiplied by the same number, e.g. by four in the pair 2/3 = 8/12.
What does the multiplication mean? In the example, four times as many twelfths fit in one as thirds, so four times as many twelfths fit into the same space as two thirds.
Three goats share two hay bales equally. Each goat gets the same amount.
Six sheep share four hay bales equally.
How could we record the problem using a diagram? (Students often draw lines connecting animals and bales)
How could we record the problem using symbols? Sharing can be represented by division; 2 ÷ 3 = 2/3 (goats) and 4 ÷ 6 = 4/6 (sheep). Do your students recognise that two thirds of a bale is equivalent to four sixths of a bale? The shares are equal since 2/3 = 4/6.
Work through each problem with your students. Let them attempt the problem first before sharing strategies.
Students may get confused by which number is the divisor in the kiore and heihei problem. Three kiore sharing four kumara should be represented as 4 ÷ 3 = 4/3 = 1 1/3.
Nine heihei sharing 12 kumara should be represented as 12 ÷ 9 = 12/9 = 1 3/9.
Since 1/3 = 3/9 the shares are equal.
Shares for the kotare and kiwi are as follows:
4 ÷ 5 = 4/5 (kotare) and 9 ÷ 10 = 9/10 (kiwi)
A qualitative judgement is needed to establish that kiwi get more worms each.
4/5 = 8/10 so kiwis get 1/10 of a worm more than kotare.
The shares are equal.
The shares are equal.
Albatrosses get more, 1/10 of an oyster more.
Goats get more, 7/36 of a bale more.
4/5 = 16/20 = 20/25 = 24/30 etc.
5/8 = 10/16 = 15/24 etc.
Session Three
Where does the number one half live on the number line?
Be aware that some students may think you mean one half of the whole line, i.e. one half of 3 or 1 ½. This common issue is about confusing 1/2 as an operator with 1/2 as a number.
How can we locate one half exactly?
Three halves (3/2) three quarters (3/4) five quarters (5/4) ten quarters (10/4)
Five eighths (5/8) eleven eighths (11/8) two thirds (2/3) seven thirds (7/3)
You will get a set of cards (Copymaster 3: Set One).
Your job is to draw a line and organise the cards in order along the line.
Students might use a large sheet of paper and glue stick to create their number lines in pairs.
Add these extra fractions to your number line.
Look for students to:
Which fractions are the hardest to locate? Why?
Is there a way to simplify those fractions so the task is easier?
I am a fraction.
I am between two thirds and three quarters.
My denominator is 24.
Who am I?
Session Four
Use PowerPoint 3 to introduce the context of orca and dolphin numbers. Slide Three shows these data:
What do you notice about the data?
Students might comment that the numbers of creatures is much less in July compared to January. Why?
Compared to January, what fraction of the total number of creatures were in July?
12/24 = 1/2 so there are half as many creatures in July.
Are the fractions the same for both months?
8/24 (8 out of 24 for orcas) and 16/24 (16 out of 24 for dolphins) in January
3/12 (3 out of 12 for orcas) and 9/12 (9 out of12 for dolphins) in July
Can we simplify these fractions to make them easier to compare?
8/24 = 1/3 and 16/24 = 2/3
3/12 = 1/4 and 9/12 = 3/4
The fraction of orcas is slightly less in July than in January. Perhaps orcas prefer cooler water.
What fractions can you see? Explain where you see those fractions.
Draw a diagram to show how the fractions ¼ and ¾ can be seen in the orca and dolphin data.
Let students draw their own diagram before animating the slide.
Which month has the greatest fraction of orcas in the whole group?
Do students recognise that the fraction of orcas equals three fifths for both months?
Answers
Kawhia Harbour
January July
Fraction of orcas = 1/2 Fraction of orcas = 1/2
Fraction of dolphins = 1/2 Fraction of dolphins =1/2
Is there a change in the fraction for each creature comparing July to January? Same
Whitianga Coast
January July
Fraction of orcas = 10/25 = 2/5 Fraction of orcas = 4/10 = 2/5
Fraction of dolphins = 15/24 = 3/5 Fraction of dolphins = 6/10 = 3/5
Is there a change in the fraction for each creature comparing July to January? Same
Queen Charlote Sound
January July
Fraction of orcas = 6/24 = 1/4 Fraction of orcas = 4/16 = 1/4
Fraction of dolphins = 18/24 = 3/4 Fraction of dolphins = 12/16 = 3/4
Is there a change in the fraction for each creature comparing July to January? Same
Kaipara Harbour
January July
Fraction of orcas = 10/20 = 1/2 Fraction of orcas = 4/10 = 2/5
Fraction of dolphins =10/20 = 1/2 Fraction of dolphins = 6/10 = 3/5
Is there a change in the fraction for each creature comparing July to January?
The fraction of dolphins increases and the fraction of orcas decreases.
Akaroa Harbour
January July
Fraction of orcas = 4/24 = 1/6 Fraction of orcas = 2/16 = 1/8
Fraction of dolphins = 20/24 = 5/6 Fraction of dolphins = 14/16 = 7/8
Is there a change in the fraction for each creature comparing July to January?
The fraction of dolphins increases and the fraction of orcas decreases.
Hawke Bay
January July
Fraction of orcas = 12/40 = 3/10 Fraction of orcas = 9/21 = 3/7
Fraction of dolphins = 28/40 = 7/10 Fraction of dolphins = 12/21 = 4/7
Is there a change in the fraction for each creature comparing July to January?
The fraction of orcas increases and the fraction of dolphins decreases.
Session Five
Extension
Dear parents and caregivers,
This week we are learning about equivalent fractions that are different ways to represent the same amount. For example, one half (1/2) of a birthday cake is the same amount as two quarters (2/4) or four eighths (4/8). We can write the equivalence as 1/2 = 2/4 = 4/8.
Ask your student to explain how he or she compares the size of two fractions with different denominators. For example, “Which fraction is greater: 2/3 or 3/4? How much greater?”
Figure It Out
Some other links from the Figure It Out series which you may find useful are:
Travel to school
In this unit students investigate methods of travel to school, using technology to produce data displays and investigate distributions.
Arnold’s (2013) research identified six criteria for what makes a good investigative question. At curriculum level 4, students should be introduced to the criteria, potentially through “discovering” them. See for example, the following lesson on CensusAtSchool New Zealand https://new.censusatschool.org.nz/resource/posing-summary-investigative-questions/ .
The six criteria are:
Categorical variables
Categorical variables come from classifying individuals or objects into categories. For example, the method of travel to school, colour of eyes, iwi, birthplace, etc.
Numerical variables
Numerical variables include variables that are measured, e.g., the time taken to travel to school, and variables that are counted e.g. the number of traffic lights between home and school. Measured numerical variables are called continuous numerical variables. Counted numerical variables are called discrete numerical variables.
Measures
We “measure” both categorical and numerical variables. For example, if we were to ask about how students carry their school bag, we would have to decide what categories we will offer as options for carrying a school bag. Fortunately, this is one of the survey questions from CensusAtSchool so we can use their wording. Additionally, if we want to measure the distance from our house to school, we need to plan to help students work this out. For example, we might choose to map on google maps and take the distance from google maps.
Key to deciding about measures is to support getting valid and reliable measures. Valid measurements measure what they claim to measure, and reliable measurements are those that give you or someone else approximately the same result time after time when taken on the same individual or object. For example, using Google Maps to find the distance from home to school is both valid and reliable. It measures the distance from home to school (validity) and we will get the same result regardless of if the student or someone else was to get the information from google maps (reliability).
The learning opportunities in this unit can be differentiated by providing or removing support to students and by varying the task requirements. Ways to support students include:
The context for this unit can be adapted to suit the interests and experiences of your students. For example:
Te reo Māori vocabulary terms such as mehua (measure), tauanga (statistics), pātai (question), tirohanga tauanga (statistical survey), tūhura (investigate/investigation), kohikohi raraunga (data collection), raraunga (data), and taurangi (variable) could be introduced in this unit and used throughout other mathematical learning.
Session 1: Getting our travel data
PROBLEM: Generating ideas for statistical investigation and developing investigative questions
We are going to explore daily travel to school.
If the students end up rejecting their idea, they select a new one and repeat the process.
Session 2: Planning to collect travel data
PLAN: Planning to collect data to answer our investigative question
What is the main way you usually travel to school? (Choice from) walk | car | bus | train | bike | boat | scooter | other
How long does it usually take you to get to school? Answer to the nearest minute.
___________ minutes
DATA: Collecting and organising data
Session 3: Collecting and organising our travel data
In this session the students will be using an online tool for data analysis. One suggested free online tool is CODAP. Feel free to use other tools you are familiar with. This session is written with CODAP as the online tool and is assuming students are familiar with CODAP.
If your students are unfamiliar with CODAP see:
The main features that students need to be familiar with are how to draw a graph and how to import their data. More on importing data into CODAP can be found here.
The aim is to have the data in an electronic form so they can use technology to make the displays.
ANALYSIS: Using an online tool to make data displays
If they select "other", record how they travelled to school.
Session 4: Making comparisons
How do we compare with other New Zealanders our age?
In this session students will get their own sample of students their age from the CensusAtSchool database to compare with the class data from the previous sessions for these two variables.
Show students the CensusAtSchool random sampler, remembering to accept the conditions of use. Once in there, familiarise the students with the tool. There are five parts to the tool.
Ask the students which variables we should select if we want to compare with our class data about "method of travel to school" and "time taken to get to school". Select these two variables.
Note: If the students have all downloaded their own individual samples from CensusAtSchool the discussions each student makes could be quite different. If you want them all to have the same sample from CensusAtSchool you can download a sample yourself, import into CODAP and then share the CODAP document with your students (see this video on saving and sharing CODAP documents).
How do we compare with the USA?
Note: the filters might not be working on the USA database, therefore it might not be possible to get an age appropriate data set. Including all ages should be fine for the comparison ideas for the travel to school.
What do they notice is different about this data set compared with the one we did for the New Zealand data? We have all of the variables in the USA data set whereas in the New Zealand data set we just had the two variables we wanted to explore.
Which variables do we want to graph from this data set to compare with our class data and the New Zealand data? Students can convert the data from a table view to a case card view (in CODAP), this makes it easier to see the variables. Students identify that travel_to_school and travel_time_to_school are the variables we are interested in.
Session 5: Has the method of travel to school changed?
CONCLUSION: Answering the investigative question and reporting findings
Additional related exploration
Exploring across five countries
Using the old random sampler https://new.censusatschool.org.nz/tools/random-sampler/ on CensusAtSchool, students can select the CAS international database. If they select subpopulation and then country, boxes will show so they can select 30 from each country.
They can download the sample and import into CODAP to explore.
The data set contains 20 variables, two of which are the travel variables we have been looking at.
Encourage students to explore the full data set using CODAP and develop their graphing and describing skills.
Figure it Out Links
Some links from the Figure It Out series which you may find useful are:
Getting partial: Fractions of sets
This unit develops the concept of a fraction as an operator, or multiplier, acting on an amount, e.g. two-thirds of 24. Using fraction multipliers to represent the relationship between different amounts is also explored.
Fractions are an extension of whole numbers and integers. Fractions are needed when wholes (ones) are not adequate for a task. Division often requires equal partitioning of ones. Sharing two chocolate bars equally among five people requires that the bars be cut into smaller equal parts. The operation might be recorded as 2÷5=2/5. Note that the number two fifths, is composed of two units of one fifth. In practical terms the equal share can occur by dividing each of the two bars into fifths, then giving each person one fifth from each bar.
Many contexts involve relating the relative size of discrete quantities, that is, quantities that are collections of individual items. According to Tadanobu Watanabe there are two types of relationship, part to whole, and whole to whole.
Fractions can represent the relationship between part of a set and the whole set. In the diagram below one quarter or four eighths of the whole set is grey.
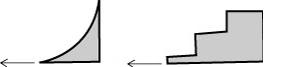
Fractions can represent the relationship between two independent sets or amounts. To complicate matters the sets can be within a whole set, as in a ratio situation.
In the left-side diagram, the grey set has three quarters or six eighths of the number of items that the white set has. In the right-side diagram, there are three quarters as many grey circles than there are white circles, within the same set.
Set to set comparisons are common in the real world, in situations like comparing prices with those some time ago, calculating lambing or calving rates, measuring population growth. Part-whole comparisons are particularly important in situations like comparing groups in statistics, finding the most accurate goal shooter, or sharing sets equally.
Set models tend to be more complex than continuous models like lengths, areas, and volumes, though measurement attributes vary in perceptual difficulty. Set models have the added complexity of competing wholes (ones). Suppose that a box has 12 chocolates, and three of them are strawberry flavour.
To establish that one quarter of the set is strawberry requires imagining the 12 chocolates as one whole set, when each chocolate is a whole in its own right. Establishing quarters requires imagining the three wholes as one quarter, relative to the whole set.
Comparison of fractions, and equivalence of fractions is particularly challenging with sets models. The fraction of grey circles in the left-side set can be expressed as 1/4 or 3/12. The fraction of grey circles in the right-side set can be expressed as 1/4, 2/8, 3/12 or 6/24. Each expression requires you to imagine the set as a whole and create different partitions of that whole. Note that both sets have the same fraction of grey although the size of the sets are different.
The learning opportunities in this unit can be differentiated by providing or removing support to students and by varying the task requirements. Ways to differentiate include:
The context for this unit is toppings put of pizza. While most students are familiar with pizza as a common food, other contexts may be more meaningful to your students. Activities can be adapted to suit the interests and experiences of your students. For example:
Te reo Māori vocabulary terms such as hautau waetahi (unit fraction), tau whakarea (multiplier) and rautaki whakarea (multiplicative strategy) could be introduced in this unit and used throughout other mathematical learning.
Getting Started
In this lesson students connect circular region models of fractions with finding fractions of a set. By the end of the lesson students should be able to unitise a given set into different parts, and name the part-whole relationships in terms of those parts.
Begin with PowerPoint 1 that presents the scenario of distributing toppings, like pieces of salami, evenly around a pizza. Students are often familiar with a circular region model so the connection to a discrete model is useful.
For each scenario (topping) ask questions like:
Note that the problems are about finding a unit fraction of a set, so the fraction behaves as a multiplier. Therefore, the equation might be written as multiplication or division, e.g. 1/4×36=9 or 36÷4=9. Students who use additive build up to anticipate the result should be encouraged to use multiplicative thinking with questions like:
The final question is about finding a multiplication or division fact that approximates the solution, from which the student can derive the solution. For example, 40 ÷ 5 = 8 can be derived from 10 ÷ 5 = 2 (See Slide Four).
After working through PowerPoint 1, ask students to work on Copymaster 1 in pairs. The problems all involve finding a unit fraction of a set, in the same pizza scenario. You might make materials, like counters, available to some students but encourage them to anticipate the result of the equal sharing first. Look for your students to:
After completing Copymaster One, students play The Pizza Game. Cards for the game are made from Copymaster 2. Print two sets of the Copymaster to make a total of 32 cards. The game is played with two or three players. Each team of players needs two dice made from blank wooden cubes, or by using stickers over normal dice. The dice are labelled:
Easy Game: 14, 15, 16, 18, 20, 24, and 25, 27, 30, 32, 36, 40.
Hard Game: 35, 36, 40, 42, 45, 48, and 50, 54, 56, 64, 72, 81.
Spread all the cards in the middle, face up so all players can see them.
How to play
Players take turns to:
The winner is the person with the most pizza cards when play finishes, or when all pizza cards are gone.
Exploring
In the following two sessions students extend their knowledge of fractions as multipliers (operators) to non-unit fractions, that is fractions with whole numbers greater than one as the numerator, e.g. 2/3 and 4/5. Then students explore the part-whole relationships in ratios, using fractions to represent relationships.
Session Two
Begin with PowerPoint 2 that shows how to find a non-unit fraction of a set. Progress to Slide 6. Students will notice that the first four slides are the same as PowerPoint 1.
Students should suggest that the number of toppings is divided by the number of pieces. Why? (To establish the unit fraction). Then the unit fraction is multiplied by the number of pieces that are eaten.
Take at least two of the examples from PowerPoint 2 and write equations for the situations.
Discuss the meaning of the x symbol as ‘of’ and how the numerator and denominator of the operating fraction impact on the calculation, e.g. 4/5 is found by dividing by five then multiplying by four.
Put the students into groups of four and provide the puzzles made from Copymaster 3. There are five puzzles. Each student gets one card for each puzzle. They must work with their team-mates to find a solution that matches all the clues. Each player must ‘own’ their clue, that is, ensure that they retain it and that the solution matches their clue. Encourage the students to record their strategies in some way on paper.
Look for your students to:
After an appropriate time bring the class back together. Focus on one or two puzzles that brought out interesting strategies. Choose groups to share their solutions. An important idea is that either order of multiplying by the numerator and dividing by the denominator works. Usually dividing first is more efficient.
Session Three
Begin with the game “3 in a line.” Gameboards can be printed and laminated using Copymaster 4. The game requires students to practise finding non-unit fractions of whole numbers. An important feature of the game is that equivalent fractions operating on the same whole numbers produce the same product, e.g. 3/4×24=18 and 6/8×24=18.
3 in a line
You need:
To play:
Players take it in turns to choose a paper clip on their choice of fraction and on their choice of whole number. They find that fraction of the number and, if it is not yet taken, place a counter of their colour on it. The winner is the first player to have three counters of their colour in a row.
Do your students?
Next return to the pizza context to introduce the concept of part whole fractions within ratios. Use PowerPoint 3 to introduce the concept and provide important questions. Emphasise these key points:
Let students work on Copymaster 5 individually or in small groups. You might use counters or cubes of various colours to represent the toppings. Manipulation of the ‘toppings’ in physical form can help students as long as they are invited to anticipate the results of division before acting. Look for your students to identify the whole, use fractions to represent the part-whole relationship for each topping, and simply the fraction, if possible, using common factors. The second page of problems requires students to organise a complex set of clues to establish a mix of toppings. Trial and error approaches may be common but encourage your students to organise the clues by usefulness. Physical objects can be useful to try swap ‘toppings’ as clues are considered.
Reflecting
The final session of the unit develops the use of fractions to describe the relationship between different wholes and between parts in the same whole.
Begin with the starting problem on PowerPoint 4. This task is very rich as it involves ideas about area and comparative price, as well as the comparison of toppings.
If you like pepperoni pizza, which are you better to buy, two small pizzas or one large pizza?
Let your students investigate the problem in small groups. Encourage them to develop an argument about which option is best, and their reason for choosing it. After a suitable time gather the class to discuss their answers. Groups should balance at least two characteristics, from area, price, number of pieces of salami, convenience, amount of crust, etc.
Each option is okay because the large pizza is twice the price but is twice as big the little pizza (attending to area though the large pizza is actually 2(1 )/4 times as big).
A response like that contradicts:
The small pizza is better because the larger pizza is only one and one half times as big (attending to diameter) but twice the price as the small pizza.
Note that capable students might calculate the areas (Small: π×132= 530.93cm2; Large: π× 19.52= 1194.59cm2) and provoke a discussion about comparative areas.
Encourage different kinds of comparison, such as:
If you just looked at the number of slices of salami, which option should you go for?
The small pizza has eight pieces of salami while the large pizza has 14 pieces. Buying two small pizzas gives two more pieces of salami for the same price.
Slides 2-9 focus on using fractions to describe the relationships between different numbers of salami pieces (different wholes). The large pizza has 14/8=7/4=1 3/4 as many pieces of salami as the small pizza. Conversely, the small pizza has 8/14=4/7 times as many pieces of salami as the large pizza.
Lining up the collections of pizza pieces makes the comparison easier, but student still need to do the following:
Using Copymaster 6 students create a puzzle that involves fractional multipliers. The four pizza cards are put at the corners of a square. Then students place the arrow cards between the pizza cards to represent the correct relationships between the numbers of pieces of salami. For example, the multiplier card ×4/3 goes between the six-piece pizza and the eight-piece pizza, since 6×4/3=8. Let the students solve their puzzle in pairs or threes of mixed ability. Challenge students to consider how the multipliers might be expressed as mixed numbers as well, e.g. ×4/3 can also be expressed as ×1 1/3. Note that most of the operators require simplification using common factors, e.g. ×8/6 is simplified to ×4/3.
As a final challenge students, can use the blank sheets 3 and 4 of Copymaster 6 to create their own puzzle for others to solve.
Kia ora family and whānau,
This week we explored fractions of sets. We used a pizza context to see how to solve problems like “two thirds of 24 equals 16.” The unknown was changed around so sometimes we had to find the product (answer) and other times we had to find the multiplier (fraction) and other time the starting number, like 24. We also explored finding fractions in ratios and identifying the fraction multiplier between amounts.
Pizzas were used as the context for the unit. Ask your child to show you how they can find 3/4 of 20 by putting paper pepperoni slices on a paper circle shaped pizza.
Marble Roll
In this practical unit students make ramps, roll marbles down them, record the distance the marble travels from different starting positions, graph these distances, predict other distances, and make statements based on the data they create.
Scatter graphs are introduced in this unit. To understand scatter graphs students need to comprehend the relationship between the horizontal and vertical axes, i.e. the x-axis and y-axis. They also need to perceive how one mark on a graph displays the related values for two variables. A standard convention is to represent the independent, or explanatory, variable on the x-axis. The dependent, or response, variable is represented on the y-axis. A given point, say (30, 22), represents a single occurrence such as a marble released from a height of 30cm (the independent variable) that rolls for 22cm on the carpet (the dependent variable). A collection of single instances is represented by a collection of points on a scatter graph.
Making predictions based on information from graphs and from student’s own experimenting is a feature of this unit. The nature of predicting, the risks of predicting based on a small number of trials, handling unexpected results, looking for patterns and trends and making sense of the results are all important areas of learning that are covered in this unit. They may require additional teaching depending on the needs of your students.
The practical nature of the activities will make the unit accessible to most students. The learning opportunities in this unit can be differentiated by providing or removing support to students, or by varying the task requirements. Ways to support students include:
The context of the unit, marble rolling, is a contrived setting. There are numerous implications of the experiment for everyday life. Relate the rolling of a ball to launching a waka, riding a bicycle, or driving a car (downhill).
As you go faster how much harder is it for you to stop?
How does the surface alter your stopping distance? Is it easier to stop your bicycle going downhill on a dry road, or a wet road? …on concrete or on gravel or sand? Why?
These discussions might lead to a broader investigation of safety related to moving bodies. For example:
Why are rock falls, avalanches and lahars (mudflows from a volcano) so dangerous? This could be related to learning about rock falls after earthquakes or severe rainfall, avalanches in the Southern Alps and the Tangiwai Train Disaster 1953 when a volcanic lahar erupted.
If a runaway sheep is racing downhill, should you try to stop it?
Te reo Maori vocabulary terms such as poi (sphere), mita rūri (metre ruler), mitamano (millimetres), mitarau (centimetres) and kauwhata marara (scatter graphs) could be introduced in this unit and used throughout other mathematical learning.
Session One
During this session students make ramps, roll marbles down the ramps, and record the distance the marbles travel. The creation of ramps in this session could be linked to procedural writing. Videos of world record marble run attempts can be found online, and could be used to ignite interest in this context.
What unit of measure is best? (centimetres may not be accurate enough so millimetres might be used).
What is the best way to record the results? (Creating a table on a digital platform will allow for quick display and analysis of the data).
Why does the marble stop? (Discuss friction).
Did the marble roll the same distance each time? (Unlikely).
Why did the distance vary? (Consider factors like marble release, variations in the surface of the run and carpet floor, dust on the marble or run, interference from movement or wind, or any other factors that might cause variation).
What is the best way to get a measure of ‘usual’ run from the top of the run? (Students might suggest finding an average or simply recording the range. Some distances might be removed as they are outliers).
Session Two
Will the starting point of the marble make any difference to the distance the marble travels?
Students should expect that the marble will roll further if released from higher on the ramp.
Why will the marble roll further when released further up?
Students will have ideas about why variation in distance occurs. Avoid giving the scientific explanation. The higher the point that the marble is released from, the greater is its potential energy. That energy converts to greater speed when the end of the ramp is reached. Friction takes longer to slow a faster marble to a stop.
Release a marble from each of the five starting positions, listed below. Carry out five trials (marble releases) from each starting position. Record the distance travelled from the end of the ramp for each trial. For each experiment, encourage students to predict what might happen.
Start the marble at the top of the ramp and record the distance it travels from the bottom of the ramp.
Could this graph be helpful in predicting other starting positions?
What distance would the marble travel if the release height was 50 cm?
Create a class chart or record of these points. During discussion, add to the chart as the graph features are identified. This could be digital or hard-copy.
How did you use the data from your trials to make predictions? (Students should reveal an understanding of a trendline)
Do you expect the same results or something different? Why?
Session Three
This session has the students looking at a range of scatter graphs of data from marble rolling, with the task of predicting distances the marble is likely to roll. The discussion about making sense and using information from scatter graphs started in Session Two continues and is developed during this session.
There are six scatter graphs for the students to look at and predict from. Consider the best way to engage all students in discussion of the graphs, i.e., hand them out altogether, one at a time, or set up six stations for groups of students to visit. Asking students to discuss and explain their thinking is a very important part of this session. The discussing and predicting allows teachers to assess student understanding and the amount of teaching needed.
Scatter Graph Samples, Copymaster 2, has the six scatter graphs for students to look at.
Use the following questions as part of the discussion. These will help students to answer the two questions on the sheet.
Sessions Four and Five
During this session the students are to build their ramps again with one aspect of it changed. The students could change the height and angle of the ramp, use marbles of different sizes or a golf ball could be used instead of the one marble, the surface the marble rolls on could be different, etc.
This activity could be repeated several times with different changes made.
"What if . . ." questions could be posed to challenge students:
What if the ramps from Session One were two metres long, how long would the marble roll from the top of the ramp?
What if the ramps were curved?
What if the surface was grass, concrete, or lino instead of carpet?
What if we rubbed the marble with a wax candle?
What if we measured time instead of distance for the marble to stop?
Dear parents and whānau,
This week in maths we are investigating the distance a marble rolls along the floor when we roll it down a ramp.
Ask your child to tell you about what we did. Maybe you could build a ramp at home and try some experiments together.