In this unit students work with growing patterns made from square tiles. Students represent the relationships between pattern number and number of tiles using tables, graphs and rules, in order to predict further terms of the pattern.
- Continue a linear growth pattern from a few examples.
- Find the recursive rule of a linear growth pattern from a table of values.
- Explain why the graph of relationships in the pattern is linear.
- Use the table and recursive rule, and/or the graph to make predictions about other terms of the pattern.
- Attempt to create a general rule that connects term number and number of tiles for any term of the pattern.
A linear number pattern is a sequence of numbers for which the difference between consecutive terms is always the same. If plotted on a number plane the graph of a linear pattern is a straight line.
A progression in the way students process linear patterns is well established in the research. That progression is as follows:
- Copy a spatial pattern with materials.
- Identify change and extend the spatial pattern with materials.
(Make the next term for the pattern). - Represent the relationship between term number and number of items and use recursive rules to predict further members.
(Find the number of items required to make the next term without needing to build it). - Use function (direct) rules to connect term numbers with number with the number of items.
(Find the number of items required to make any given term without needing to know the number for the previous term). - Reverse (direct) rules to find the term number for a given number of items.
(Given a number of items, find which term number would require that many).
Click to download a PDF with further information.
This unit is aimed at achievement of Level 3 in The New Zealand Curriculum, which requires students to develop recursive rules. Level 3 involves progression from phase 2 to phase 3 of the above progression.
The learning opportunities in this unit can be differentiated by providing or removing support to students and by varying the task requirements. Ways to support students to progress through the phases include:
- providing access to materials and restrictions on the terms for prediction. This makes the level of challenge appropriate for students that need to consolidate understanding of the first two phases. Asking for the number of items in the tenth member of a pattern is a good guideline
- providing support in representing the relationship between term numbers and the number of items, using tables, graphs and diagrams for students progressing to the third phase
- providing tasks that push beyond terms easily found with recursive rules for students progressing to the fourth phase (direct rules). Asking for the number of items for the twentieth, fiftieth, or hundredth term is a good guideline
- encouraging sharing and discussion of students’ thinking
- using collaborative grouping so students can support each other and experience both tuakana and teina roles
- encouraging mahi tahi (collaboration) among students.
The unit is based around patterns with square tiles, which is relatively context neutral. It may be that situations from real life motivate your learners. Attention could be given to growing patterns seen in Maori tukutuku panels and Samoan ngatu patterns. The patterns could be contextualised as buildings made of sections, stone paintings (kohutu peita), planting of trees, or fruit ripening in a tray. You might like to discuss situations in which everyday patterns grow in a consistent way, such as saving the same amount of money each week, planting the same number of native New Zealand trees each week, stacks of items in the supermarket, shoes related to the number of people, or chairs on a bus or aircraft.
Te reo Māori vocabulary terms such as tauira (pattern), pānga rārangi (linear relationship), and ture (rule, formula) could be introduced in this unit and used throughout other mathematical learning.
- Square tiles
- Calculators
- Copymaster 1
- Copymaster 2
- Copymaster 3
- Copymaster 4
- Copymaster 5
- PowerPoint 1
- PowerPoint 2
- PowerPoint 3
Getting started (Session One)
The unit begins by looking at the growth patterns of even and odd numbers. It is important that students ‘see’ even numbers as multiples of two, and odd numbers as multiples of two plus or minus one. The lesson also looks at generalisations about what happens when even and odd numbers are added.
- Build the ‘factories’ in the diagram below, using square tiles, drink coasters, or similar square-shaped objects (PowerPoint 1, slides one and two). They could also be constructed digitally (e.g. on a PowerPoint).
How many squares make up the first factory? The second? The third? etc.
What is changing and what is staying the same as the pattern grows?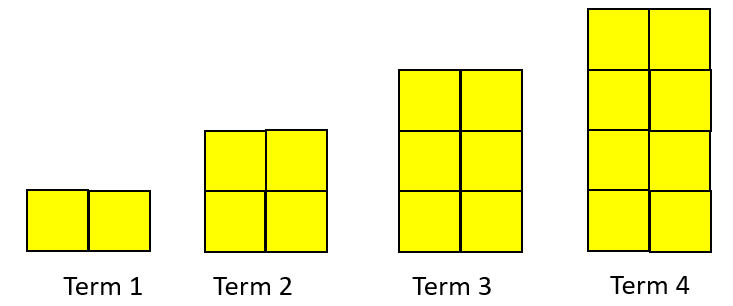
- Let students solve the next problem collaboratively using materials if need be. Their strategies will indicate their current achievement against the progression.
How many squares make up the tenth factory? - Ask the same questions for the pattern on slide two.
- Slide Three presents the two growing patterns on top of one another.
How are these two patterns related? (The terms in the second sequence (odd numbers) are one less than the first sequence.) Ask your students to create tables for the first four terms of each pattern. For example:
Term 1 2 3 4 10 Number of tiles 2 4 6 8 ? How could the table be used to find the number of squares in term 10?
- Students might notice that the number of tiles goes up by two for each increase of one in the term number. This recursive rule can be used to find any term in the pattern but requires a bit of work.
- If your students can use the ‘add two’ recursive rule to further the table pose the following challenge to encourage direct rules.
If you had to find the fiftieth term in the pattern would you use the ‘add two’ rule? Why not? How would you find the fiftieth term in each pattern? - Let your students collaborate in small teams. They might realise that repeated adding of twos is inefficient and suggest a direct rule, i.e. multiply the term number by two (even pattern) or multiply the term number by two then subtract one (odd pattern).
- Finally use Slides Four and Five to introduce the prediction of combining terms.
You might provide further examples for your students as scaffolding.
Can you predict the result if I join two terms?
How will you describe your method so someone else can use it? - For the even pattern the result of joining terms 3 and 5 is term 8. The general rule is “Add the term numbers and multiply by two.”
- For the odd pattern the result of joining terms 3 and 5 is term 7 in the even pattern (7 x 2 = 14). The general rule is “Add the term numbers, multiply by two, then subtract two.”
For students who develop the rule quickly provide these challenges:
- Kayla joins two terms in the even pattern and gets a total of 40 squares. What can you say about the terms she joins?
- Tipene joins two terms in the odd pattern and gets a total of 40 squares. Which terms might he join?
- Hana finds a rule for joining a term in the even pattern with the same term in the odd pattern. What is her rule?
- If an odd term is taken away from the same even term, how many squares remain? Why?
Session Two
In this session students use a spatial pattern made with square tiles to investigate how relationships that exhibit constant difference are represented with graphs.
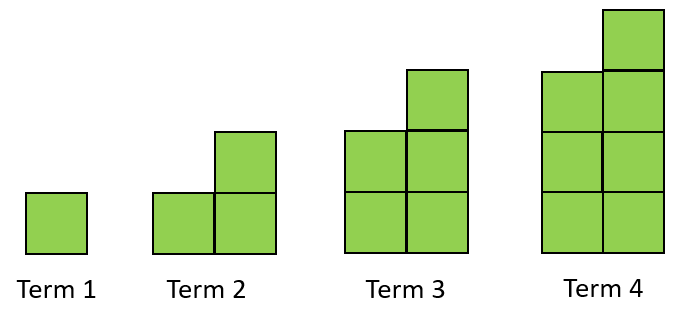
- Show your students PowerPoint 2, slide one, which shows a growing pattern. Ask students what they notice about how the pattern grows from one term to the next.
- Ask students: Can you imagine what Term Ten looks like? Describe it to a partner.
Look for students to anticipate ten empty spaces or squares surrounded, on all sides, by square tiles. - Ask students to work with a partner to predict how many square tiles they would need to build Term Ten.
Look for students to:- Use the element of growth to extend the pattern physically (with tiles) or diagrammatically
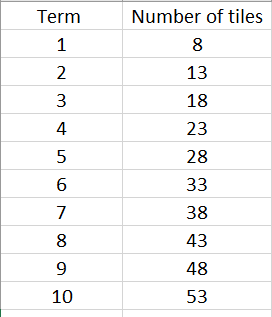
- Use a table and notice that there is a constant growth of five tiles between consecutive terms
- Extend the repeated addition of five to calculate that 53 tiles are needed
- Use multiplicative direct rules such as 8 + 9 x 5 or 3 + 10 x 5 to find the number of tiles
- Be prepared to extend students who use direct rules with challenges like:
Why do the different rules like 8 + 9 x 5 or 3 + 10 x 5 give the same number of tiles?
How many tiles are needed to make Term 20? Is that twice as much as Term 10? If not, why not?
If you had 998 tiles, what term could you make? Explain. - Share the strategies students used to create term Ten. Discuss efficiency. Go to a spreadsheet or online graphing tool, such as Desmos. Create a table of data from the students’ earlier work. You might highlight using the drop-down capability to repeatedly add five easily.
- Ask students how they might graph the relationship.
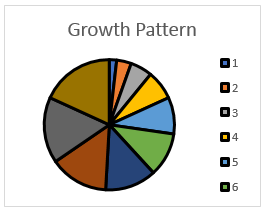
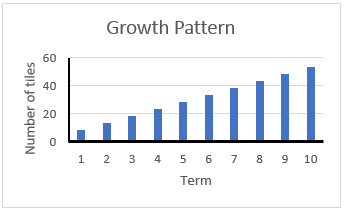
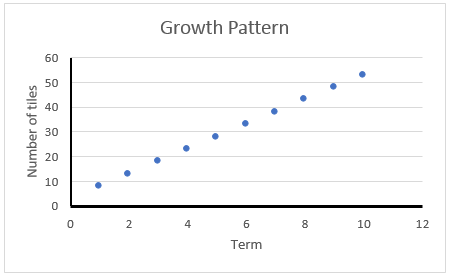
Students might suggest using a familiar type of display, like a bar graph. Use the spreadsheet to create the graphs they suggest. If they do not suggest a scatter plot then make that your choice.
Which graph best shows how the pattern grows?
What do you notice about that graph? - Note that the pie chart is not very useful. Both the bar graph and scatter plot show the constant growth.
- If your students have digital devices you might send them away to create their own graphs. There is also considerable merit in them creating the graphs by hand as they will need to attend to scale, axis labels, location of points and heights of bars.
- Gather the class and focus on the scatter plot. Draw students’ attention to specific points and ask what the coordinate represents (an association between a term number and the number of tiles).
As you go up one in the term, how many tiles do you go up by? (five)
How does this “up five” rule show on the graph? (The points are in a straight line)
How could we use our graph to predict the number of tiles for Term 20? (extend the line and see what point matches Term 20- See PowerPoint 2, Slide 2)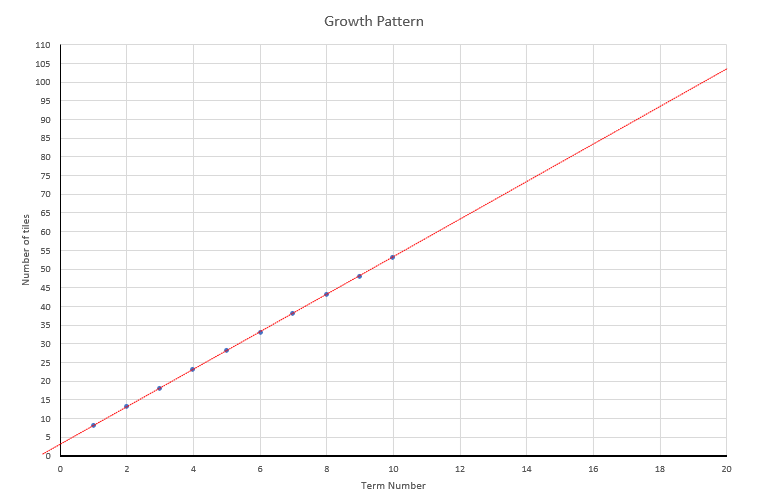
What does this point (20, 103) tell us?
How accurate is this method? Where can it go wrong? (Slope must be exact) - Ask students to find the value of Term 20 using a line on their graph.
What other terms can you read off from your line? (e.g. Term 15 equals 78) - Introduce Copymaster 1. The pattern is like the previous one in that it grows in a block fashion. However, the constant difference is six rather than five. Slide Three allows you to display the ‘new’ pattern.
- Talk through the requirements of Copymaster 1 then let your students solve the problems in collaborative groups of three or four. Use Slide Four to discuss what each student, Teina, Phillip or Cameron, ‘sees’ in the pattern for Term Four (colour coded).
What would each person write for Term 10? … for Term 30? … for any term number?
Which person’s rule is the most efficient to use? Why?
Session Three
- Use Copymaster 2 to set out six stations for your students to complete. Letting them work independently, or collaboratively in small groups, provides you with an opportunity to observe what students do and interact with them to support their progression. Make sure students have access to square tiles and square grid paper (e.g. exercise book) to support them. You might choose to develop workshops for students who feel they need help with graphing, creating tables, or developing rules. Students should use online graphing packages or spreadsheets to graph the relationships, as well as manually drawing the graphs.
- The answers to each Station are given at the end of Copymaster 2. Expect your students to show agency by checking their own answers, addressing errors, and identifying areas in which they need further support. You might set up a chart for them to indicate whether, or not, they have control of the specific learning outcomes. Copymaster 3 provides an empty template for this:
● Not yet ? Maybe P Yes
| Continue a linear growth pattern from a few terms. | Make a table of values. | Draw a graph. | Use a table or graph to find a term in the pattern. | Create a rule for finding any term in the pattern. |
Annie | P | P | P | P | P |
Tariq | P | P | P | P | P |
Tipene | ? | ? | ? | P | P |
Vey-un | ● | ● | ● | P | P |
Sione | ● | ● | ? | P | ? |
Session Four
In this session you differentiate the class into two groups, those that feel they need more help with patterns, and those who think they can attempt a challenging pattern investigation independently.
- Give the more confident group Copymaster 4 to work on independently or in small groups. Note that numbers 2 and 3 provide enabling prompts for students to support their independent investigation. Students should read the prompts if they are stuck, rather than interrupt your teaching group/s.
- Use PowerPoint 3 with the other group to introduce a structured approach to predicting further terms in a growth pattern. Work through the slides progressively. Points to note are:
- Predictive rules can come from seeing patterns in tables of values and/or structure in the figures, e.g. four arms that grow
- Different ways of seeing lead to different rules
- Rules for any term can be found by looking for similarities among specific terms
- With linear relations graphs can be used to predict further terms.
- After a suitable period, bring together the two groups to share their learning. Bring out the similarity of the two problems, which are both applications of linear relationships.
- Students could work collaboratively on problems from Visual Patterns for further practice.
Session Five
Copymaster 5 provides a task that can be used to assess your students. They will need access to a calculator. You might also provide the students with square grid paper to make sketching the yacht pattern easier.
Let your students work independently and use the data to check their achievement against the criteria in Copymaster 3. Students might exchange worksheets so you can mark the task collectively.
Dear parents and whānau,
This week in algebra we have been looking at patterns made with squares tiles and how these patterns can be continued. We have looked at different ways to predict how the patterns continue. A recursive rule tells you how to go from the number of squares in one figure to the number of squares in the next. A general rule is a rule that gives you the number of squares for any term in the pattern.