This unit is designed to connect the desire to improve performance in physical activities with developing an understanding of how data can be collected and analysed to make sense of the different attributes that could contribute to improved performance.
- Uses the statistical enquiry cycle to plan and conduct investigations
- Identifies broad area to explore using the statistical enquiry cycle
- Poses investigative questions about summary and relationship situations
- Makes predictions/assertions about what they expect to find out
- Plans for data collection
- Determines variables needed to answer investigative questions
- Plans how to collect data for each variable
- Survey questions
- Deciding how to make accurate measures when needed
- Collects data from the class
- Explores summary and bivariate data
- Uses multiple representations to analyse and display data
- Explores measurement and categorical data
- Describes distributions (summary - category and quantitative), relationships (bivariate)
- Communicates findings using the entire statistical enquiry cycle
- Answers the investigative question using evidence
Integrating statistics within another curriculum area is a powerful way of showing how useful statistics is to many aspects of the world we live in. There is a connection between statistics and physical education that is valuable to contribute to improving performance in physical activities such as throwing and catching.
This series of sessions is designed to connect the desire to improve performance in physical activities with developing an understanding of how data can be used to support improved performance and how data can be used to make sense of the different attributes that could contribute to improved performance.
Alongside the statistical investigation on throwing and catching, the class is introduced to the CensusAtSchool census, data collection and analysis. Using a software data analysis tool is introduced and the students develop their data enquiry skills using the CensusAtSchool data.
At curriculum level 4 students are telling the class story in detail with supporting evidence. They are posing comparison and relationship investigative questions, planning investigations including data generation, collecting and displaying measurement data, describing distributions, comparing distributions visually and identifying patterns in relationships visually.
This unit explores the entire statistical enquiry cycle over a number of sessions using primary data. Students will explore factors that could influence their ability to throw and catch (or other physical education activity e.g. running and jumping). As well, they will explore the relationship between initial throwing and catching ability and final throwing and catching ability after coaching and practice to answer the investigative question: Has coaching and practice improved their ability to throw and catch?
Associated Achievement Objectives:
Health and Physical Education:
Movement Concepts and Motor Skills
- Demonstrate consistency and control of movement in a range of situations
- Demonstrate willingness to accept challenges, learn new skills and strategies, and extend their abilities in movement-related activities
- Experience and demonstrate how science, technology, and the environment influence the selection and use of equipment in a variety of ways
Relationships with Other People
- Describe and demonstrate a range of assertive communication skills and processes that enable them to interact appropriately with other people.
- Physical education materials for the associated physical activity.
- Access to devices for online data analysis.
- Access to devices for video recording and playback.
- Copymasters as listed at bottom of unit.
This unit of work is presented as a sequence of 12 sessions. It is likely that more sessions may be required, and at times some sessions may take more than one teaching period.
The lesson structure will vary depending on space and availability of specialist teaching spaces e.g. gymnasium, computers. Sometimes the lesson will be physical education focused, and sometimes it will be mathematics focused. At other times the group may be split into two with some students doing physical education and some students doing mathematics.
The statistical software used is CODAP. It is browser based and tutorials in a NZ context can be found at http://karekareeducation.co.nz/category/codap/.
Session 1
The first session is about setting the scene. Key questions such as why we need quality data and how to avoid errors in data collection are discussed. Possible physical attributes that could contribute to our ability to throw and catch are also discussed.
- Setting the scene – focus of the unit of work
- Factors/attributes that might affect our ability to throw and catch - online search for ideas to explore, interrogating the ideas generated
SLOs:
- Set the scene for the unit and start to connect the mathematics and physical education (PE) to the context.
- Do some throwing and catching in the context of a game, considering elements of throwing and catching.
- Preparing for baseline data collection of throwing and catching data; and thinking about what factors/attributes might affect our ability to throw and catch what other information is needed to test theories about throwing and catching.
Activity 1: Introduction to the PE focus – throwing and catching
We are going to explore (1) what factors/attributes might affect our ability to throw and catch, (2) if instruction and practice improve our ability to throw and catch and (3) quality data collection.
Introduce the PE focus for the unit of work – throwing and catching. Discussion around the three things we will explore as listed above and how all of these connect to support improving our ability to throw and catch.
An initial PE activity where students are using the skills of throwing and catching. Drawing students’ attention to the techniques of throwing and catching and thinking about what attributes the better throwers and catchers might have. This could be a game of dodgeball.
Following the initial PE activity, explain how the baseline data for throwing and catching will be collected.
Activity 2: Considering factors that might affect our ability to throw and catch
After the initial PE activity students work in small groups and discuss the following prompts, capturing their ideas on paper to share back to the whole group.
They should consider the game they have just played focusing on the throwing and catching and how the baseline data will be collected.
Prompts for brainstorming are provided for this (Copymaster 1) – enlarge to A3.
Suggested prompts:
- What attributes or factors do we think might affect our ability to throw?
- What attributes or factors do we think might affect our ability to catch?
- What are the main things to consider when undertaking the baseline data collection for throwing and catching.
- Why is accurate data important?
Generating additional ideas as to what factors/attributes might affect our ability to throw and catch?
- It is possible that students could do research to see if they can come up with other ideas.
- For example, factors influencing ball throwing velocity in young female handball players included: hand spread; playing experience; arm span; body height; standing long jump. See https://pdfs.semanticscholar.org/556e/4e6ee6b8f1bbe188da6a4524b7544d37a387.pdf.
- Sourcing additional prompting questions from PE manuals
- For example, prompting questions could include:
- What parts of your body are you using when throwing?
- Does throwing hard feel different to throwing softly?
- How would you describe what your hands are doing when you catch and throw the ball?
- https://www.qcaa.qld.edu.au/downloads/p_10/kla_hpe_sbm_207.pdf
- For example, prompting questions could include:
Once the brainstorming is completed, and the students have shared back, several ideas should have been generated for data investigations. Through this process the students are starting to be data detectives, they are starting to understand and define the problem and to think about how they might go about answering the question.
Get students to select one or two areas that they would like to explore further to answer the overarching problem:
What factors/attributes might affect our ability to throw and catch?
Get the students to interrogate each of their areas they will explore. Questions they could ask of each area include:
- Is this an area that the students in our class would be happy to share information with everyone? If not reject the idea [ethics].
- Can we collect data to answer an investigative question based on this area of interest? If not reject the idea [ability to gather data to answer the investigative question].
- What would be the purpose of asking about the idea that you have, do you think it will provide meaningful information as to factors that affect our ability to throw and catch? If it is not purposeful then reject the idea [purposeful or interesting].
- Would the investigative question we pose to explore this area involve everyone in the class? If not, then reject the idea [involving the whole group].
Collect in the brainstorming sheets.
At the end of the session each group should have identified at least one area they will explore.
Examples of student generated ideas
- Better technique
- Technique – how we stand and follow through
- Attitude
- Play more sport generally
- Past experience
- Accuracy
- Height
- Coordination
- Strength
- Arm length
Session 2
In this second session, students:
- are introduced to the CensusAtSchool online survey
- consider how to accurately collect data for the CensusAtSchool survey
- design data collection questions to test their theories about what affects their ability to throw and catch
- consider how to accurately collect data for their data collection questions.
SLOs:
- Developing data collection questions
- Deciding how to make measures as needed for data collection questions
Activity 1: CensusAtSchool survey – introduction and making measures
For the purpose of this unit plan the information and links here are based on the 2019 CensusAtSchool survey. This will still hold for 2020. For 2021 and beyond you may need to update based on the current CensusAtSchool survey.
Teachers should register their class for the CensusAtSchool survey https://new.censusatschool.org.nz/take-part/register/.
An introduction to taking the CensusAtSchool survey can be found here: https://new.censusatschool.org.nz/take-part/
Actions here could include:
- showing the introductory PowerPoint
- explaining to the students when they will be doing the survey online
- handing out the data collection journal (for information that is gathered over time)
- introducing the survey questions that require measurements.
There are measurement stations set up ready for the data collection on the CensusAtSchool website. It is appropriate to use these directly with students who are working at curriculum level 3, but by curriculum level 4 and above students should be engaging in thinking about how to collect the data themselves. The level of guidance from the teacher will reduce the higher the curriculum level.
- Data accuracy is important when we are gathering data for analysis.
- One of the ways that the CensusAtSchool team works to ensure that the data is accurate is by providing detailed instructions on how to make measures.
The measurement data collection questions in the 2019 CensusAtSchool questionnaire are:
- Q8: What is your height, without shoes on? Answer to the nearest centimetre.
- Q9: What is the length of your right foot, without a shoe? Answer to the nearest centimetre.
- Q10: What is the circumference of your left wrist? Answer in centimetres to one decimal place.
- Q11: What is the circumference of your left thumb? Answer in centimetres to one decimal place.
- Q14: What is the weight of your school bag today? Answer in kilograms to one decimal place. (Weigh your school bag with all your books and other materials you brought to school today.)
- Q18: How long can you stand on your left leg with your eyes closed? Answer in seconds.
There are ideas for measurement accuracy on each of the cards in the CensusAtSchool guide.
Hand out each data collection question and ask students to think about how the measure could be made so that we would get valid and reliable data.
Also get them to think about (and note down) possible values for each of the measures. That is under or over what values would we question the result, and have it measured again.
Once this initial thinking has been done hand them the station card with the things to think about and get them to discuss each of the questions on the bottom of the card.
These activities with the CensusAtSchool data collection questions should set the students up so that they can think about what data collection questions they will pose to collect data to explore what factors/attributes might affect our ability to throw and catch.
Activity 2: Deciding how to collect measures for each of our factors so that we get valid and reliable data
In small groups discuss with students how they will collect the data to explore their area of interest.
Examples of potential ideas:
- Better technique
- Arm length (and height)
- Attitude
- Play more sport/past experience
- Handspan
With each smaller group unpack the variable/attribute they are thinking to explore and ask how they might measure it/collect information about it. See ideas in the table below.
For example:
| Area | Initial thoughts |
|
Better technique |
|
|
Arm length (or height) |
|
|
Attitude |
|
| Play more sport or past experience |
|
| Handspan |
|
They should think about how they might graph the data they collect to see if the factor affects their ability to catch and throw balls. (They are likely thinking of something that shows a relationship, the better they are at the attribute/factor, the better their throwing and catching score).
In order to answer our investigative questions about what factors/attributes affect our ability to throw and catch we need to collect specific information or data using data collection/survey questions. In this phase of the PPDAC cycle we are planning to collect our data. This means we need to pose data collection/survey questions.
Ask students about what they think might be useful to think about when they pose their survey question(s). Gather a few key ideas to help them with this. For example:
- The question needs to be specific
- Keep wording simple and short
- Avoid questions that ask about more than one thing
Students pose their data collection questions. They should also think about any specific instructions, e.g. if they were going to collect information about student’s height then they may want to describe how to set up a height measuring station. Refer back to the examples that were discussed for the CensusAtSchool survey.
Give them time to work on these ideas so that the data collection methods that are decided by the students can be used. Possible data collection stations are included as examples of how the data could be collected for the variables given (Copymaster 2) and data collection questions examples are in the recording sheet (Copymaster 3).
Guidelines for good data collection questions:
- Ensure the data collection question fits the information needs
- Ensure the data collection question is specific
- Keep wording simple and short
- Use terms consistently throughout any questionnaire or survey
- Provide reference periods
- Make sure data collection questions are inclusive of all respondents
- Avoid double-barrelled data collection questions
- Avoid leading and loaded data collection questions
- Avoid using sensitive data collection questions
- Avoid data collection questions which contain negatives
Activity 3: CensusAtSchool journal set up
Towards the end of the lesson set the students up to start to collect CensusAtSchool data that requires them to record information over one week. Hand out the journals (or give access to an online version of the journal). The 2019 CensusAtSchool journal is here. A google doc version can be copied from here into your school online classroom system.
Session 3
In this third session students are collecting their baseline data for throwing and catching. Your PE department may have their own processes for this.
Collecting baseline data for throwing and catching
There are three different pieces of information that are collected.
- Stationary catch
- Moving catch
- Throwing
Each student will need their own data card to collect their baseline data. The data card (Copymaster 4) could be used to collect final data (and mid-point if wanted) as well.
Instructions for set up to collect throwing and catching data
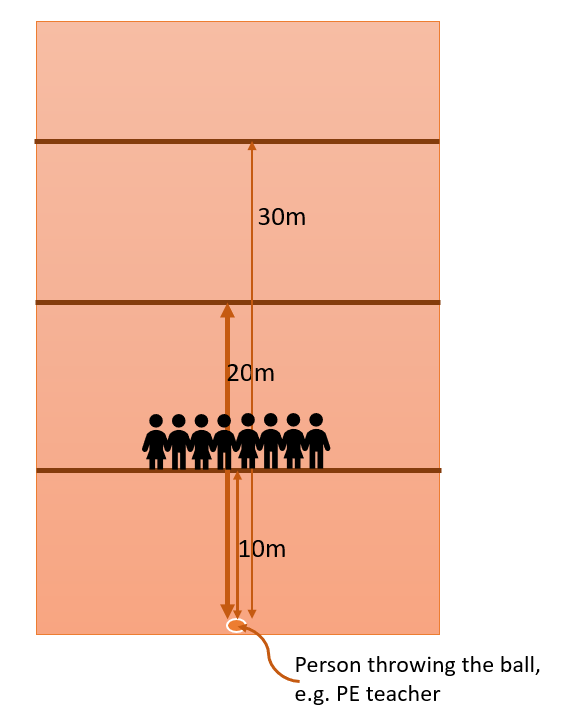
Stationary catch
Students will catch the ball at three different distances from the person throwing. There will be three throws at three different distances (10m, 20m, 30m) to catch, a total of nine catches per student.
The students line up at each of the three distances and the teacher throws the ball three times to each student. The student records the number of catches for each distance on their own data card.
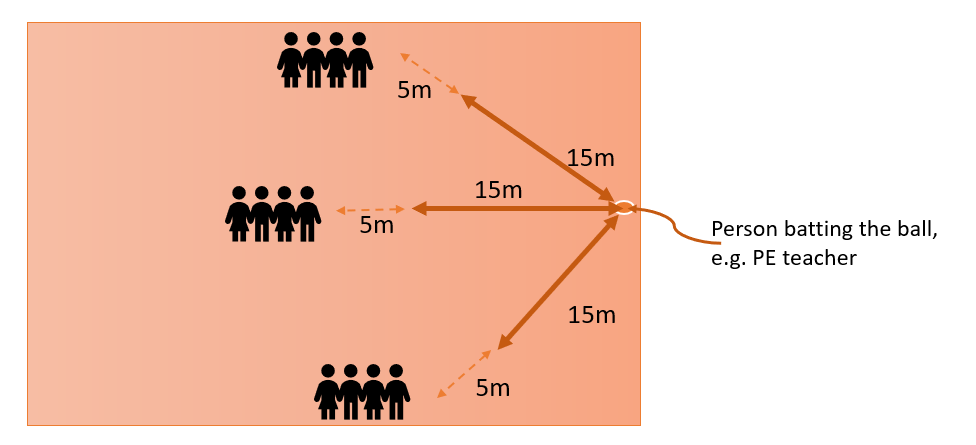
Moving catch
There will be three balls to catch at each of three positions. The starting positions are approximately 20m from the person batting the ball. The person batting the ball will aim to get the ball to land abut 5m from the student forcing a need to move to catch. Students line up behind each of the three positions and receive three balls to catch. Students record the number of moving catches in each position.
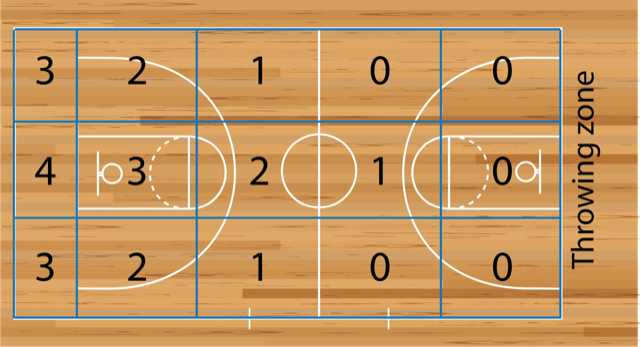
Throwing
The students get five throws from the throwing zone. Distance and accuracy are important. Depending on where the throw lands depends on the score. The gym is split up into zones based on a blue grid similar to the one below. The 12 larger zones should all be the same size, with the 3 higher scoring zones at the end around half the size. Students make their five throws and the score for each throw is recorded.
Collect in the data cards from the students at the end of the session. The data will be input along with other data collected in the next session.
Session 4
In this session students are collecting and recording any data that needs to be collected in preparation for data entry for CensusAtSchool and for the class investigation. With a longer lesson time it is probable that there would be time for a game or similar within the lesson as well.
SLOs:
- Making measures for data collection
Activity 1: Collecting data for CensusAtSchool and for our class investigations
CensusAtSchool stations
- Set up the measurement stations around the space that will be used. E.g the gym, the multipurpose room, the foyer.
- Measurement stations from CensusAtSchool.
- Copy the data cards for each student.
- Data cards for data collection from CensusAtSchool.
Class investigations stations
- Set up any stations that are required for the student investigations, for example see the measurement stations from Session 2.
- Arm length
- Better technique
- Handspan
- Copy a recording sheet for each student. The example recording sheet (Copymaster 3) includes the two additional data collection questions:
- Attitude - two questions on recording sheet
- Play more sport/past experience - questions on recording sheet
And two data collection questions from the CensusAtSchool (CAS) data card
- Height - copy from CAS one
- RF length - copy from CAS one
Collect in all data cards (CensusAtSchool) and all recording sheets (own investigations).
Keep these in a safe place until the data input lesson, which needs to be a week from Session 2 as the journal requires a week of data collection.
Teacher follow up activity
Prepare for student data entry for the class investigation survey/data collection questions. This could be done using a google sheet with the following column headings.
- Student name
- Gender
- Initial stationary catch
- Initial moving catch
- Initial total catch
- Initial total throw
- Height
- Arm length
- Right foot length
- Handspan
- Technique score
- Previous experience/play more sport score
- Attitude score
(add these later)
- Final stationary catch
- Final moving catch
- Final total catch
- Final total throw
Session 5
A PE session. Starting to develop their throwing and catching abilities.
This will include looking at the different aspects of throwing and catching technique, linking to biomechanics and look at strategies to improve. Student videos will be explored to identify which techniques are better.
Statistics focused sessions 6-10
The next group of sessions (6-10) describe the statistics component of the unit of work. These are interspersed with PE lessons. Sometimes this is a half/half split and sometimes it is a full PE or statistics lesson depending on what is being covered.
The focus of the PE sessions is developing students’ throwing and catching through specific drills and games.
Session 6
This assumes one week has passed since Session 2, the journals are complete, the CAS measurements, initial throwing and catching data has been collected, and class investigation measurements have been made/done.
In this session the students are completing the CensusAtSchool online questionnaire and inputting their Crunch the coach data. There may be time for a physical activity as well.
SLOs:
- Engaging in data entry.
Activity 1: CensusAtSchool questionnaire
Students will need:
- Journals (started in Session 2)
- Data cards (Session 4)
- Class code
- Access to a computer
Students complete the CensusAtSchool questionnaire online.
Activity 2: Class investigation data input
Students will need:
- Throwing and catching initial data (Session 3)
- Crunch the coach recording sheet (Session 4)
Students input their data into their copy of the google sheet and share with the teacher.
Teacher follow up activity
As a PE session may follow this data input session you will have a day or two to sort the data out ready for use. Both sets of data need to be put into CODAP documents for students to use.
CensusAtSchool questionnaire
Download the CensusAtSchool data for your class. Clean up the data to the variables you want to use in Session 7 and 8. Input the data into CODAP and get a sharing link for students.
For Session 7 you will need at least:
- Gender
- Mode of transport
- Reaction time
- Eye colour
- Height
- Time to school
- Weight of school bag
- Total screen time
- Number of times they do physical activity
- How often do students check their phone notifications when they wake up
- How often do students take their phone to school
Class investigation data input
Combine student data from their google sheets. Remove names and save as a csv file. Input the data into CODAP and get a sharing link for students.
This data will be used in Session 9.
Session 7
In this session students are introduced to using CODAP, common online data analysis platform, as a data analysis tool. They will start to explore summary situations. The statistical focus is on making predictions about what they expect to see and using CODAP to make statistical graphs. Summary situations are where they summarise data about one variable.
SLOs:
- Makes predictions/assertions about what they expect to find out for given investigative questions
- Exploring summary situations
- Using statistical software to make statistical graphs
Activity 1: Making predictions/assertions
For given investigative questions students make predictions about what they expect to see from the data. The investigative questions are about their data that was collected for CensusAtSchool.
Problem
Put the following 10 investigative questions around the classroom on the wall (Copymaster 5). Print sufficient copies of the second page so that all students can have a copy of the list.
Note that the questions are labelled with (C) or (M), for categorical and measurement variables.
Ask what the variable in each question is - in CODAP these are called attributes.
Also ask who might be interested in finding out the answer to these investigative questions and why.
The 10 investigative questions
-
How do students in our class get to school? (C) Variable is mode of transport
- What are the reactions times for the students in our class? (M) Variable is reaction time (seconds)
- What eye colours do the students in our class have? (C) Variable is eye colour
- What are the heights of the students in our class? (M) Variable is height (cm)
- How long does it take for the students in our class to get to school? (M) Variable is time to school (minutes)
- What are the weights of the school bags for the students in our class? (M) Variable is weight of school bag (kg)
- What was the total screen time (after school) on the night before the Census for students in our class? (M) Variable is total screen time (hours, 0.75 = 45 mins, 0.5 = 30 mins)
- How many days did the students in our class do physical activity in the week leading up to the Census? (C) Variable is number of times they do physical activity
- How often do students in our class check their phone notifications when they wake up? (C) Variable is how often do students check their phone notifications when they wake up
- How often do students in our class take their phone to school? (C) Variable is how often do students take their phone to school
Students select four investigative questions that interest them, they must have at least one (M) and one (C). They should tick these investigative questions on their sheet and write down what they predict the class data will show on their sheet.
They then transfer these predictions onto sticky notes and post them on the investigative questions around the room.
This will give us a broader range of predictions for any one investigative question.
Activity 2: Introduction to using CODAP
Learn how to use CODAP. CODAP is a free online analysis tool for drawing statistical graphs.
Students need to explore CODAP first before they start to use it as a data analysis tool. You can also watch a short video which goes through the basics here. You should make sure you have had a good exploration of CODAP before starting with your class. They should be able to follow through the instructions in the google doc.
Give the students 5-10 minutes to work through the getting started document and explore the data that is in the CODAP document. It is data on mammals.
Activity 3: Exploring CensusAtSchool data
Using class data and CODAP explore investigative questions by drawing graphs and writing about the graphs. More formal ideas on describing graphs in the next session. The focus of this activity is to become familiar with using CODAP and to start to write about graphs.
Share with the class the link to the CensusAtSchool CODAP document prepared at the end of Session 6.
Students work on the four investigative questions that they selected in activity 1. This is an initial introduction to describing graphs. At this stage it is quite open what they describe, in Session 8 we move to looking at describing the middle.
- Students draw a graph to answer their investigative question.
- Change the title of the graph to the investigative question.
- Make a text box.
- In the text box write your prediction.
- Then write what you notice about your graph.
- Write anything you were surprised by.
- Answer the investigative question.
Example of possible student output (Note for the teacher: Rm 2 students are 9 years old, this is an example to show how it might look, however you will use your own class data)
Investigative question: What are the heights of the students in Room 2?
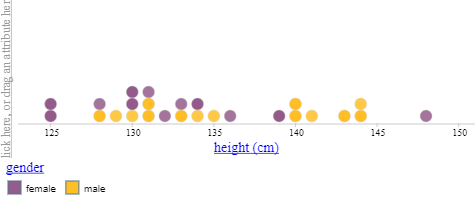
I predicted that the Room 2 heights would be around 135cm because that is my height and I think I am in the middle of heights in our class.
I notice that the heights of students in Room 2 range from 125cm to 148cm.
I notice that there is a big group of students who have heights from 128cm to 136cm.
I notice that the middle height is around 133-134 cm.
I was surprised that the tallest student was a girl.
Answer to the investigative question:
The heights of students in Room 2 range from 125cm to 148cm. Most students are between 128cm and 136cm.
Session 8
In this session students will be learning about describing summary distributions with a focus on describing the middle of the data.
SLOs:
- Describing the middle of the data distributions for quantitative data
Activity 1: Describing the middle
Two investigative questions are explored as we learn how to do new things in CODAP to support our data analysis.
Note: the examples below are using a fictitious Rm 2 group of students. Replace your class name in the question and the statements. The data your students use will be different to this example.
Investigative question 1: How long does it take students in Rm 2 to get to school?
Get students to make a display to answer the investigative question. They will need to choose the right variable (attribute) to display.
Introducing the idea of the median, this is the middle of the data
Make the graph using CODAP for time taken to get to school.
Select the ruler (measures) and tick count and add a movable value.
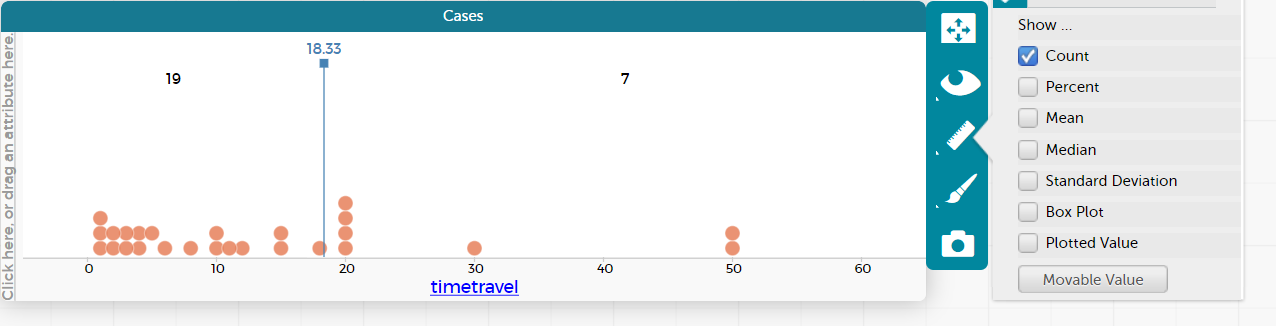
Ask the students what they see on their graph now.
If they haven’t already it might be useful to spread the x axis out a bit. This can be done by dragging the bottom corner along so that the graph is wider.
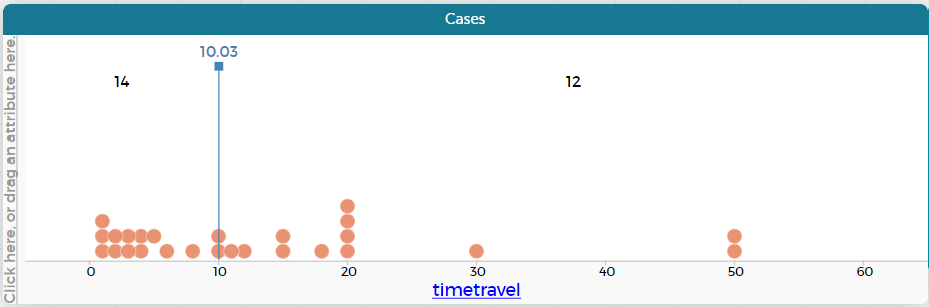
They should see a line with a number in blue with a number on the top and two values, one to the left of the line and one to the right of the line.
Discuss where the middle value would be, e.g. for this graph it would be the middle of (19+7) 26 which is 13, that is 13 on each side of the movable line.
Therefore, we want to move the movable value so that the counts are about half each side.
The place that we settle the movable value at is the middle value or the median. The median is the technical statistics term for the middle value in a set of data when the data are placed in order from smallest to largest.
Get the students to read of the middle value from their graph. In this example the middle value (OR middle time to school) is 10 minutes (always include the unit).
They should now write a statement in a text box under their graph that says…
The median time it takes students in Room 2 to travel to school is __________ minutes.
Repeat the idea for the second investigative question
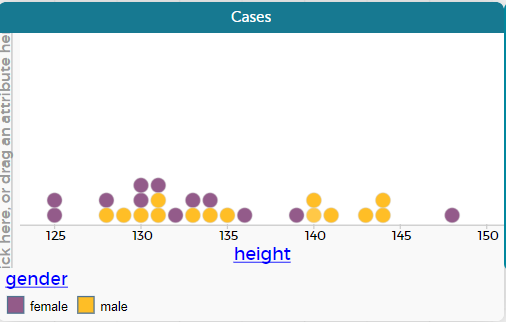
Investigative question 2: What are the heights of the students in Rm 2?
Students make the graph for heights.
They click on the ruler and select count and movable value.
They move the line until they have about half on each side.
They write a statement about the middle value of their graph.
The median height for students in Rm 2 is _________cm.
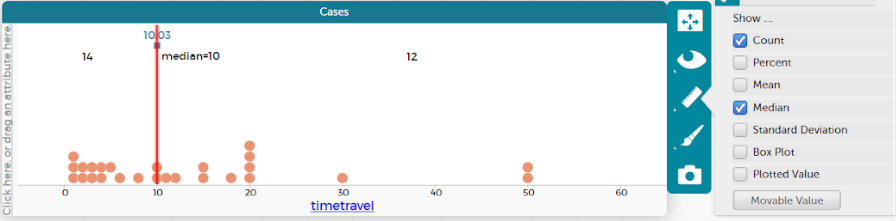
This special value can be found using CODAP measures tool. Click on the ruler and then select median. They should get a red line showing the median. By hovering over this red line, they can find the median value, e.g. for time travel see picture below.
Introduce the idea of the middle 50% of the data
The “signal” for the data is often where the middle 50% of the data is.
Go back to the time travel graph
Untick median
Tick movable value (add) so there are two movable values on the graph
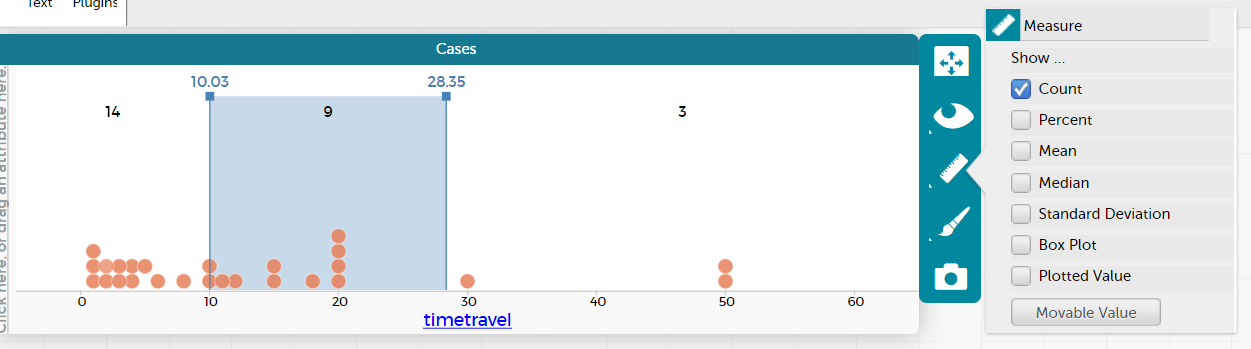
Discuss with the students how many people would be in the middle 50% (in this case 13). This would leave 13 outside the middle 50% or 6/7 either side.
Move the lines so that the counts match this or are very close to this.
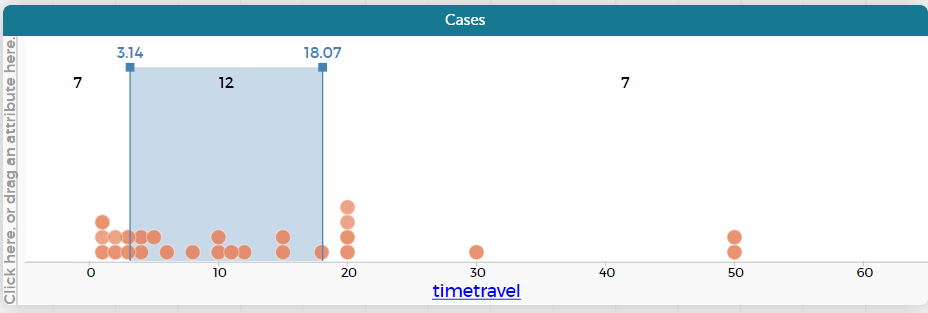
Read the values for the middle 50%, in this case it would be 3 minutes for the bottom value and 18 minutes for the top value.
We would describe this as the middle 50% of times taken to travel to school for students in Rm 2 is between 3 minutes and 18 minutes.
Repeat idea for the heights data.
Other things to describe
- Students can also describe the highest and lowest values e.g. the times taken to travel to school for students in Rm 2 range from 1 minute to 50 minutes.
- They might also notice things that are interesting or unusual e.g. I notice that two people in Rm 2 take 50 minutes to travel to school, this is 20 minutes more than the next longest time.
- Students might add gender to a graph to see if anything interesting happens there e.g. they might notice that the tallest student in Rm 2 is a girl.
Session 9
In this session students start to explore their Crunch the Coach data. They are looking at summary situations - where we summarise one variable e.g. looking at the number of catches in our initial data collection, looking at the arm lengths, looking at the total number of throws etc.
SLOs:
- Poses investigative questions about summary situations
- Makes predictions/assertions about what they expect to find out
- Explore summary data, using representations to analyse and display the data
- Answers the investigative question using evidence
Activity 1: Exploring Crunch the Coach data
In this activity students are using the PPDAC cycle to explore the Crunch the Coach data. Students could do the investigation in a pre-prepared template (Copymaster 6), or they could complete all parts within the CODAP document.
The pre-prepared template gives an example of using the whole PPDAC cycle, using the statistics skills they have learnt so far.
Posing summary investigative questions
This activity continues with the variables and ideas developed in the example. It is possible that some of the variables decided on by the class will be different to those below. Adjust accordingly.
In pairs decide at least two variables you want to investigate from
- Initial stationary catch
- Initial moving catch
- Initial total catch
- Initial total throw
- Height
- Arm length
- Right foot length
- Handspan
- Technique score
- Previous experience/play more sport score
- Attitude score
Students develop an investigative question or questions based on their area of interest. These are the questions they ask of the data; it is the question that they will act as data detectives, using the PPDAC cycle to answer it.
Prompts to help with posing investigative questions are:
- What is the variable that you want to ask about? select from list above
- Describe the group that you are asking about? The class, use the class code or room number
- Are you going to be looking at summarising data, or looking for a relationship between two variables/attributes? initially summary investigative questions
Predictions
Once students have posed their investigative questions get them to make a prediction about what they expect to find and why they have predicted this. E.g. it is what happens with their friends; they are a good cricket, netball, basketball, softball player and used this knowledge to inform their prediction.
Data
Share with the students the Crunch the Coach data (this was prepared after Session 6).
Analysis
Students make graph(s) in CODAP. They should also find the median and the middle 50% using CODAP. The students write I notice statements about what the graph is showing them. Remembering to include the VARIABLE, VALUES and UNITS in their statements.
Conclusion
Students answer their investigative question, selecting the best evidence from their I notice statements.
Students reflect on what surprised them when they analysed their data.
Additional investigations
Repeat for a variety of variables.
Students share with rest of class through… google slides, google docs
Students are invited to reflect on other students' displays.
Session 10
In this session students are introduced to scatter plots and exploring relationship situations.
The focus in this activity is on situations where the paired data is equal e.g. height and arm span. The idea is to introduce students to scatter plots by looking at where the data is equal, and then the two areas, above the “y=x” line and below the “y=x” line. Also, they can look at how close the “scatter” is to the line.
All the exploration will be done using CODAP and a different data set that has height and arm span data.
Explorations include:
- How to make a scatter plot
- How to draw the “y=x” line e.g. arm span = height
- How to describe the graph
- How to find differences i.e. add a new attribute and insert formula
- Connecting this to the analysis they will do for their investigation for Crunch the coach, exploring before and after throwing and catching data. This is like analysing experiment data, the scatter plot allows us to show the improvement, that is if the data is above the post=pre line, but the actual analysis of the improvement is done through the difference data.
SLOs:
- Exploring relationship data
- Learning how to draw scatter plots
- Describing relationship situations
- Finding differences using CODAP tables and making difference graphs
Activity 1: Making a scatter plot
Students log in and follow the link to the CODAP document
Data set used:
https://codap.concord.org/releases/latest/static/dg/en/cert/index.html#shared=113290
Talk about how we have looked at single variables previously, e.g. height, eye colour, how they get to school
We are moving to looking at two variables, called paired variables
Show graph with two axes and labelled variable A, variable B
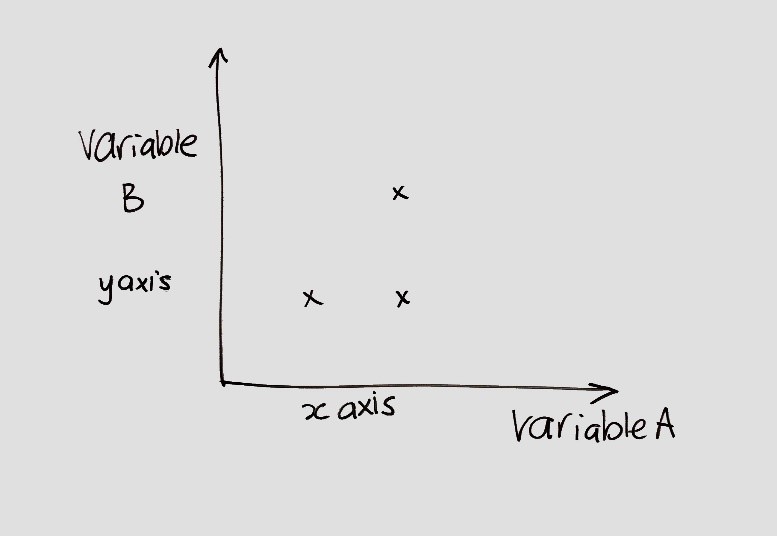
Make the link to graphing pairs of data (have they plotted coordinates before?)
Show example of how this works (see picture above)
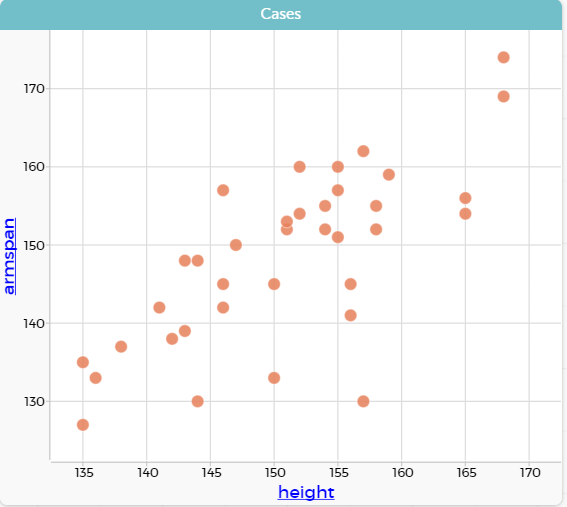
Get the students to graph height and arm span on a graph in CODAP:
- Make a graph
- Drag height onto the horizontal axis (x axis)
- Drag arm span onto the vertical axis (y axis)
Once this is done they can also try making
- Wrist and neck
- Right foot and height
- Bag weight and byod weight
- Ask them why they think they are called scatter plots
Finding out where variable B = variable A
To analyse their initial and post data for throwing and catching the students will look to see if the post data is greater than, equal to or less than their initial data.
Add in the line arm span = height
- Click on the ruler
- Tick plotted function
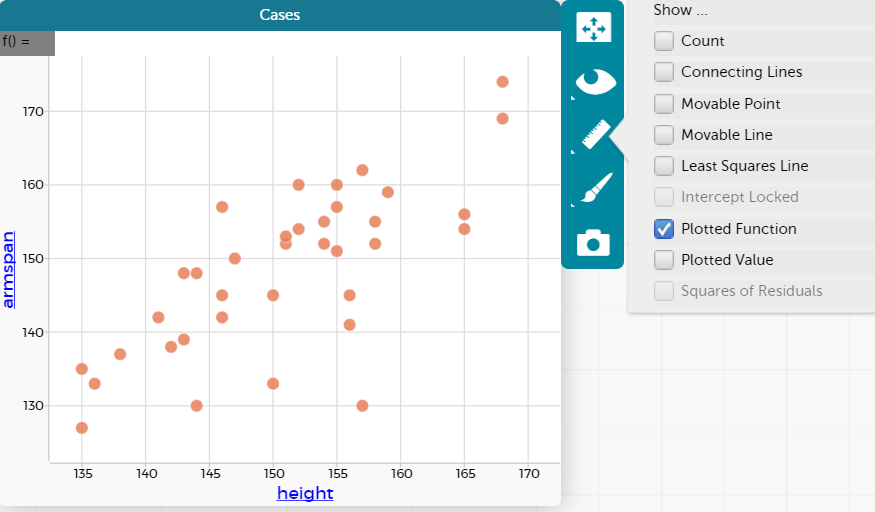
What has changed on the graph?
- Notice that there is a grey box on top LH that says f()=
- Discussed that this is a notation for y=
- Connected to y axis when graphing, the vertical axis
- In this case the vertical axis is arm span, so we want to plot arm span = height
- Click on f()=
- Window pops up
- Type in height - it should be pink when it is spelled correctly and with the right case
- Click on apply, a red line should appear on the graph
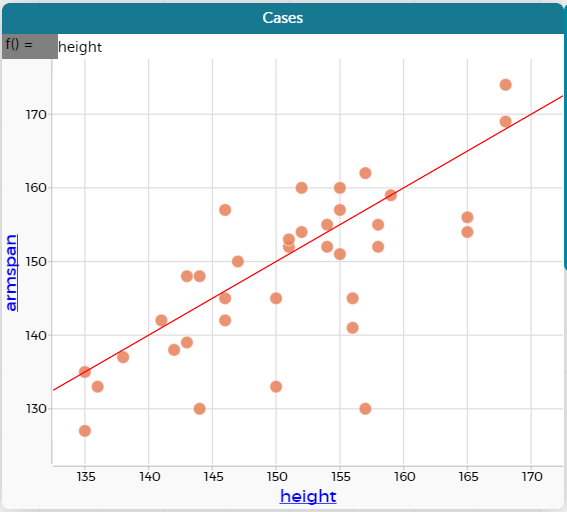
- Click on f()=
Describing scatter plots
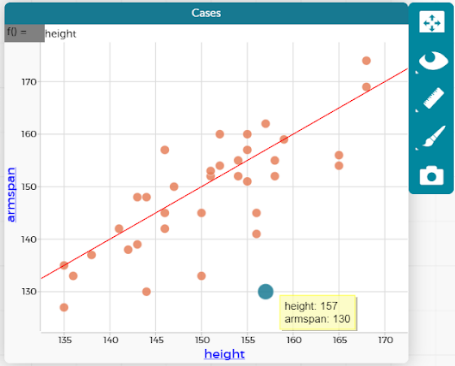
What do you notice about the arm span = height line? How many are on the line, and describe them.
- I notice that two students have the same arm span as height.
What do you notice about the points above the line?
- I notice that 15 students have a longer arm span than height.
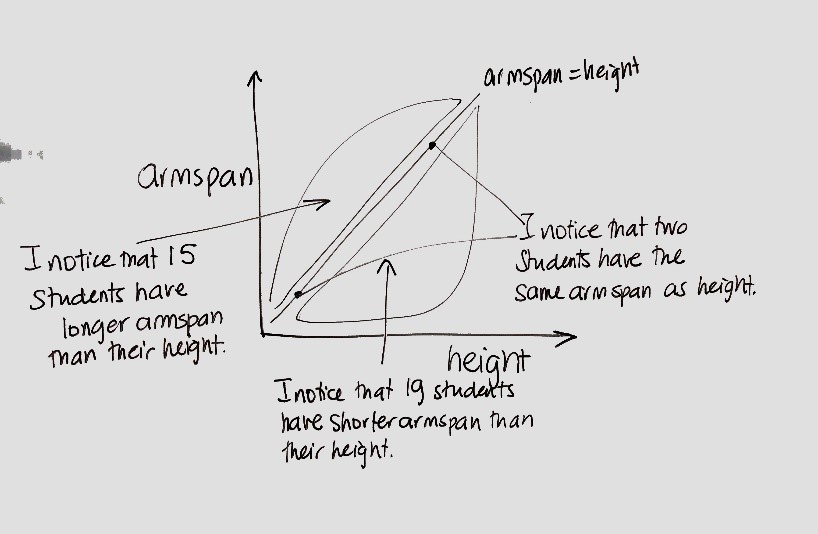
What do you notice about the points below the line?
- I notice that 19 students have shorter arm span than their height.
What do you notice about the amount of scatter?
- I notice that the students who have a longer arm span than height are scattered close to the arm span = height line.
- I notice that the students who have a shorter arm span than height are more scattered from the arm span = height line.
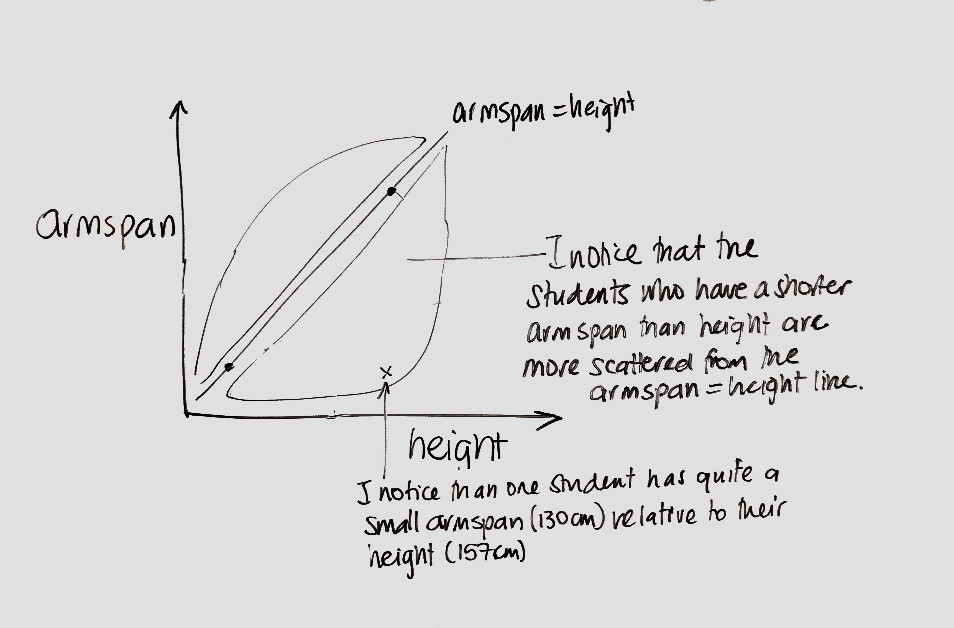
Do you notice any unusual values?
- I notice that one value has quite a small arm span relative to their height, the height is 157cm and the arm span is 130cm (see blue dot on the graph)
Activity 2: Finding the difference between two variables
Finding the difference between two variables - in this case between arm span and height
With the pre and post data that the students will have to analyse they will need to look at the difference between their initial throwing and catching data and their end of term throwing and catching data.
A lot of the data will likely double up, mostly all they will be able to use the scatter plot for is to show that most if not all of the students have improved, hence the importance of also looking at the difference.
To find the difference:
- Insert a new attribute
- Make sure the data table is in the table view (not the data card view)
- Click on the header bar so that the menu appears - this also means that a circle in grey with a + sign shows up
- Click on the grey +, this puts in a new column in the table
- It has a heading newAttr, type over this with the new name - in this case it can be called difference (as we are finding the difference between the arm span and height), then click Enter.
- Find the differences
- Click on the label - difference this brings a pop up, select Edit formula
- The formula window pops up, enter the formula for the difference in this case armspan-height (note that for the throwing and catching data it will be post-pre).
- Click on apply and the difference column fills up automatically for all students
- Graph the difference data
- Click on graph
- Drag and drop difference into the graph
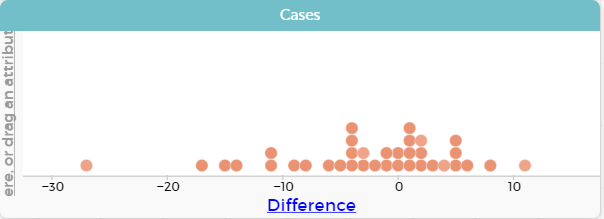
- Drag the corner to stretch the graph, this will bring the numbers up.
- Make the connections between the difference graph and the scatter plot, this can be done by selecting different values.
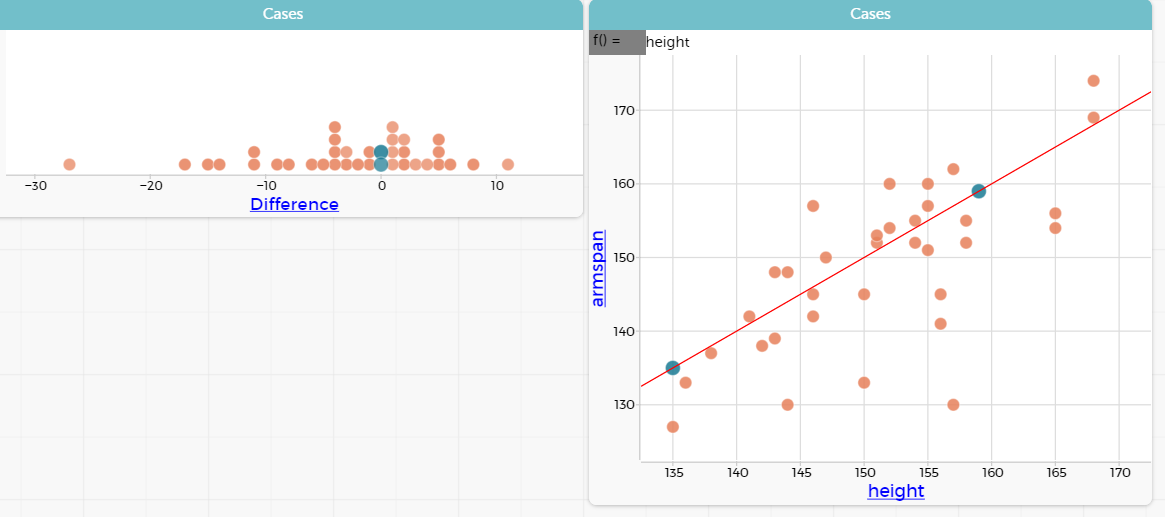
Here the two students with difference of zero have been highlighted, this also shows the two students who have the same arm span as height. - You might also choose to highlight those who had a positive difference (the students who had a longer arm span than height), those who had a negative difference (the students who had shorter arm span than height).
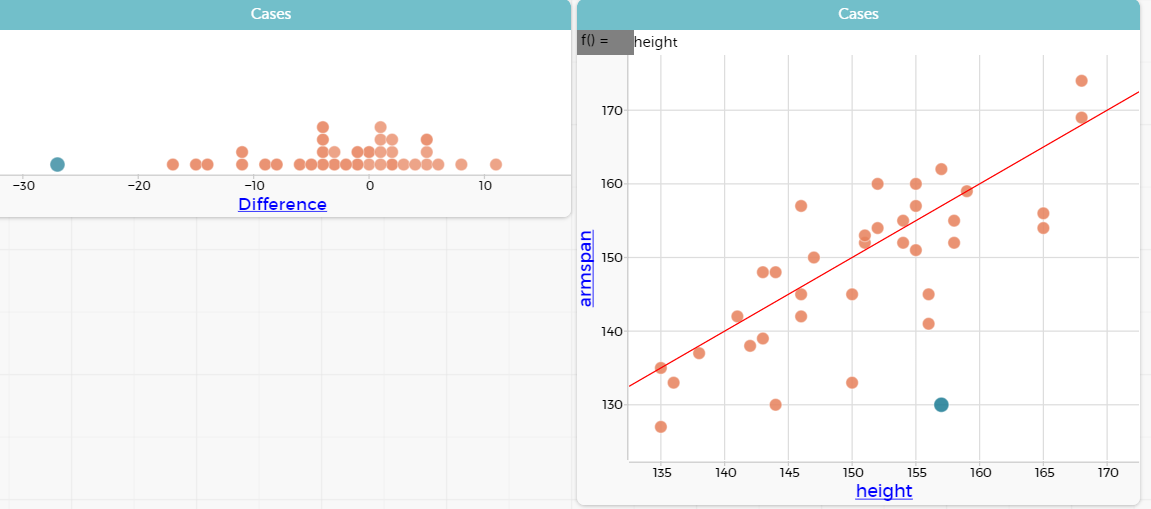
- We can also see that for the highlighted student in the graph below, the difference between their arm span and height is very large compared to the rest of the students, I wonder if the measurements were taken incorrectly?
Session 11
In this session students are collecting their end of unit throwing and catching data (or their post data). This will be done the same way as the initial or baseline data was collected. See Copymaster 4.
Teacher follow up activity
It is probably easiest to collect in the post data cards and enter the information into the google sheet, clean up the google sheet, remove student names and then download into a CODAP document to share with the students for the next session.
Session 12
In this session the students will write up their analysis for the investigative questions based on the second of our explorations identified in Session 1: If instruction and practice improve our ability to throw and catch.
SLOs:
- Using the PPDAC cycle to complete a relationship investigation.
Activity 1: Using PPDAC to explore Crunch the Coach data
Overarching Problem: Did instruction and practice improve our ability to throw and catch?
Task
- You will have three investigative questions to explore using the data collected on catching and throwing.
- Do each question in a separate CODAP document
- Complete the investigation including analysis and conclusion for one question before moving onto the next one.
Problem
INVESTIGATIVE QUESTIONS – these are examples of the types of catching and throwing that could be collected, you will need to adjust according to the situation at your school.
- Did instruction and practice improve our ability to catch when static?
- Did instruction and practice improve our ability to catch when moving?
- Did instruction and practice improve our ability to throw?
Data
Share the link from the data you have organised at the end of the previous session with the students. Encourage them to save the CODAP document straight away.
Get students to find the difference between the final and initial numbers for the static catch, the moving catch and throwing as they will need this for their analysis (refer back to Session 10 on how to do this).
Analysis
For each investigative question students undertake statistical analysis to help them to answer the investigative question.
GRAPHING
They should:
- Make a scatter plot of the initial and final data (recommend final data is on the vertical axis)
- Make a graph showing the differences between final and initial data
They may want to:
- Make other graphs to help them answer the investigative question
DESCRIBING
They should:
- Describe what the data is showing in each of your graphs
Hints:
- Refer to what they did in Session 10
- They might like to highlight data in one graph and see what it shows in another graph to help them to write what the data is showing
Conclusion
- Answering the investigative question. This will include pulling evidence from the analysis to help.
Expected evidence
- A separate CODAP document for each of the investigative questions.
- At least two different graphs for each investigative question.
- A text box with the description of the graphs – students might use “I notice…” statements to help them write the descriptions.
- A text box with the investigative question and the conclusion/final answer.
Possible Assessment Schedule
| Achieved | Merit | Excellence | |
| Analysis Displays | Plotted a scatter plot | Plotted a scatter plot and difference graph | Plotted a scatter plot and difference graph. Shows statistical insight |
| Analysis Description | Described the data based on one graph | Described the data using evidence from more than one graph | Described the data using evidence from more than one graph. Shows statistical insight |
| Conclusion | Attempts to answer the investigative question | Answers the investigative question using evidence | Answers the investigative question using statistical insight |