The purpose of this activity is to engage students in the evaluation of a published statistical report.
This activity assumes the students have experience in the following areas:
- Comparing groups using sample statistics.
- Comparing distributions visually be attending to shape, centre, and variation (spread).
- Making calls about differences between groups.
The problem is sufficiently open ended to allow the students freedom of choice in their approach. It may be scaffolded with guidance that leads to a solution, and/or the students might be given the opportunity to solve the problem independently.
The example responses at the end of the resource give an indication of the kind of response to expect from students who approach the problem in particular ways.
In the newspaper article, ‘Which Social Media for Teens?’, it was reported that young people are using different forms of social media than they did a few years ago.
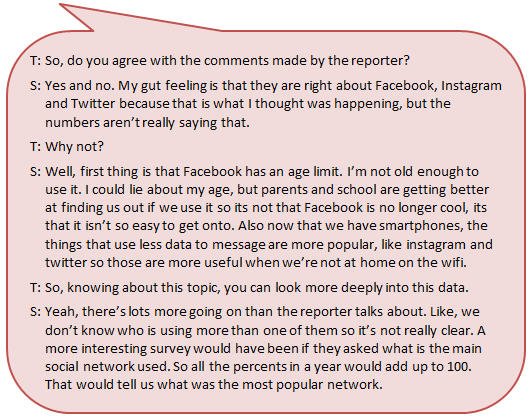
Read the article below and comment on whether the reporter’s statements are consistent with the survey data.
Which Social Media for Teens?
It looks like Facebook is no longer cool amongst the teens of today. Instagram and Twitter have taken over the most popular social networks among American children and these kids are ditching Facebook.
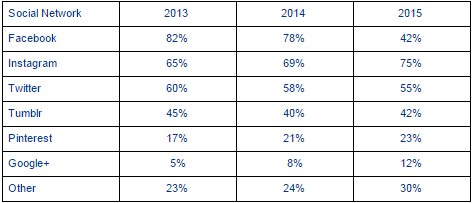
Research has shown that today’s teens are no longer using Facebook. Rather, they are using Instagram and Twitter. There has been a steady decline in the usage of Facebook, with all other social networks increasing in popularity. Surveys of 15,000 social network users between the ages of 13 and 19 over the past three years, gave the following results:
Source: This article has been created for the purpose of this statistics exercise and is not from any publication.
This problem involves evaluating a statistical report. Evaluation requires students to consider whether the author reports on parts of the Statistical Enquiry Cycle.
Problem
The problem section is about what data to collect and who to collect it from and why it’s important.
- Does the report have a clear investigation question?
- Is my question a summary, comparison, or relationship question? (The data is time series so the question should relate to patterns over time.)
- Why is the question important?
- Who will find the answer useful? Why will it be useful?
- Has the author provided background contextual information?
Plan
The planning section is about how students will gather the data.
- Has the report made use of appropriate data for answering the question?
- Does the report clearly show its source of data?
- Is the data trustworthy and ethically collected?
- What are the variables? Are the variables appropriate to the question?
- Does the report appear to be balanced of biassed?
Data
The data section is concerned with how the data is managed and organised.
- Does the report indicate how the data was analysed?
- Is it clear how the data was cleaned and displayed to look for patterns and trends?
- What digital or written tools were used?
Analysis
The analysis section is about exploring the data and reasoning with it.
- Does the analysis of the data address the question?
- Does the report share what patterns and trends were found?
- Are displays provided to clearly show the patterns and trends?
- What variations were visible in the data? What might be the causes of that variation are suggested?
Conclusion
The conclusion section is about answering the question in the problem section and providing reasons based on their analysis.
- Has the report answered the original question? If not, why not?
- Is the summary of findings clearly written so you can understand it?
- Does the evidence convince you? Why, or why not?
- What displays best show the patterns and trends?
- Has the report ignored important causes of variation?
- Are the variables appropriate or should the author have used others?
- Does the author connect the finding to context?
- Are the limitations acknowledged, such as period of data collection, sample sizes, etc.?
Examples of work
Work sample 1
The students lists the main claims within the report. They find facts from the data that are relevant to each argument and take a position that Facebook is still widely used by teens.
Click on the image to enlarge it. Click again to close. 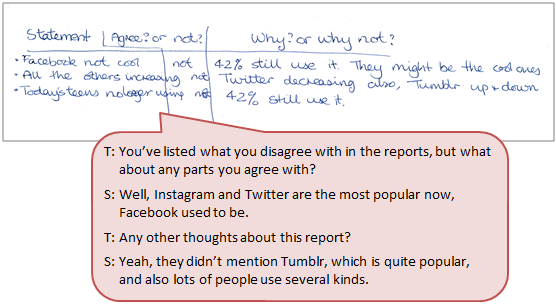
Work sample 2
The students takes an informed position about claims in the report. They consider both data in the report and their contextual knowledge to evaluate the claims.
Click on the image to enlarge it. Click again to close.